Regression Correlation Background Defines relationship between two variables

Regression Correlation Background Defines relationship between two variables X and Y R ranges from -1 (perfect negative correlation) 0 (No correlation) +1 (perfect positive correlation) R=. 689

Regression Correlation Background R 2 Indicates reduction in error knowing X and Predicting Y R 2 ranges from 0 (No reduction in error) 1 (complete reduction in error) R 2=. 474

Regression Examples Predicting height from G. P. A. R 2 = 0 (Knowing height does not help predict G. P. A – best guess is always mean G. P. A. ) R 2 = 1 (Knowing height in CM completely predicts height in Inches)

Regression Real world examples are somewhere in between Predicting height from weight R 2 =. 36 (Knowing height somewhat helps predict weight)

Regression But how do we figure out HOW to make that prediction given one of the variables?

Regression Need background concept of slope How much does Y change for a given change in X? All lines have R=1

Regression All lines have R=-1

Regression Need background concept of INTERCEPT What is Y when X=0? All lines have Same Slope but different intercept

Regression Unique line is defined by Slope and YIntercept Y=b. X+a b=slope a=Y-Interecpt

Regression Predicting depression from loneliness Y= BDI Depression X= Loneliness Y=2 X+2

Regression Predicted vs. Actual R=1, R 2=1 No Error Never happens like this in real world

Actual scores don’t fit on a line perfectly
2")
Some possible solutions? Error is Sum of (Predicted Y-Actual Y)2

Where is the line with smallest error? Least Squares Regression Line

Where is the line with smallest error? Least Squares Regression Line Calc slope=b= Σ (X-X)(Y-Y) ----------------------------- Σ (X-X) =2. 13 with this data

Where is the line with smallest error? Least Squares Regression Line Calc y intercept = a Y- (b)(X) =4 with this data So Least squares regression line is Y=2. 13 X+4

Where is the line with smallest error? Least Squares Regression Line
2 X Score Actual Y")
How good is our prediction? Sum of (Predicted Y-Actual Y)2 X Score Actual Y score Predicted Y score Squared Error 0 5 4. 00 1 7 6. 13 0. 75 2 8 8. 27 0. 07 3 11 10. 40 0. 36 4 8 12. 53 20. 55 5 15 14. 67 0. 11 6 17 16. 80 0. 04 7 22 18. 93 9. 40 8 18 21. 07 9. 40 9 25 23. 20 3. 24 4. 5 13. 6 44. 93

Can we standardize this for an average Error? Yes: Standard error of the estimate Like a standard deviation Gives average precition error per score Standard error of the estimate = SQRT(SSresidual/Npairs-2) In this example = SQRT(44. 9/10 -2)=SQRT(44. 9/8)=2. 36
 Non Parametric Statistical tests Used for nominal data (categories) ordinal (ordered categories)")
Chi-square (χ2) Non Parametric Statistical tests Used for nominal data (categories) ordinal (ordered categories) non-normal interval/ratio data
")
Goodness of fit χ2 Used with nominal data Tests a DISTRIBUTION (not a mean) Sees if observed data FITS an expected distribution H 0=true frequency distribution is expected H 1=true frequency distribution has some other form

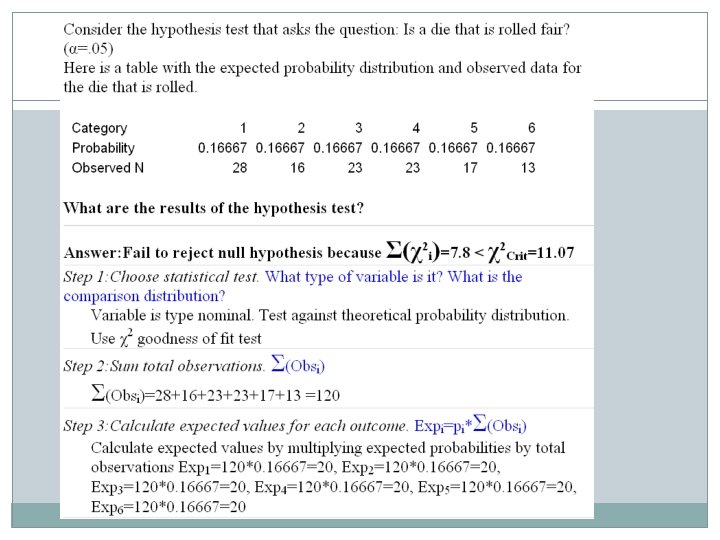
VEGAS BABY!!! Rolling dice at the Mirage Lots of Snake Eyes coming up Are the dice fixed? Test with goodness of fit Does our distribution FIT the expected distribution
 has 1/6 chance")
VEGAS BABY!!! Expected distribution for 120 rolls if fair: Each die(dice) has 1/6 chance 1/6 X 120 = 20 of each type Expected Distribution = [20, 20, 20, 20]
![VEGAS BABY!!! Actual distribution for 120 rolls is: [28, 16, 23, 17, 13] Are](http://slidetodoc.com/presentation_image_h2/297b41aa7fc39b8bc9e034bb474ae0c5/image-24.jpg "VEGAS BABY!!! Actual distribution for 120 rolls is: [28, 16, 23, 17, 13] Are")
VEGAS BABY!!! Actual distribution for 120 rolls is: [28, 16, 23, 17, 13] Are these dice fair? Use Goodness of fit χ2

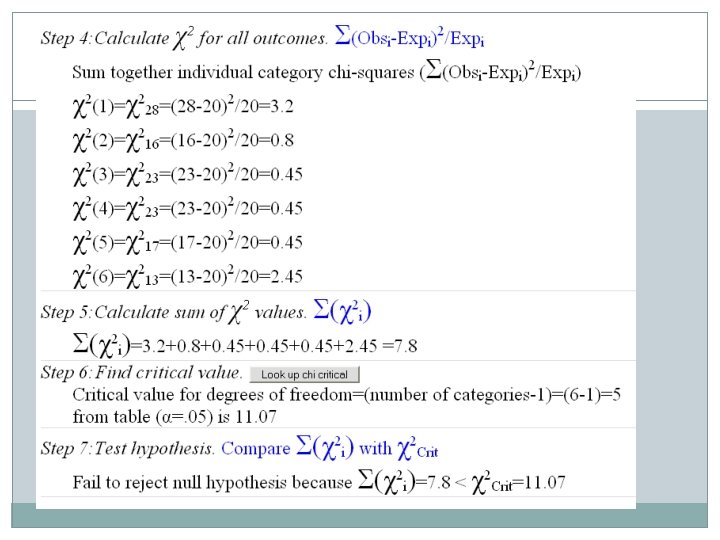
VEGAS BABY!!! Determine critical χ2 value: df = number of categories – 1 = 6 -1 = 5 χ2 critical for df=5 is 11. 07 from table
 2 / Ei 1 28 20 8 64")
Cat FAIR!!! Σ Oi Ei (Oi-Ei) 2 / Ei 1 28 20 8 64 3. 2 2 16 20 -4 16 0. 8 3 23 20 3 9 0. 45 4 23 20 3 9 0. 45 5 17 20 -3 9 0. 45 6 13 20 -7 49 2. 45 120 0 7. 8
 2 / Ei 1 56 40 16 256 6. 4")
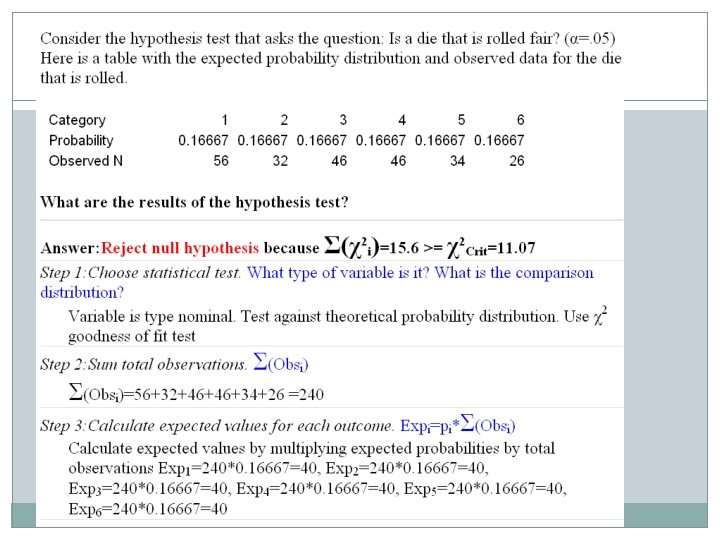
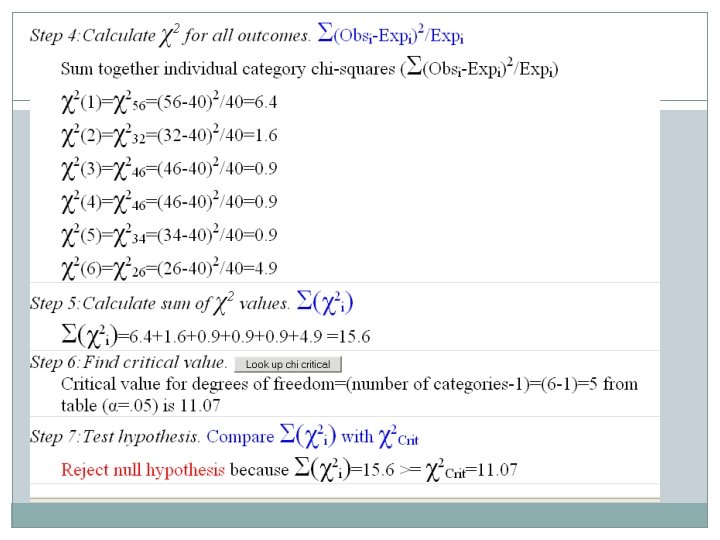
Cat Oi Ei (Oi-Ei) 2 / Ei 1 56 40 16 256 6. 4 2 32 40 -8 64 1. 6 3 46 40 6 36 0. 9 4 46 40 6 36 0. 9 5 34 40 -6 36 0. 9 6 26 40 -14 196 4. 9 240 0 CHEAT!!! Σ 15. 6

Test of independence χ2 Used with nominal data Tests whether DISTRIBUTION 1 is dependent upon DISTRIBUTION 2 H 0= Distribution 1 is independent of Distribution 2 H 1= Distribution 1 is related to Distribution 2

Example: Are Men more likely to have supported was in IRAQ 100 Subjects (50 male, 50 female) Asked yes or no question about supporting war in Iraq H 0= Gender does not affect likelihood of supporting war H 1= Gender does affect likelihood of supporting war
 (C-1) Df = (Category 1 Size -1) size")
Determine critical Value Df = (R-1) (C-1) Df = (Category 1 Size -1) size X Category 2 Size -1) = (2 -1) X (2 -1) = 1 X 1 = 1 Critical Value from A-3 is 3. 84

Set up Data Support war Not support war Total Males 32 18 Females 21 29 Total 53 47 50 50 100
 18")
Set up Data Support war Not support war Total Males 32 (26. 5) 18 (23. 5) Females 21(26. 5) 29(23. 5) Total 53 47 50 50 100
 2 / Ei M/S 32 26. 5")
Calculate observed χ2 Category Oi Ei (Oi-Ei) 2 / Ei M/S 32 26. 5 5. 5 30. 3 1. 14 M/N 18 23. 5 -5. 5 30. 3 1. 29 F/S 21 26. 5 -5. 5 30. 3 1. 14 F/N 29 23. 5 5. 5 30. 3 1. 29 100 0 Σ 4. 86

Test observed against critical observed χ2 = 4. 86 critical χ2 = 3. 84 So we reject the idea that gender does not affect support of war and conclude Gender DOES affect support of war

Mc. Nemar test for significance of change Used with nominal data Tests whether DISTRIBUTION 1 is dependent upon DISTRIBUTION 2 Same as test of dependence but uses SAME person to test nominal data before and after some event

Example: Are Men more likely to have supported was in IRAQ 100 Subjects Do you favor the pledge allegiance? Before and After terrorist attacks H 0= proportion of individuals supporting pledge before attacks is same as after attacks H 1= proportion of individuals supporting pledge before attacks is different after attacks

Determine critical Value Df = 1 for all Mc. Nemar tests Critical Value is 3. 84

Set up Data After Attacks Yes No Before Attacks Yes No 33 20 9 38 47 Total 42 58 Total 53 100

Set up Data After Attacks Yes No Before Attacks Yes No 33 20 (14. 5) 9 (14. 5) 38 Total 42 58 Total 53 47
 2 / Ei 1 9 14.")
Calculate observed χ2 Category Oi Σ Ei (Oi-Ei) 2 / Ei 1 9 14. 5 -5. 5 30. 3 2. 09 2 20 14. 5 5. 5 30. 3 2. 09 29 29 0 4. 17

Test observed against critical observed χ2 = 4. 71 critical χ2 = 3. 84 So we reject the idea that the proportions are the same Conclusion: Attacks did change the proportion who support pledge of allegiance
- Slides: 45