Regression Analysis Regression analysis is a statistical technique


 • Coefficient of determination is used to judge the adequacy")
- Slides: 32
Regression Analysis Regression analysis is a statistical technique that is very useful for exploring the relationships between two or more variables (one independent variable and the one dependent variable)
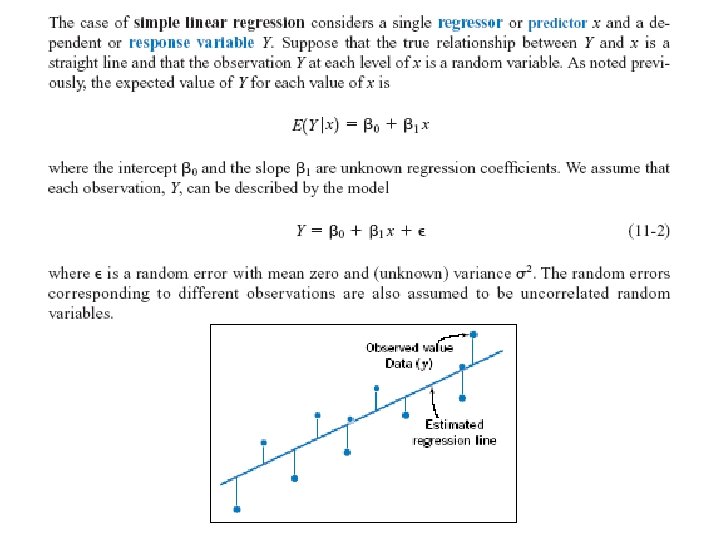
Simple Linear Regression Model
Probabilistic Linear Regression Model
The Least Square Method LSM is based on the concept of minimizing L
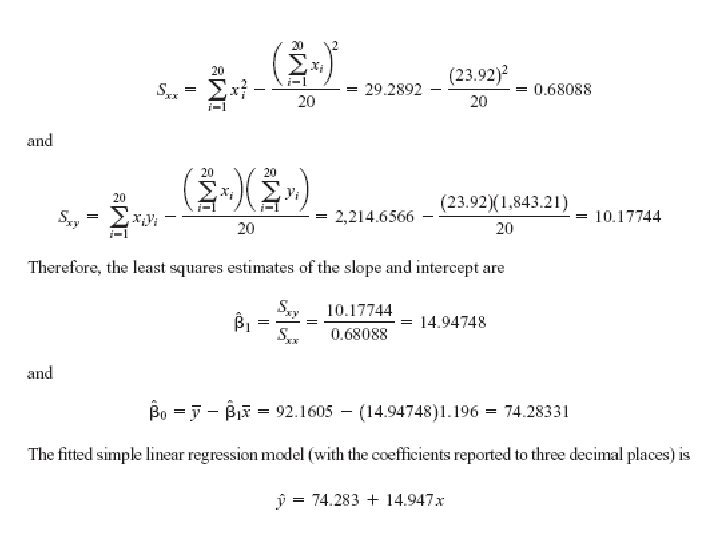
The Least Square Method
Example 11. 1
See the Excel Solution
Estimation of Variance Where SSE = Error sum of squares
Solution 11. 1
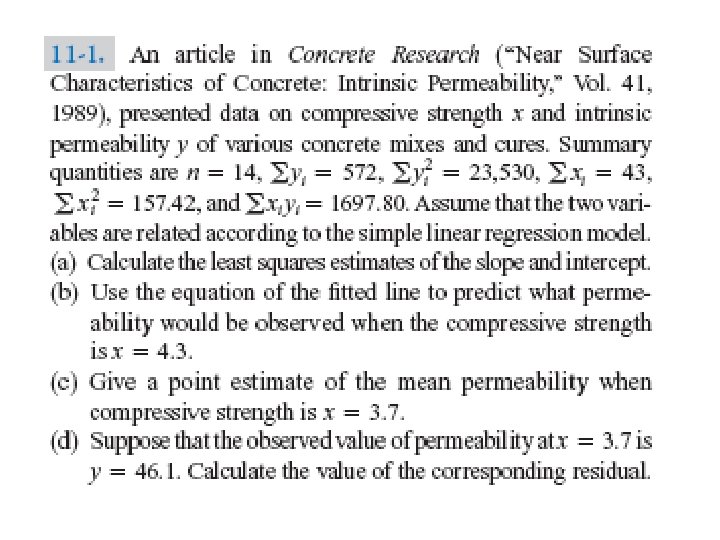
Problem 11. 11
Problem 11. 11 Solve using Excel
Standard Error of the Estimates
HYPOTHESIS TESTS IN SIMPLE LINEAR REGRESSION • Objective: – Assessing the adequacy of a linear regression model by testing statistical hypotheses about the model parameters and constructing certain confidence intervals. • Assumption: – the errors are normally and independently distributed with mean zero and variance σ2
HYPOTHESIS TESTS IN SIMPLE LINEAR REGRESSION • Suppose we wish to test the hypothesis that the slope equals a constant
HYPOTHESIS TESTS IN SIMPLE LINEAR REGRESSION
A very important special case of the hypotheses about the slope: Either x is of little value in explaining the variation in Y and that the best estimator of Y for any x is Y or that the true relationship between x and Y is not linear Rejecting H 0: Either that the straight-line model is adequate or that, although there is a linear effect of x, better results could be obtained with the addition of higher order polynomial terms in x
Example 11. 2
Analysis of Variance Approach to Test Significance of Regression The total corrected sum of squares The regression sum of squares The error sum of squares
Analysis of Variance Approach to Test Significance of Regression The above test statistic:
Example 11. 3 See the Excel solution
Confidence Intervals on the Slope and Intercept
Confidence Intervals on the Slope and Intercept
Confidence Interval on the Mean Response
Example 11. 5
Example 11. 5
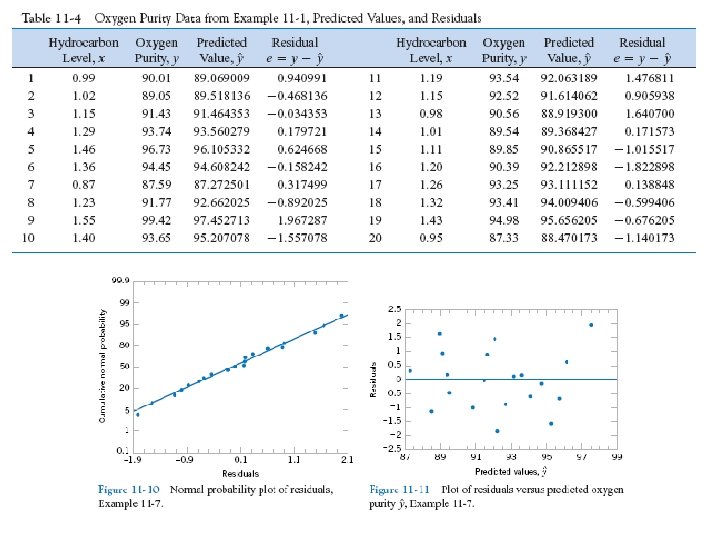
Residual Analysis • Analysis of the residuals is frequently helpful in checking the assumption that the errors are approximately normally distributed with constant variance • As an approximate check of normality, the experimenter can construct a frequency histogram of the residuals or a normal probability plot of residuals. • The analysis can also be done by ploting the residuals against the independent variable x.
Residual Analysis
Coefficient of Determination(R 2) • Coefficient of determination is used to judge the adequacy of a regression model. • R 2 is the square of the correlation coefficient between X and Y.