
Regional Synergy via CrossBorder Facilitation CTBC Example Mr
Regional Synergy via Cross-Border Facilitation CTBC Example Mr. Frank Huang, President Director Bank CTBC Indonesia 19 January 2018
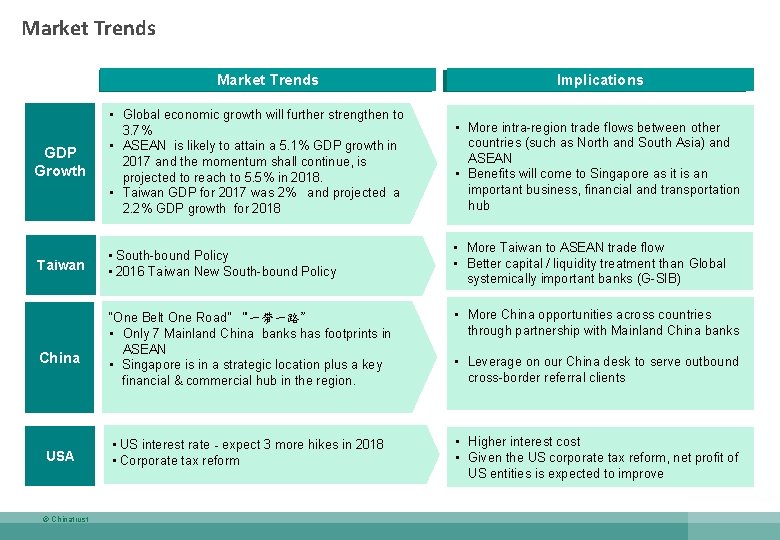
Market Trends Implications GDP Growth • Global economic growth will further strengthen to 3. 7% • ASEAN is likely to attain a 5. 1% GDP growth in 2017 and the momentum shall continue, is projected to reach to 5. 5% in 2018. • Taiwan GDP for 2017 was 2% and projected a 2. 2% GDP growth for 2018 • More intra-region trade flows between other countries (such as North and South Asia) and ASEAN • Benefits will come to Singapore as it is an important business, financial and transportation hub Taiwan • South-bound Policy • 2016 Taiwan New South-bound Policy • More Taiwan to ASEAN trade flow • Better capital / liquidity treatment than Global systemically important banks (G-SIB) China USA © Chinatrust “One Belt One Road” “一带一路” • Only 7 Mainland China banks has footprints in ASEAN • Singapore is in a strategic location plus a key financial & commercial hub in the region. • More China opportunities across countries through partnership with Mainland China banks • US interest rate - expect 3 more hikes in 2018 • Corporate tax reform • Higher interest cost • Given the US corporate tax reform, net profit of US entities is expected to improve • Leverage on our China desk to serve outbound cross-border referral clients
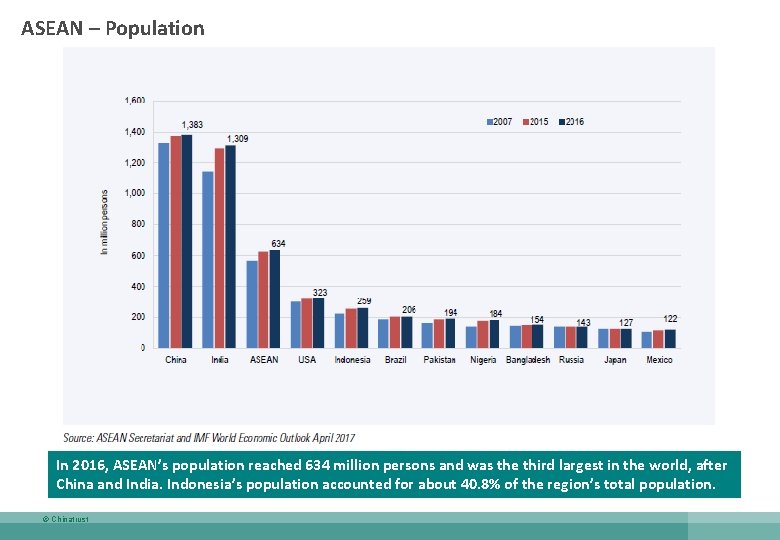
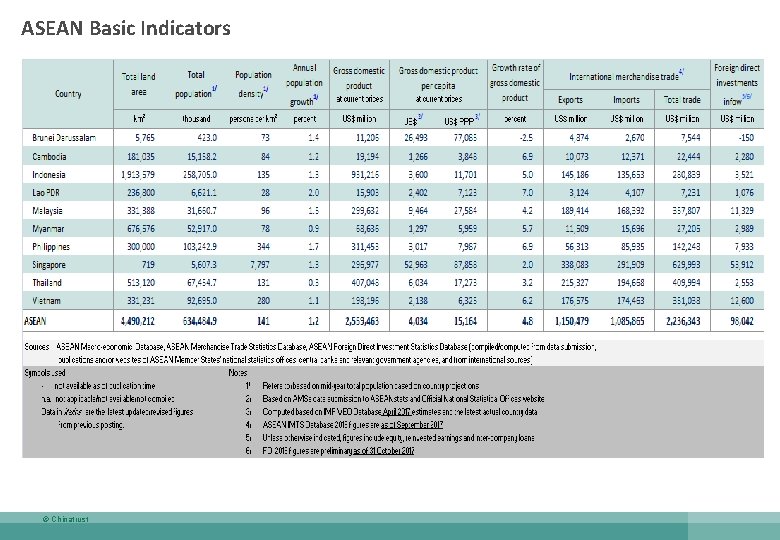
ASEAN – Population In 2016, ASEAN’s population reached 634 million persons and was the third largest in the world, after China and India. Indonesia’s population accounted for about 40. 8% of the region’s total population. © Chinatrust
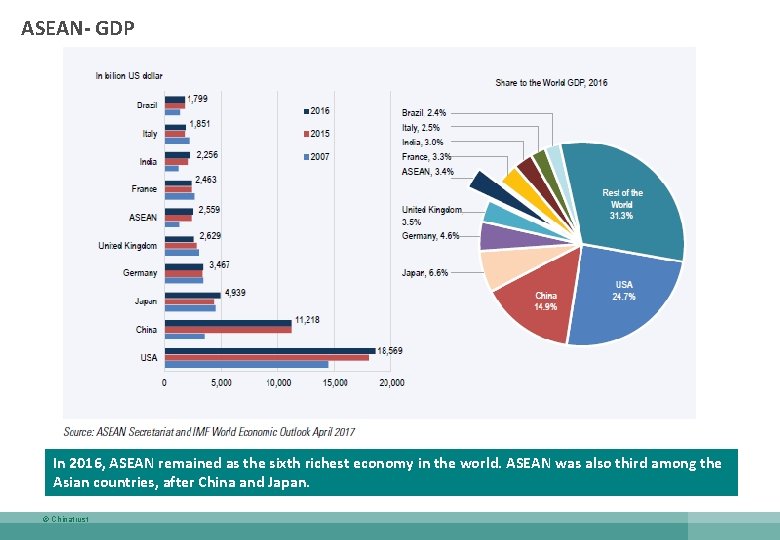
ASEAN- GDP In 2016, ASEAN remained as the sixth richest economy in the world. ASEAN was also third among the Asian countries, after China and Japan. © Chinatrust
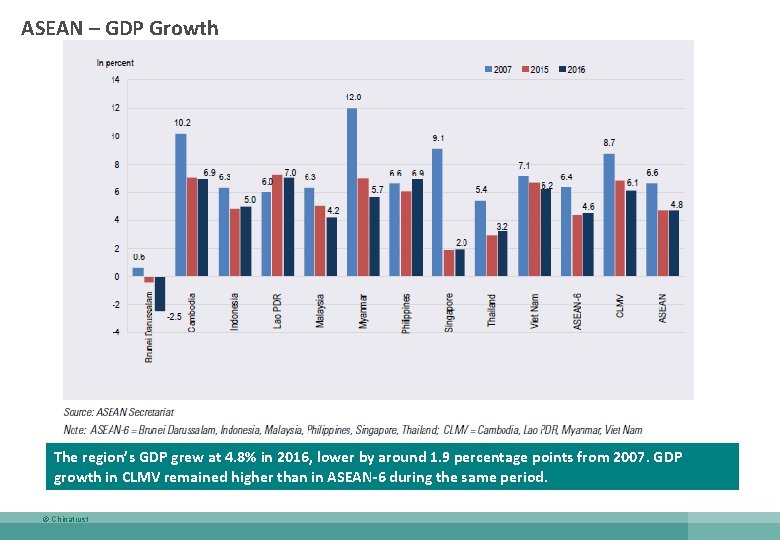
ASEAN – GDP Growth The region’s GDP grew at 4. 8% in 2016, lower by around 1. 9 percentage points from 2007. GDP growth in CLMV remained higher than in ASEAN-6 during the same period. © Chinatrust
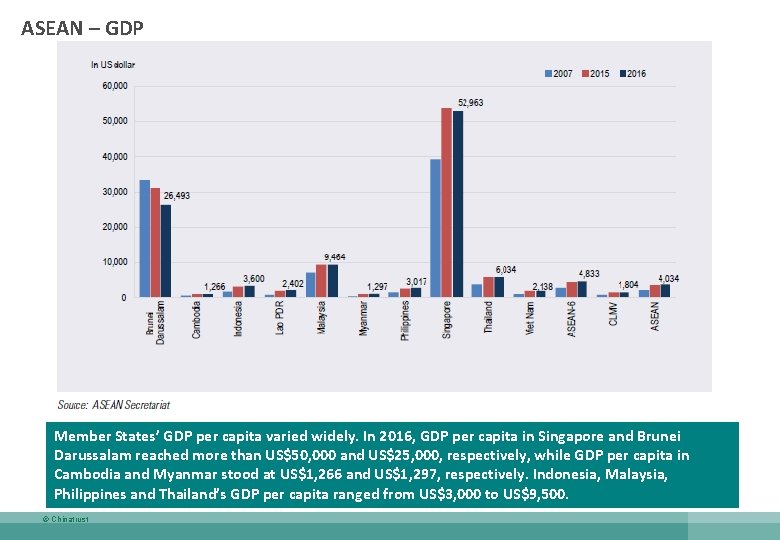
ASEAN – GDP Member States’ GDP per capita varied widely. In 2016, GDP per capita in Singapore and Brunei Darussalam reached more than US$50, 000 and US$25, 000, respectively, while GDP per capita in Cambodia and Myanmar stood at US$1, 266 and US$1, 297, respectively. Indonesia, Malaysia, Philippines and Thailand’s GDP per capita ranged from US$3, 000 to US$9, 500. © Chinatrust
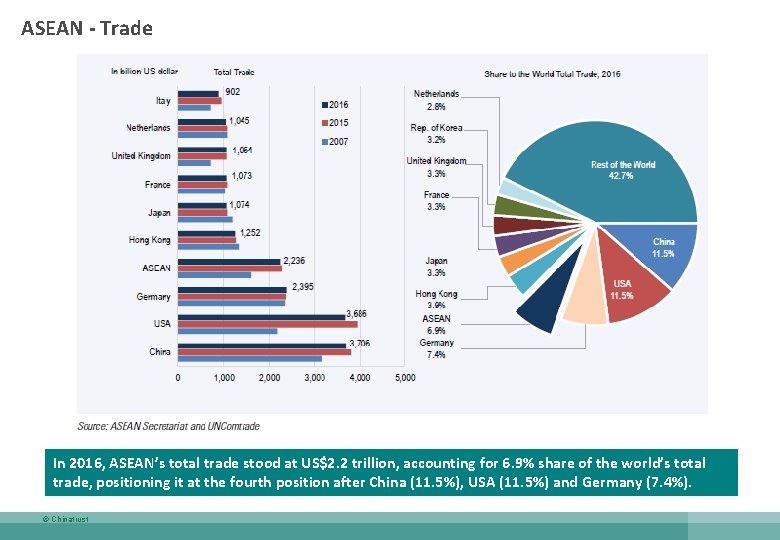
ASEAN - Trade In 2016, ASEAN’s total trade stood at US$2. 2 trillion, accounting for 6. 9% share of the world’s total trade, positioning it at the fourth position after China (11. 5%), USA (11. 5%) and Germany (7. 4%). © Chinatrust
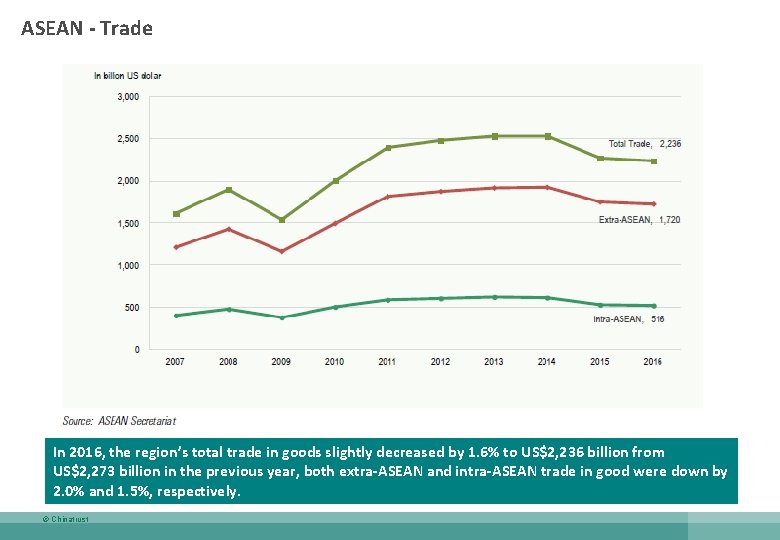
ASEAN - Trade In 2016, the region’s total trade in goods slightly decreased by 1. 6% to US$2, 236 billion from US$2, 273 billion in the previous year, both extra-ASEAN and intra-ASEAN trade in good were down by 2. 0% and 1. 5%, respectively. © Chinatrust
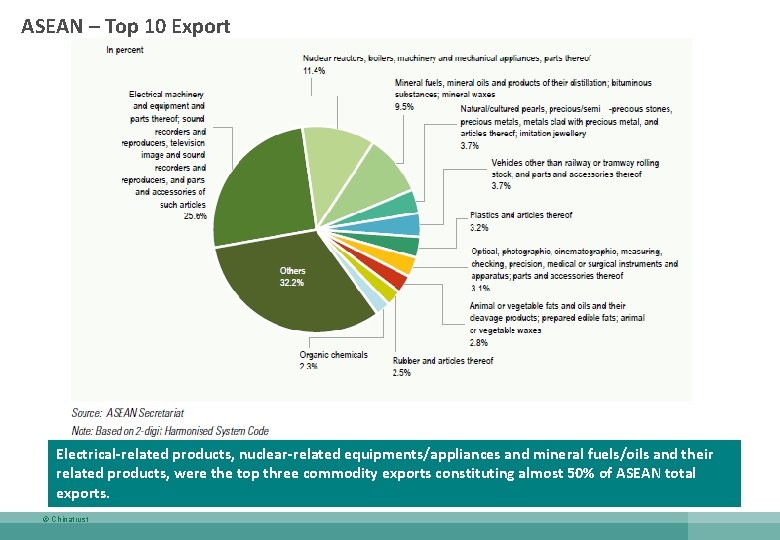
ASEAN – Top 10 Export Electrical-related products, nuclear-related equipments/appliances and mineral fuels/oils and their related products, were the top three commodity exports constituting almost 50% of ASEAN total exports. © Chinatrust
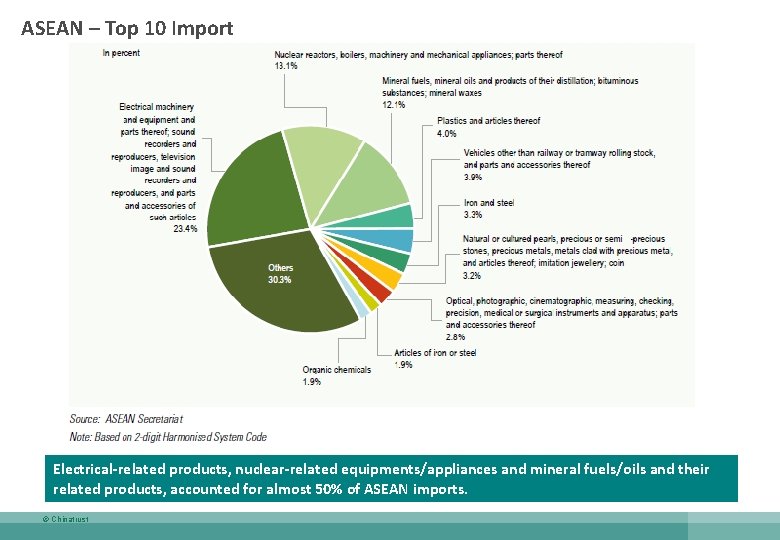
ASEAN – Top 10 Import Electrical-related products, nuclear-related equipments/appliances and mineral fuels/oils and their related products, accounted for almost 50% of ASEAN imports. © Chinatrust
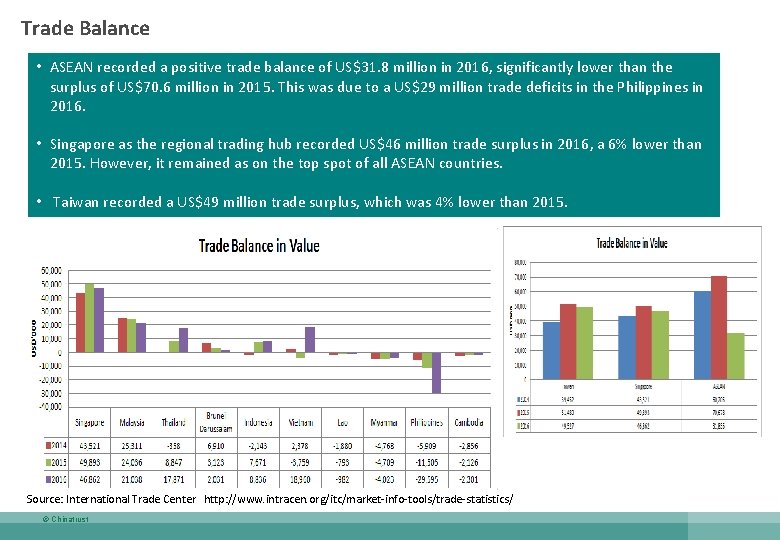
Trade Balance • ASEAN recorded a positive trade balance of US$31. 8 million in 2016, significantly lower than the surplus of US$70. 6 million in 2015. This was due to a US$29 million trade deficits in the Philippines in 2016. • Singapore as the regional trading hub recorded US$46 million trade surplus in 2016, a 6% lower than 2015. However, it remained as on the top spot of all ASEAN countries. • Taiwan recorded a US$49 million trade surplus, which was 4% lower than 2015. Source: International Trade Center http: //www. intracen. org/itc/market-info-tools/trade-statistics/ © Chinatrust
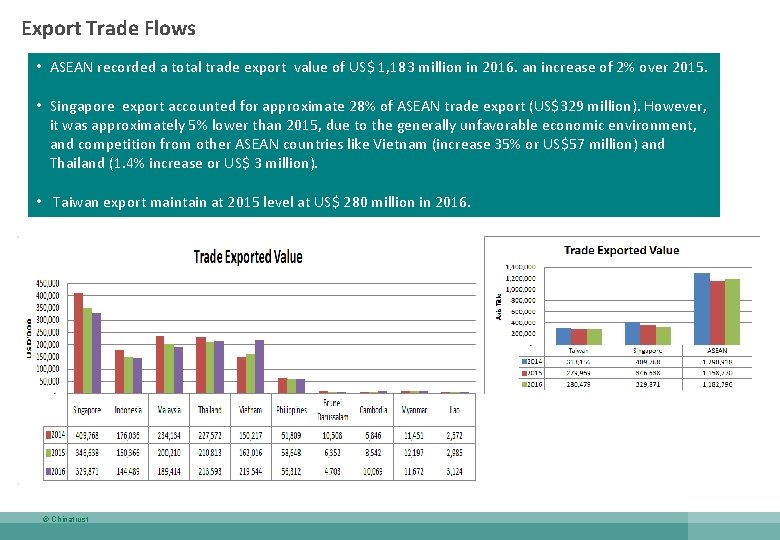
Export Trade Flows • ASEAN recorded a total trade export value of US$ 1, 183 million in 2016. an increase of 2% over 2015. • Singapore export accounted for approximate 28% of ASEAN trade export (US$329 million). However, it was approximately 5% lower than 2015, due to the generally unfavorable economic environment, and competition from other ASEAN countries like Vietnam (increase 35% or US$57 million) and Thailand (1. 4% increase or US$ 3 million). • Taiwan export maintain at 2015 level at US$ 280 million in 2016. © Chinatrust
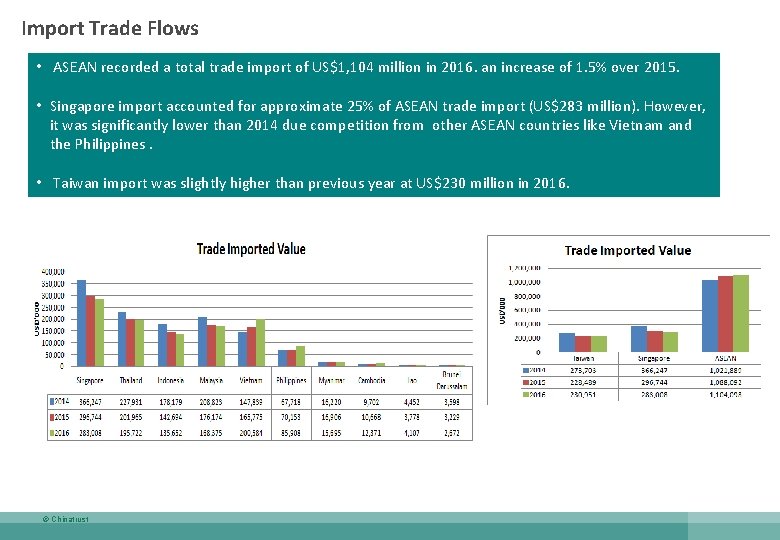
Import Trade Flows • ASEAN recorded a total trade import of US$1, 104 million in 2016. an increase of 1. 5% over 2015. • Singapore import accounted for approximate 25% of ASEAN trade import (US$283 million). However, it was significantly lower than 2014 due competition from other ASEAN countries like Vietnam and the Philippines. • Taiwan import was slightly higher than previous year at US$230 million in 2016. © Chinatrust
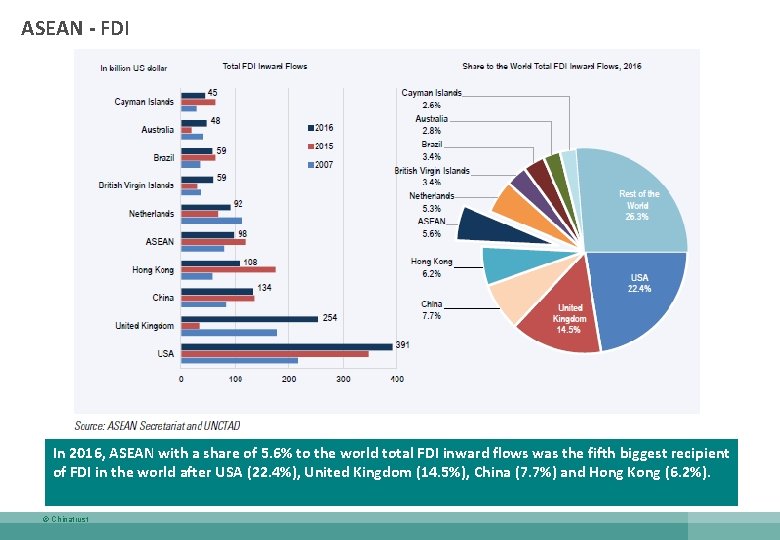
ASEAN - FDI In 2016, ASEAN with a share of 5. 6% to the world total FDI inward flows was the fifth biggest recipient of FDI in the world after USA (22. 4%), United Kingdom (14. 5%), China (7. 7%) and Hong Kong (6. 2%). © Chinatrust
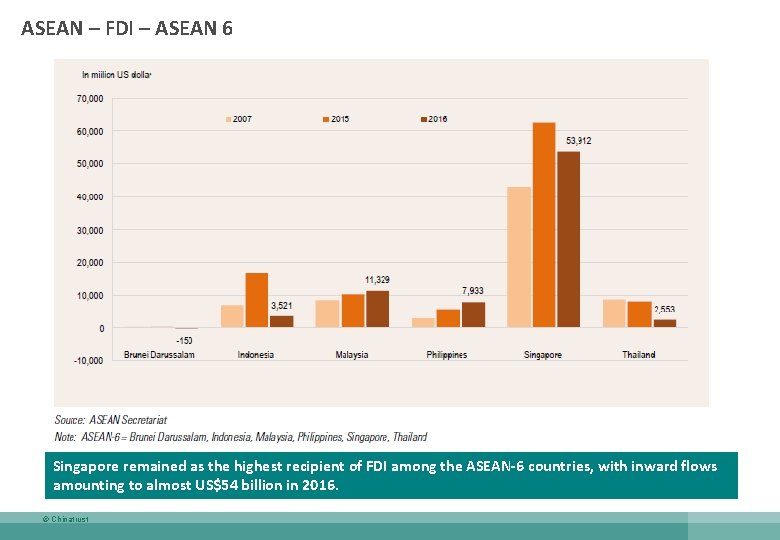
ASEAN – FDI – ASEAN 6 Singapore remained as the highest recipient of FDI among the ASEAN-6 countries, with inward flows amounting to almost US$54 billion in 2016. © Chinatrust
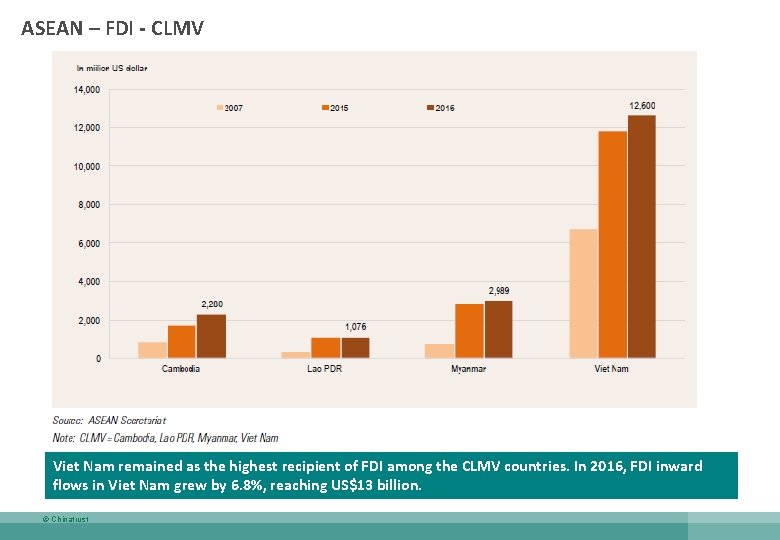
ASEAN – FDI - CLMV Viet Nam remained as the highest recipient of FDI among the CLMV countries. In 2016, FDI inward flows in Viet Nam grew by 6. 8%, reaching US$13 billion. © Chinatrust
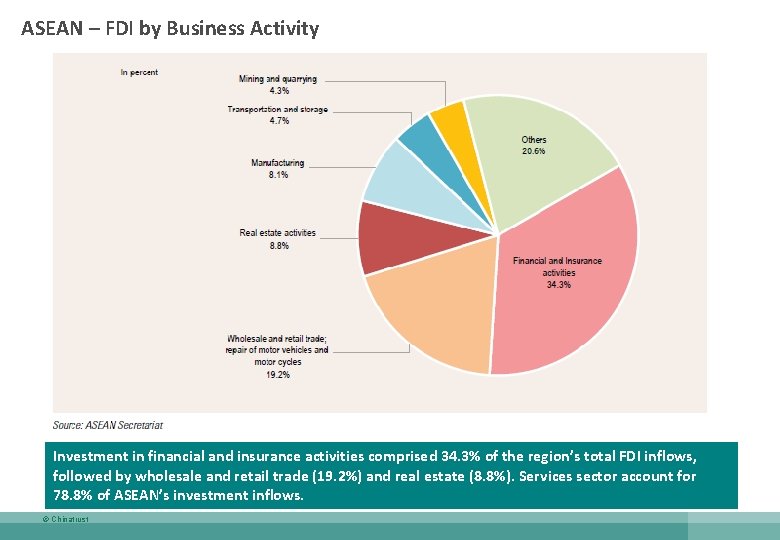
ASEAN – FDI by Business Activity Investment in financial and insurance activities comprised 34. 3% of the region’s total FDI inflows, followed by wholesale and retail trade (19. 2%) and real estate (8. 8%). Services sector account for 78. 8% of ASEAN’s investment inflows. © Chinatrust
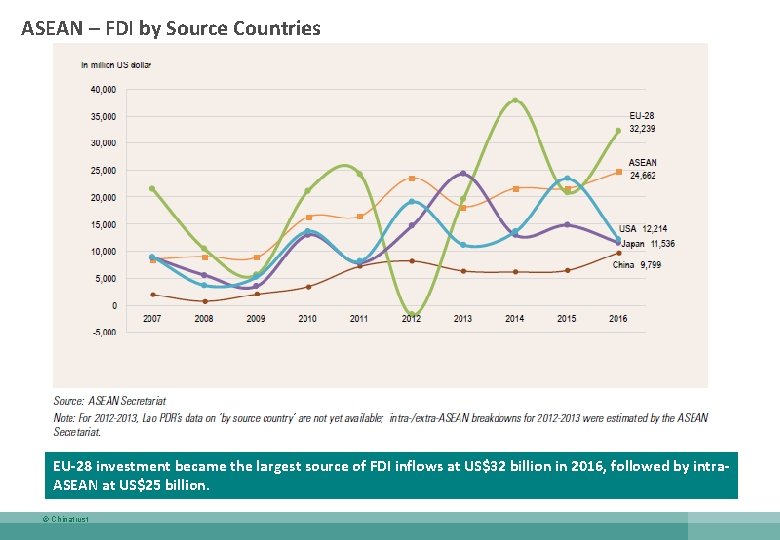
ASEAN – FDI by Source Countries EU-28 investment became the largest source of FDI inflows at US$32 billion in 2016, followed by intra. ASEAN at US$25 billion. © Chinatrust
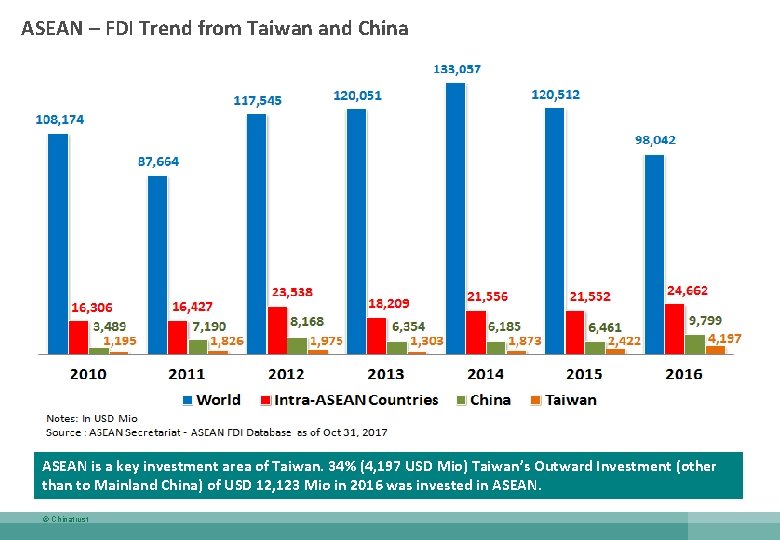
ASEAN – FDI Trend from Taiwan and China ASEAN is a key investment area of Taiwan. 34% (4, 197 USD Mio) Taiwan’s Outward Investment (other than to Mainland China) of USD 12, 123 Mio in 2016 was invested in ASEAN. © Chinatrust
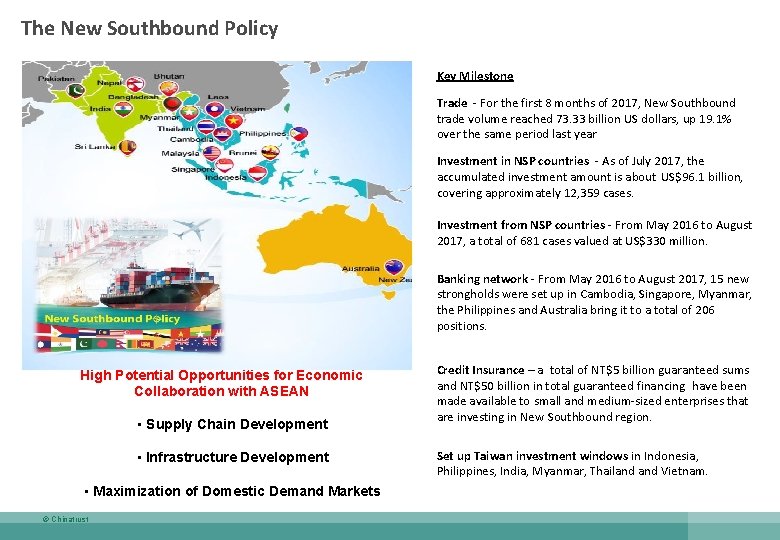
The New Southbound Policy Key Milestone Trade - For the first 8 months of 2017, New Southbound trade volume reached 73. 33 billion US dollars, up 19. 1% over the same period last year Investment in NSP countries - As of July 2017, the accumulated investment amount is about US$96. 1 billion, covering approximately 12, 359 cases. Investment from NSP countries - From May 2016 to August 2017, a total of 681 cases valued at US$330 million. Banking network - From May 2016 to August 2017, 15 new strongholds were set up in Cambodia, Singapore, Myanmar, the Philippines and Australia bring it to a total of 206 positions. High Potential Opportunities for Economic Collaboration with ASEAN • Supply Chain Development • Infrastructure Development • Maximization of Domestic Demand Markets © Chinatrust Credit Insurance – a total of NT$5 billion guaranteed sums and NT$50 billion in total guaranteed financing have been made available to small and medium-sized enterprises that are investing in New Southbound region. Set up Taiwan investment windows in Indonesia, Philippines, India, Myanmar, Thailand Vietnam.
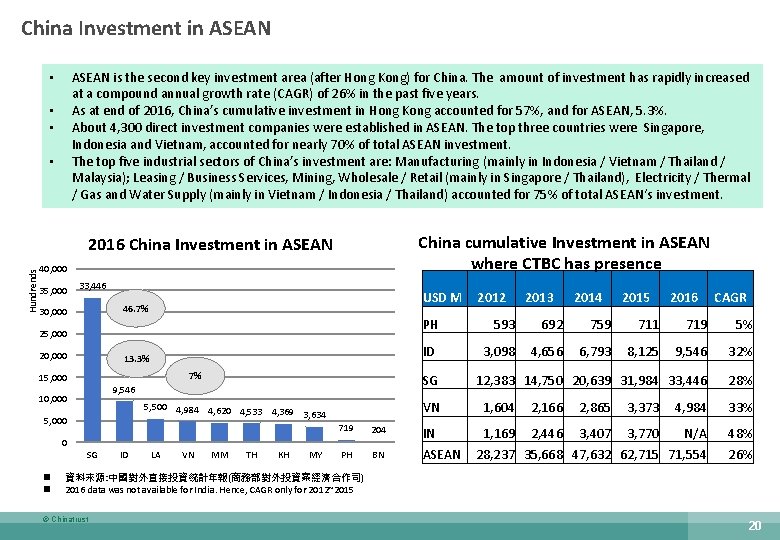
China Investment in ASEAN is the second key investment area (after Hong Kong) for China. The amount of investment has rapidly increased at a compound annual growth rate (CAGR) of 26% in the past five years. As at end of 2016, China’s cumulative investment in Hong Kong accounted for 57%, and for ASEAN, 5. 3%. About 4, 300 direct investment companies were established in ASEAN. The top three countries were Singapore, Indonesia and Vietnam, accounted for nearly 70% of total ASEAN investment. The top five industrial sectors of China’s investment are: Manufacturing (mainly in Indonesia / Vietnam / Thailand / Malaysia); Leasing / Business Services, Mining, Wholesale / Retail (mainly in Singapore / Thailand), Electricity / Thermal / Gas and Water Supply (mainly in Vietnam / Indonesia / Thailand) accounted for 75% of total ASEAN‘s investment. • • China cumulative Investment in ASEAN where CTBC has presence Hundrends 2016 China Investment in ASEAN 40, 000 35, 000 33, 446 USD M 46. 7% 30, 000 25, 000 20, 000 13. 3% 7% 15, 000 10, 000 5, 500 4, 984 4, 620 4, 533 4, 369 3, 634 5, 000 SG n n ID LA VN MM TH KH MY 2014 2015 2016 CAGR 593 692 759 711 719 5% ID 3, 098 4, 656 6, 793 8, 125 9, 546 32% 12, 383 14, 750 20, 639 31, 984 33, 446 28% VN 1, 604 2, 166 2, 865 3, 373 4, 984 33% 1, 169 2, 446 3, 407 3, 770 N/A 48% 28, 237 35, 668 47, 632 62, 715 71, 554 26% 719 204 IN PH BN ASEAN 0 2013 PH SG 9, 546 2012 資料來源: 中國對外直接投資統計年報(商務部對外投資案經濟合作司) 2016 data was not available for India. Hence, CAGR only for 2012~2015 © Chinatrust 20
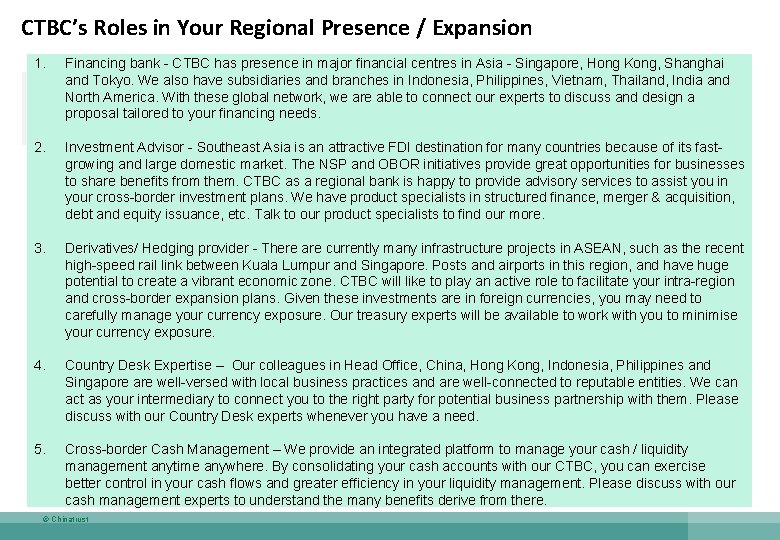
CTBC’s Roles in Your Regional Presence / Expansion 1. Financing bank - CTBC has presence in major financial centres in Asia - Singapore, Hong Kong, Shanghai and Tokyo. We also have subsidiaries and branches in Indonesia, Philippines, Vietnam, Thailand, India and North America. With these global network, we are able to connect our experts to discuss and design a proposal tailored to your financing needs. 2. Investment Advisor - Southeast Asia is an attractive FDI destination for many countries because of its fastgrowing and large domestic market. The NSP and OBOR initiatives provide great opportunities for businesses to share benefits from them. CTBC as a regional bank is happy to provide advisory services to assist you in your cross-border investment plans. We have product specialists in structured finance, merger & acquisition, debt and equity issuance, etc. Talk to our product specialists to find our more. 3. Derivatives/ Hedging provider - There are currently many infrastructure projects in ASEAN, such as the recent high-speed rail link between Kuala Lumpur and Singapore. Posts and airports in this region, and have huge potential to create a vibrant economic zone. CTBC will like to play an active role to facilitate your intra-region and cross-border expansion plans. Given these investments are in foreign currencies, you may need to carefully manage your currency exposure. Our treasury experts will be available to work with you to minimise your currency exposure. 4. Country Desk Expertise – Our colleagues in Head Office, China, Hong Kong, Indonesia, Philippines and Singapore are well-versed with local business practices and are well-connected to reputable entities. We can act as your intermediary to connect you to the right party for potential business partnership with them. Please discuss with our Country Desk experts whenever you have a need. 5. Cross-border Cash Management – We provide an integrated platform to manage your cash / liquidity management anytime anywhere. By consolidating your cash accounts with our CTBC, you can exercise better control in your cash flows and greater efficiency in your liquidity management. Please discuss with our cash management experts to understand the many benefits derive from there. © Chinatrust
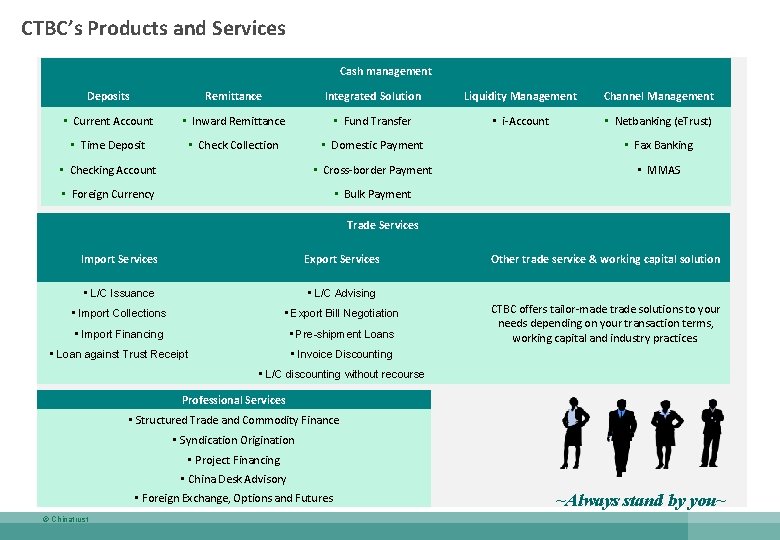
CTBC’s Products and Services Cash management Deposits Remittance Integrated Solution Liquidity Management Channel Management • Current Account • Inward Remittance • Fund Transfer • i-Account • Netbanking (e. Trust) • Time Deposit • Check Collection • Domestic Payment • Fax Banking • Checking Account • Cross-border Payment • MMAS • Foreign Currency • Bulk Payment Trade Services Import Services Export Services • L/C Issuance • L/C Advising • Import Collections • Export Bill Negotiation • Import Financing • Pre-shipment Loans • Loan against Trust Receipt • Invoice Discounting Other trade service & working capital solution CTBC offers tailor-made trade solutions to your needs depending on your transaction terms, working capital and industry practices. • L/C discounting without recourse Professional Services • Structured Trade and Commodity Finance • Syndication Origination • Project Financing • China Desk Advisory • Foreign Exchange, Options and Futures © Chinatrust ~Always stand by you~
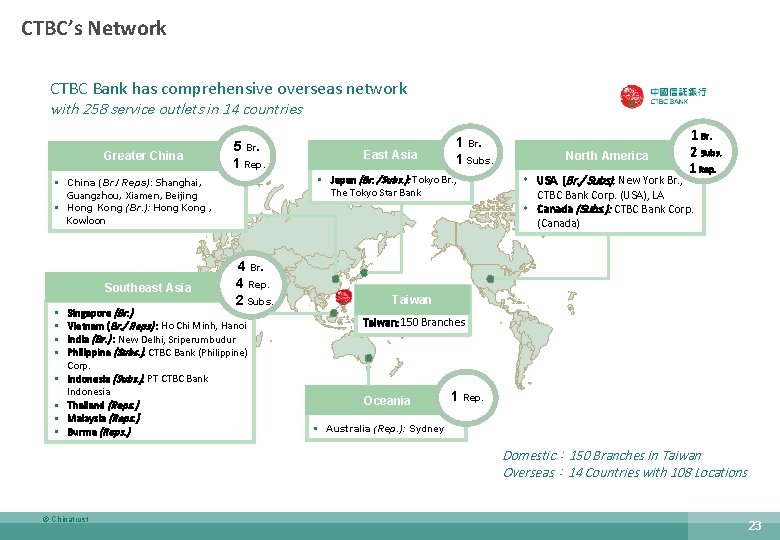
CTBC’s Network CTBC Bank has comprehensive overseas network with 258 service outlets in 14 countries Greater China 5 Br. 1 Rep. Japan (Br. /Subs. ): Tokyo Br. , The Tokyo Star Bank China (Br. / Reps): Shanghai, Guangzhou, Xiamen, Beijing Hong Kong (Br. ): Hong Kong , Kowloon Southeast Asia East Asia 1 Br. 1 Subs. 4 Br. 4 Rep. 2 Subs. Singapore (Br. ) Vietnam (Br. / Reps) : Ho Chi Minh, Hanoi India (Br. ) : New Delhi, Sriperumbudur Philippine (Subs. ): CTBC Bank (Philippine) Corp. Indonesia (Subs. ): PT CTBC Bank Indonesia Thailand (Reps. ) Malaysia (Reps. ) Burma (Reps. ) North America 1 Br. 2 Subs. 1 Rep. USA (Br. / Subs): New York Br. , CTBC Bank Corp. (USA), LA Canada (Subs. ): CTBC Bank Corp. (Canada) Taiwan: 150 Branches Oceania 1 Rep. Australia (Rep. ): Sydney Domestic: 150 Branches in Taiwan Overseas: 14 Countries with 108 Locations © Chinatrust 23
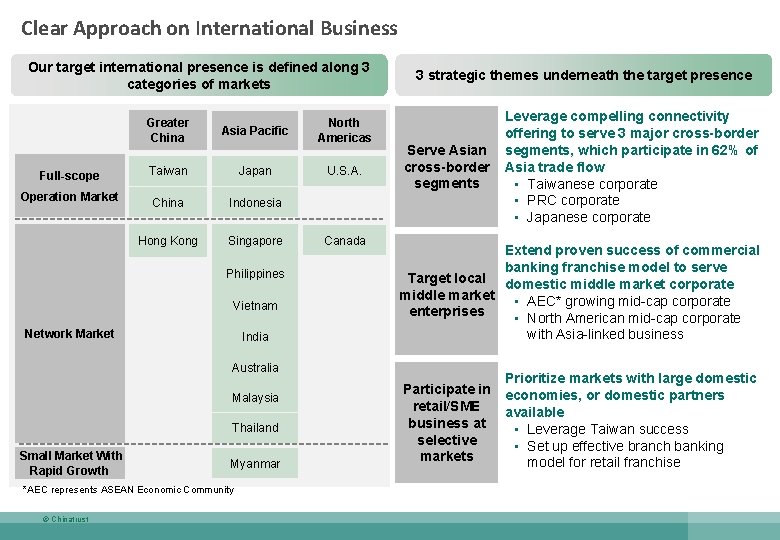
Clear Approach on International Business Our target international presence is defined along 3 categories of markets Greater China Asia Pacific Full-scope Taiwan Japan Operation Market China Indonesia Hong Kong Singapore Philippines Vietnam Network Market India North Americas U. S. A. Canada 3 strategic themes underneath the target presence Serve Asian cross-border segments Extend proven success of commercial banking franchise model to serve Target local domestic middle market corporate middle market • AEC* growing mid-cap corporate enterprises • North American mid-cap corporate with Asia-linked business Australia Malaysia Thailand Small Market With Rapid Growth Myanmar *AEC represents ASEAN Economic Community © Chinatrust Leverage compelling connectivity offering to serve 3 major cross-border segments, which participate in 62% of Asia trade flow • Taiwanese corporate • PRC corporate • Japanese corporate Participate in retail/SME business at selective markets Prioritize markets with large domestic economies, or domestic partners available • Leverage Taiwan success • Set up effective branch banking model for retail franchise

RECIPIENT OF 176 MAJOR AWARDS IN 2017 Resource: 2016 CTBC CSR report © Chinatrust 25
We are your trustworthy partner. Let's move for a better world. Your best Partner, CTBC Bank © Chinatrust

Thank You
ASEAN Basic Indicators © Chinatrust
ASEAN Member © Chinatrust
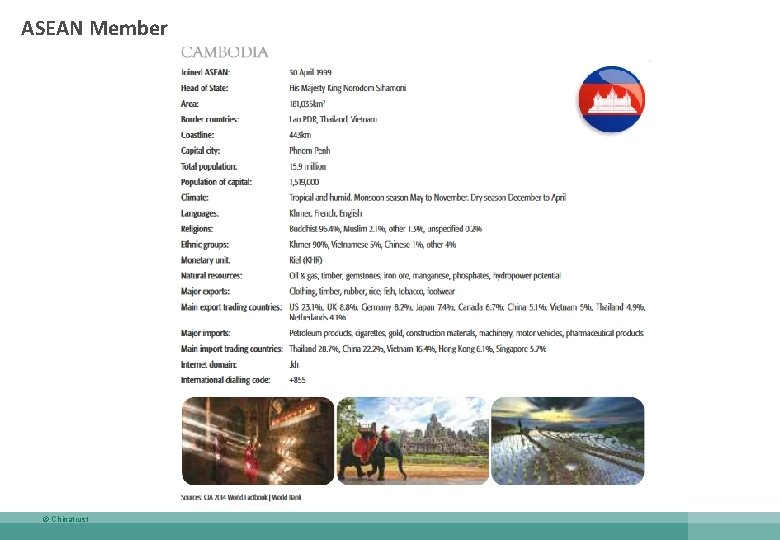
ASEAN Member © Chinatrust
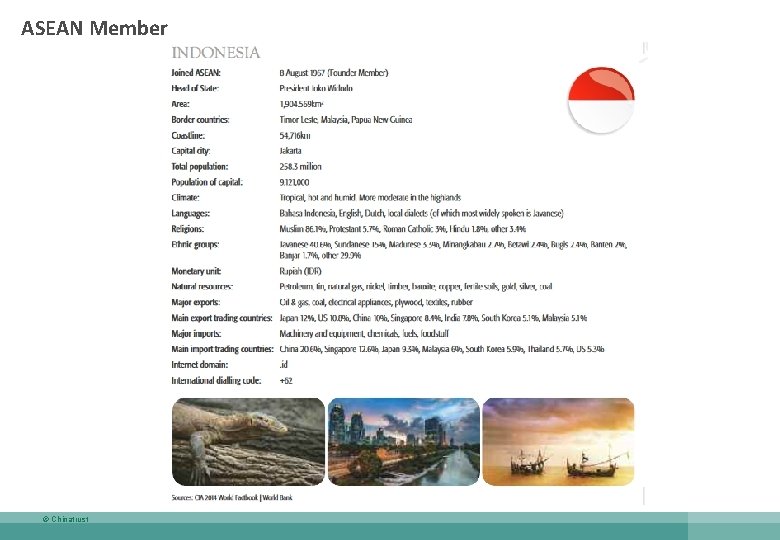
ASEAN Member © Chinatrust
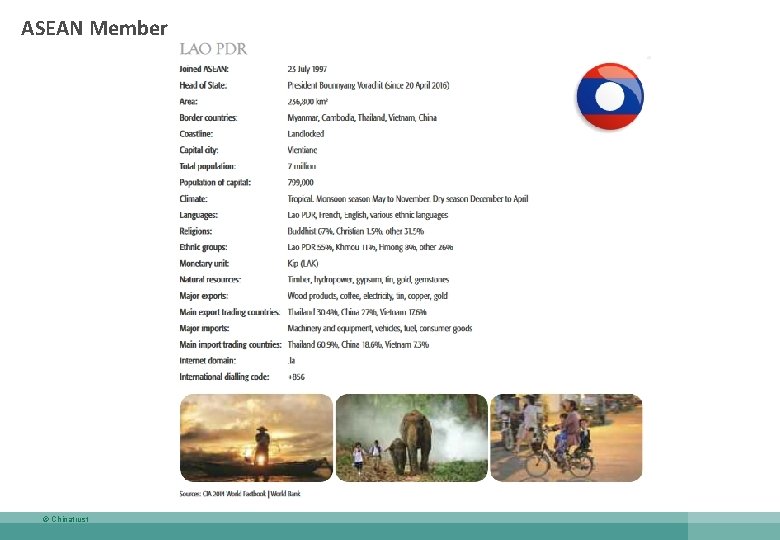
ASEAN Member © Chinatrust
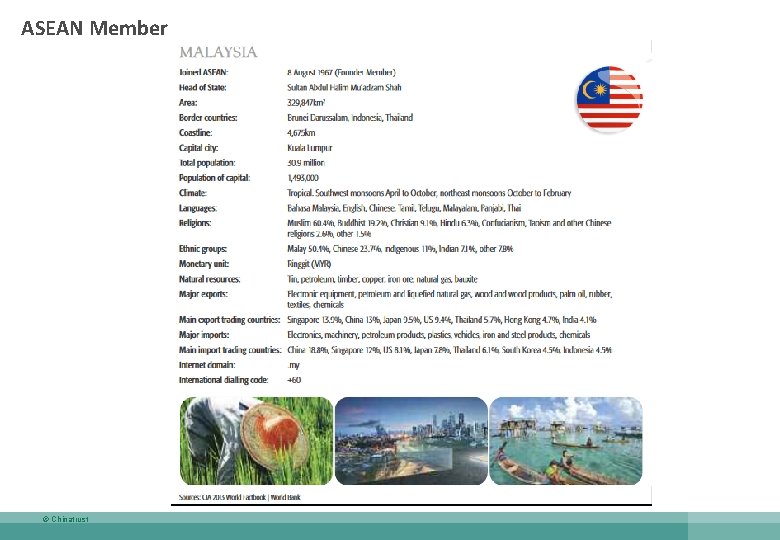
ASEAN Member © Chinatrust
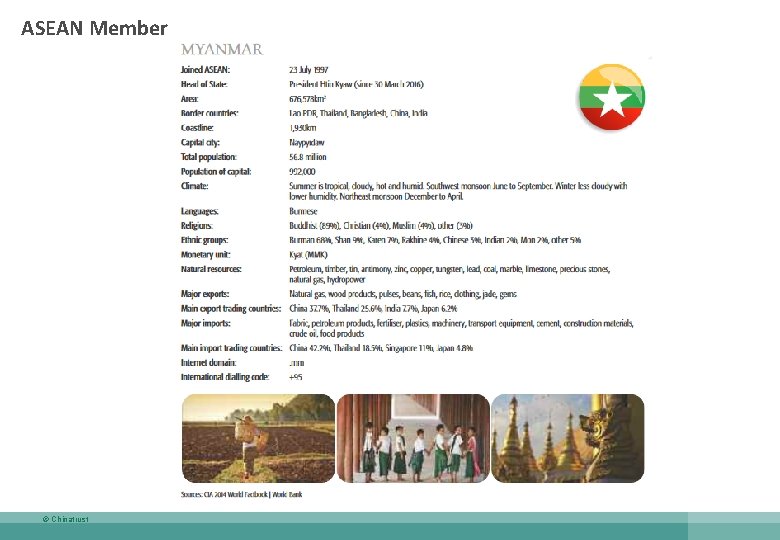
ASEAN Member © Chinatrust
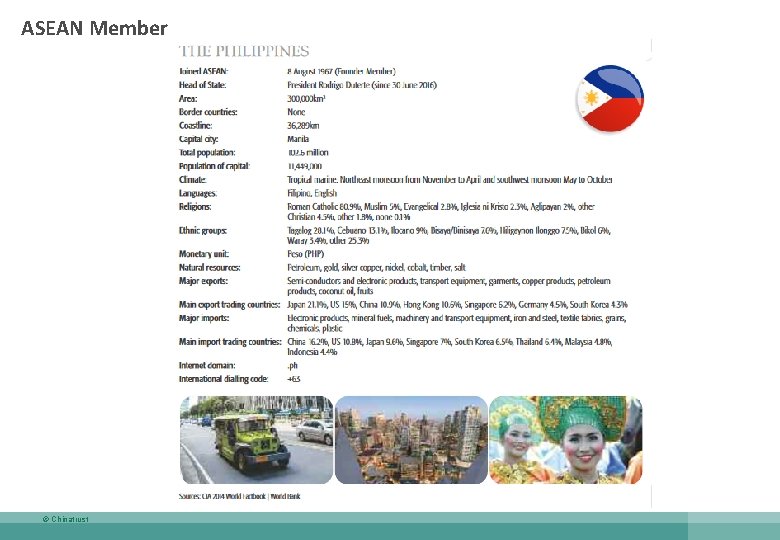
ASEAN Member © Chinatrust
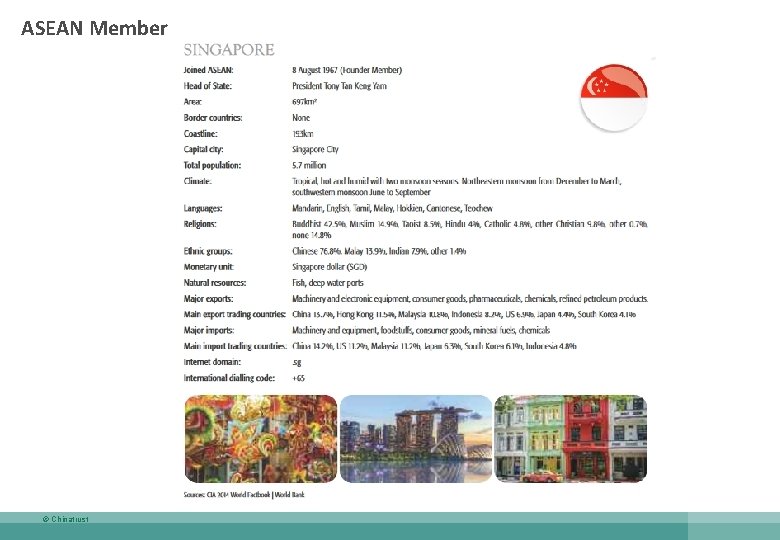
ASEAN Member © Chinatrust
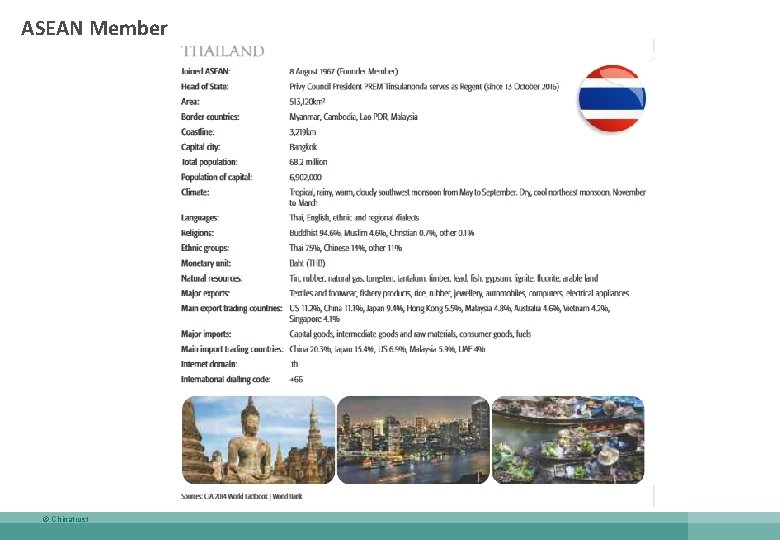
ASEAN Member © Chinatrust
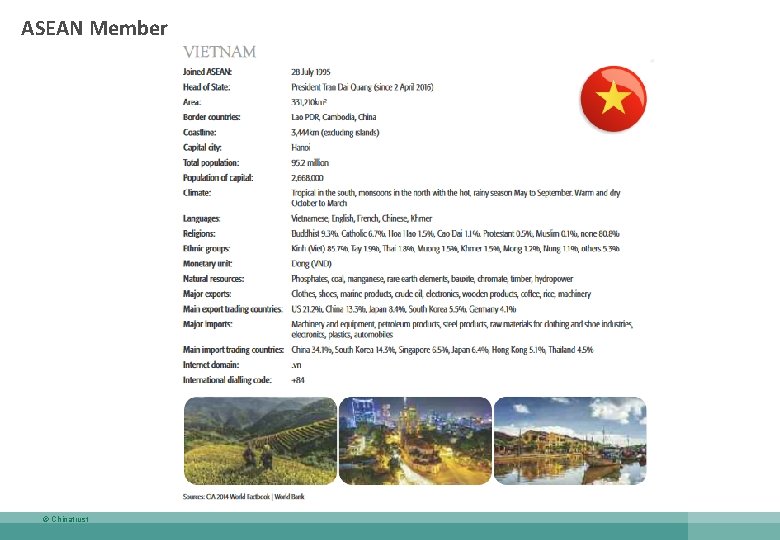
ASEAN Member © Chinatrust
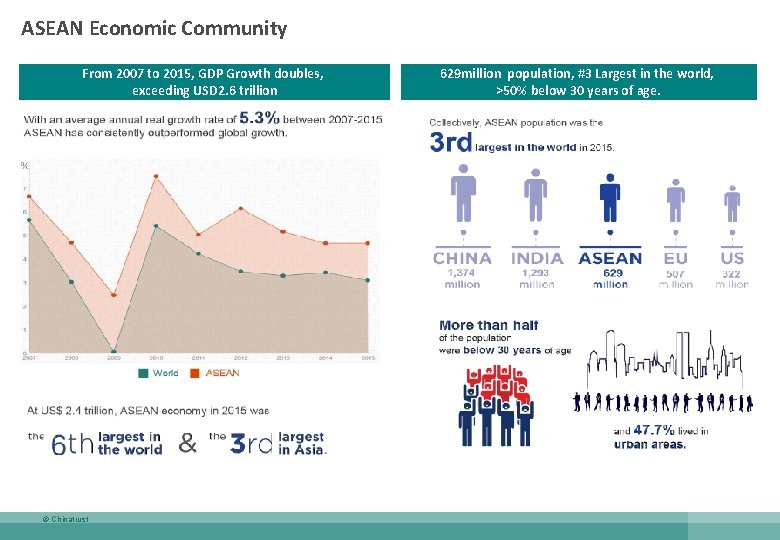
ASEAN Economic Community From 2007 to 2015, GDP Growth doubles, exceeding USD 2. 6 trillion © Chinatrust 629 million population, #3 Largest in the world, >50% below 30 years of age.
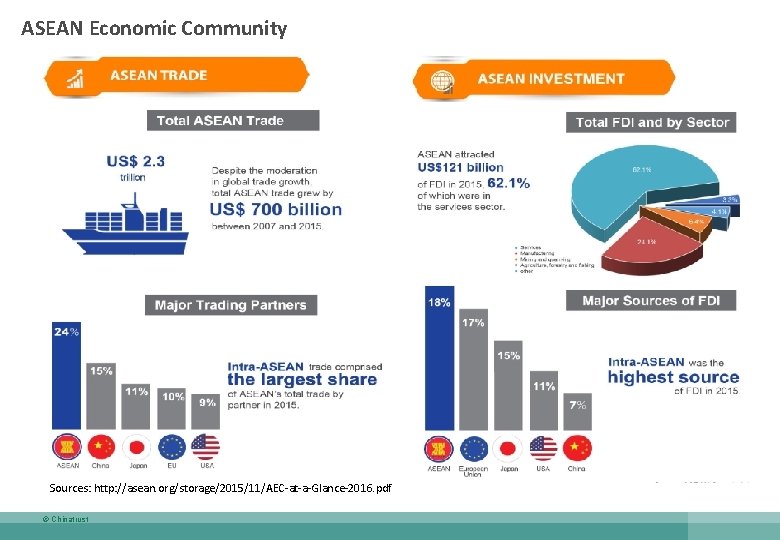
ASEAN Economic Community Sources: http: //asean. org/storage/2015/11/AEC-at-a-Glance-2016. pdf © Chinatrust
- Slides: 41