Refractory Wear During Gasification Larry Baxter 1 Shrinivas

Refractory Wear During Gasification Larry Baxter 1, Shrinivas Lokare 1, Humberto Garcia 2, Bing Liu 1 1 Brigham Young University Provo, UT 2 Idaho National Laboratory* Idaho Falls, ID Clearwater Coal Conference Clearwater, FL June 2, 2009

Gasification in the Literature

d St G ate er s m U ni a te J ny d a Ki pa ng n do C N a m et na he d rla a n R ds us si a In Fr dia an Fi ce nl an C d Be hina lg iu Sp m ai n I Sw tal ed y So Po en ut la h nd Af Po ric rtu a Au g st al ra lia ni te U Research by Country 3500 3000 2500 2000 Through 1995 Since 1995 1500 1000 500 0

Levelized Cost of Power 12 Fuel VOM FOM Cap TS&M LCOE ¢/k. Wh 10 8 6 4 2 0 SC USC IGCC Amine ASU SC USC ITM SC IGCC

GE Energy Radiant Coal Slurry 63 wt. % 95% O 2 Syngas 410°F, 800 Psia Composition (Mole%): H 2 26% CO 27% CO 2 12% H 2 O 34% Other 1% H 2 O/CO = 1. 3 Slag/Fines Design: Pressurized, single-stage, downward firing, entrained flow, slurry feed, oxygen blown, slagging, radiant and quench cooling To Acid Gas Removal or To Shift
: H 2 26% CO 37% CO 2 14%")
Conoco. Phillips E-Gas™ Syngas Composition (Mole%): H 2 26% CO 37% CO 2 14% H 2 O 15% CH 4 4% Other 4% H 2 O/CO = 0. 4 Stage 2 Coal Slurry 63 wt. % Syngas 1, 700°F, 614 psia To Fire-tube boiler To Acid Gas Removal or To Shift (0. 22) (0. 78) Char Slag Quench 95 % O 2 Stage 1 2, 500 o. F 614 Psia Slag/Water Slurry Design: Pressurized, two-stage, upward firing, entrained flow, slurry feed, oxygen blown, slagging, fire-tube boiling syngas cooling, syngas recycle

Shell Gasification HP Steam Convective Cooler Soot Quench & Scrubber Design: Pressurized, single-stage, downward firing, slagging, entrained flow, dry feed, oxygen blown, convective cooler Gasifier 2, 700 o. F 615 psia Syngas Quench 2 Syngas 350°F, 600 Psia Steam 95% O 2 HP Steam Dry Coal 650 o. F Composition (Mole%): H 2 29% CO 57% CO 2 2% H 2 O 4% Other 8% H 2 O/CO = 0. 1 To Acid Gas Removal or To Shift Source: “The Shell Gasification Process”, Uhde, Thyssen. Krupp Technologies Slag

Transient Model Formulation
![Simulation – Gas Phase 1400 Temperature / [°C] 1300 1200 1100 1000 900 800](http://slidetodoc.com/presentation_image_h/0009d3f306d51b544470eeff45a6e242/image-9.jpg "Simulation – Gas Phase 1400 Temperature / [°C] 1300 1200 1100 1000 900 800")
Simulation – Gas Phase 1400 Temperature / [°C] 1300 1200 1100 1000 900 800 700 600 0 0. 5 1 1. 5 Axial Distance / [m] 2 2. 5 3
 CO 2(g) H 2 O(g) H 2")
Simulation – Gas Phase 0. 6 CO(g) CO 2(g) H 2 O(g) H 2 S(g) O 2(g) SO 3(g) Mole Fraction 0. 5 0. 4 0. 3 0. 2 0. 1 0 0 0. 5 1 1. 5 Axial Distance / [m] 2 2. 5 3

Efficiency Calculation

Impaction Efficiency Improvement Impaction Efficiency 100% 80% 60% 40% Potential Flow 20% Viscous Flow 0% 0. 1 1 10 1000 Stokes Number Potential Flow Viscous Flow a 0. 1238 0. 0868 b 1. 34 1. 9495 c -0. 034 -0. 457877 d 0. 0289 -0. 047

Corrosion potential Chlorides condensation is a major step in corrosion initiation K Si Cl S Ca Fe

Complex Inorganic Chemistry

Complex Inorganic Chemistry

Al 2 O 3 -Ca. O-Si. O 2 Chemistry Al 2 O 3/Si. O 2 = 0. 34

Refractory-Slag Model

Slag Importance

Refractory Wear with Time
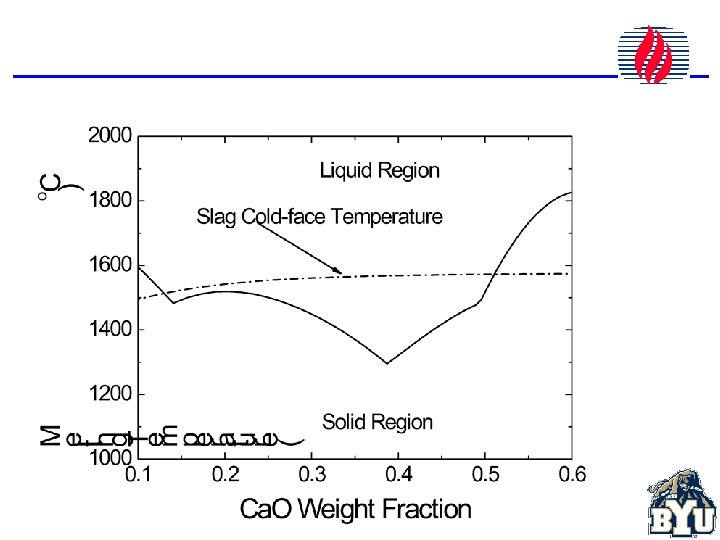

Sensitivity to Ca. O content

Refractory Chemical Corrosion

Spalling Mechanisms

Overall Refractory Wear Chemical dissolution rates depend in complex ways on diffusivities, viscosities, chemical reactions, and temperature. Spalling mechanisms and rates are not well understood, with quantitative models being mostly empirical. Net dissolution rates disproportionately depend on minor slag and refractory components, involving complex inorganic chemistry.

Spalling Mechanisms Corrosion Spalling
 Point 1 2")
Spalling Mechanisms 1 6 4 5 2 3 Chemistry (weight %) Point 1 2 3 4 5 6 - Al 6. 9 27. 3 1. 7 2. 8 7. 5 5. 7 - Si 23. 9 0. 2 0. 1 40. 2 3. 8 - Fe 20. 8 31. 7 23. 6 0. 2 1. 5 0. 5 - Ca 1. 5 - - - 0. 5 - - Cr 0. 1 1. 5 42. 7 62. 1 1. 5 53. 0 Crystalline Phases hercynite, fayalite, enstatite, Iron sulfide, iron cordierite, iron-alumina iron-chrome Chromia/alumina
 Bulk Chemistry (wt pct) X-Ray Crystalline Phases")
Refractory/Slag Profile Distance from Hot Face (mm) Bulk Chemistry (wt pct) X-Ray Crystalline Phases Cr 2 O 3 Al 2 O 3 Si. O 2 Ca. O Fe H. F. to 2. 3 80. 0 10. 8 5. 4 0. 3 1. 6 P= Cr 2 O 3 Tr=M*Cr 2 O 4 6. 9 84. 2 10. 2 3. 9 0. 3 0. 4 P= Cr 2 O 3 Tr=M*Cr 2 O 4 11. 4 83. 9 10. 7 3. 2 0. 4 P= Cr 2 O 3 Tr=M*Cr 2 O 4 34. 3 83. 5 10. 4 2. 8 0. 6 0. 4 P= Cr 2 O 3 43. 3 83. 9 9. 3 2. 3 0. 5 0. 2 P= Cr 2 O 3 52. 7 85. 7 10. 5 0. 9 0. 2 P= Cr 2 O 3 57. 2 86. 1 10. 5 0. 2 0. 0 0. 2 P= Cr 2 O 3 127 87. 4 9. 4 0. 2 P= Cr 2 O 3

Conclusions • Chemical dissolution and spalling account for most refractory wear. • Both mechanisms depend on temperature, slag/refractory composition, and slag flow rates, approximately in that order. • Temperature dependence arises from both transport and solubility issues. • Both immersion and spinning cup analyses provide good corrosion information, but neither simulates practical systems. • Temperature, not peak deposition rates, determine maximum corrosion location.

Acknowledgements • Ph. D and post-doc students Shrinivas Lokare, Bing Liu developed many of the submodels. • Partial financial support from U. S. Department of Energy contract DE-AC 07 -05 ID 14517 and from corporate sponsors.
- Slides: 29