Reflections on Inequality Capital and Carbon in the

Reflections on Inequality, Capital and Carbon in the 21 st century Thomas Piketty Paris School of Economics Paris, November 10 2015

• This presentation is partly based upon my book Capital in the 21 st century (HUP, 2014) • In this book, I study the global dynamics of income and wealth distribution since 18 c in 20+ countries. I use historical data collected over the past 15 years with Atkinson, Saez, Postel-Vinay, Rosenthal, Alvaredo, Zucman, and 30+ others. Aim is to put distribution back at the center of political economy. I attempt to develop a multidimensional approach to capital ownership and property relations, and to study beliefs systems about inequality • Today I will present a number of selected historical evolutions & attempt to draw lessons for the future • All series available at http: //piketty. pse. ens. fr/capital 21 c & the World Top Incomes Database

This presentation: four points • 1. The long-run dynamics of income inequality. The end of the Kuznets curve, the end of universal laws. Institutions and policies matter: education, labor, tax, etc. • 2. The return of a patrimonial (or wealth-based) society. Wealth-income ratios seem to be returning to very high levels in rich countries. The metamorphosis of capital. • 3. The future of wealth concentration. With high r - g during 21 c (r = net-of-tax rate of return, g = growth rate), then wealth inequality might rise again. Need for more transparency. • 4. Inequality and carbon. Rising inequality and global warming need to be adressed together. Top global emitters must compensate poor countries for negative externality.

• 1. The long-run dynamics of income inequality. The end of the Kuznets curve, the end of universal laws. Institutions and policies matter: education, labor, tax, etc.

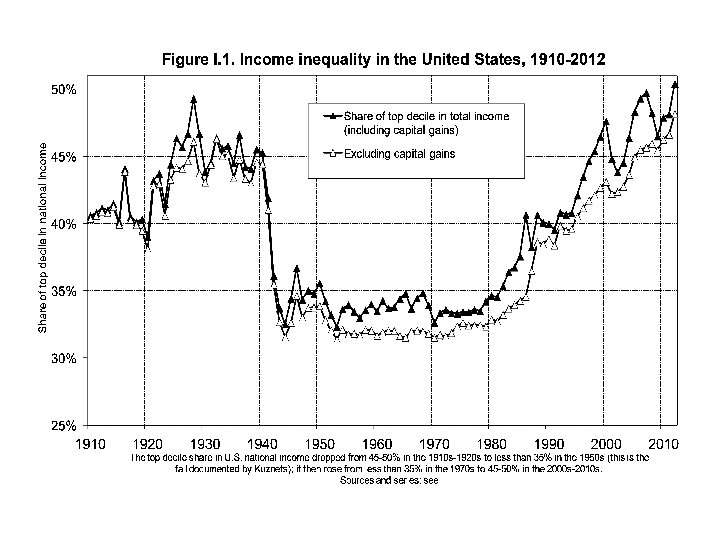
• Three facts about inequality in the long-run: income inequality, wealth-income ratios (Piketty-Saez, « Inequality in the long run » , Science 2014) • Fact n° 1: in 1900 -1910, income inequality was higher in Europe than in the United States; in 2000 -2010, it is a lot higher in the United States
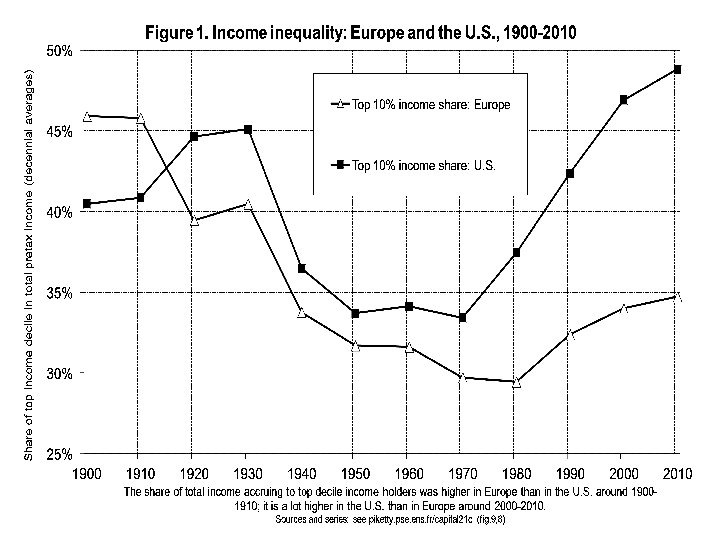


Top 10% Income Share: Europe, U. S. and Japan, 1900 -2010 50% U. S. Share of top decile in total income 45% Europe Japan 40% 35% 30% 25% 1900 1910 1920 1930 1940 1950 1960 1970 1980 1990 2000 2010 The top decile income share was higher in Europe than in the U. S. in 1900 -1910; it is a lot higher in the U. S. in 2000 -2010. Sources and series: see piketty. pse. ens. fr/capital 21 c.

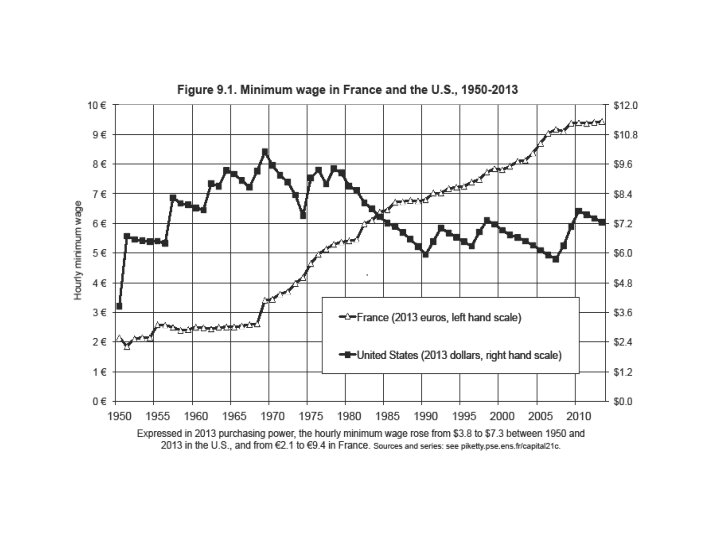
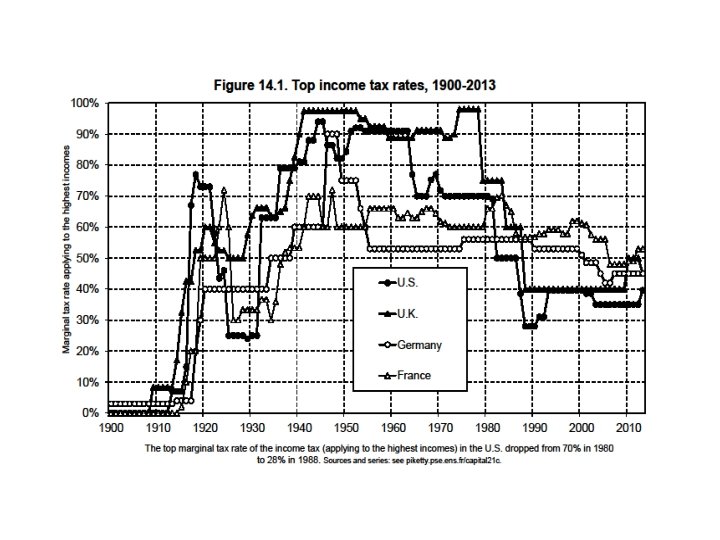
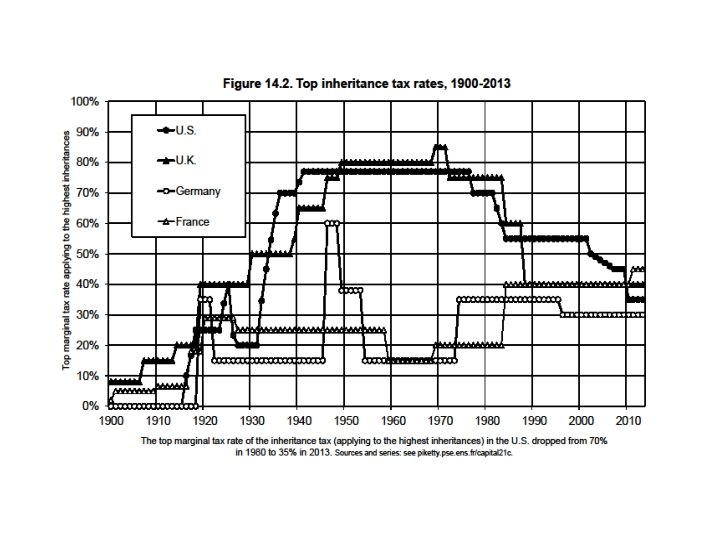
• The rise in US inequality in recent decades is mostly due to rising inequality of labor income • It is due to a mixture of reasons: changing supply and demand for skills; race between education and technology; globalization; more unequal to access to skills in the US (rising tuitions, insufficient public investment); unprecedented rise of top managerial compensation in the US (changing incentives, cuts in top income tax rates); falling minimum wage in the US institutions and policies matter
 society. Wealth-income ratios seem")
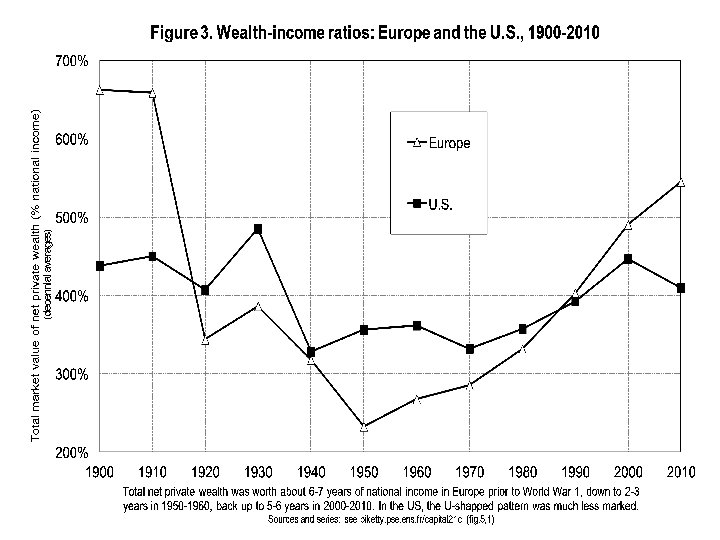
• 2. The return of a patrimonial (or wealth-based) society. Wealth-income ratios seem to be returning to very high levels in rich countries. Intuition: in a slow-growth society, wealth accumulated in the past can naturally become very important. In the very long run, this can be relevant for the entire world. Not bad in itself, but new challenges. The metamorphosis of capital call for new regulations of property relations. The key role of the legal and political system. Democratizing capital: worker codetermination, patent laws, etc.

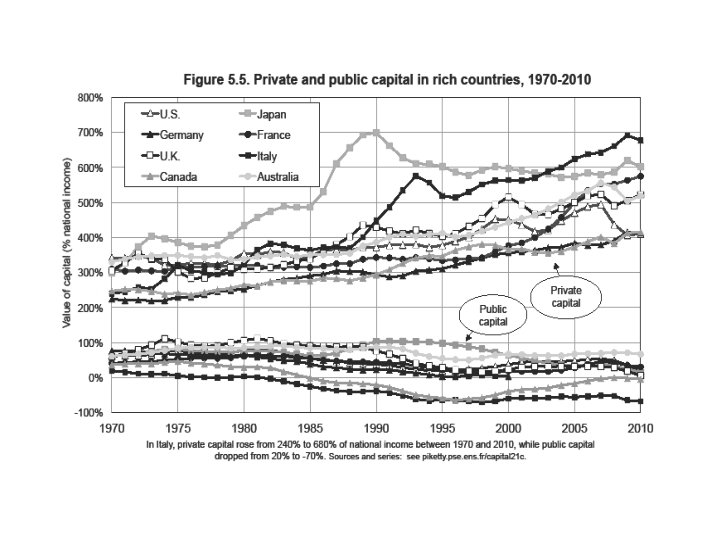
• Fact n° 2: wealth inequality is always a lot higher than income inequality; it is now higher in the US than in Europe • Fact n° 3: wealth inequality is less extreme today than a century ago in Europe, although the total capitalization of private wealth relative to national income has now recovered from the 1914 -1945 shocks
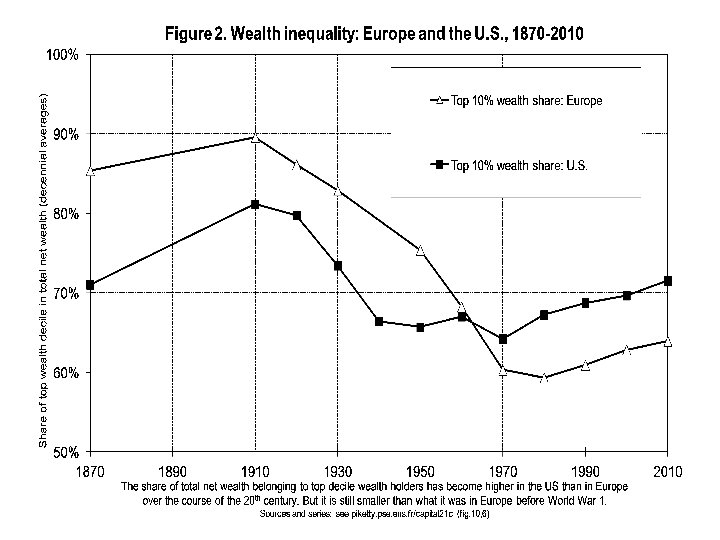
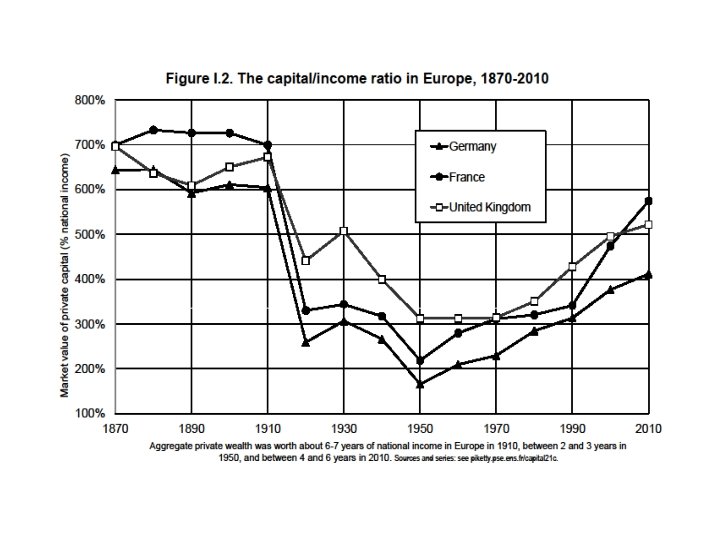

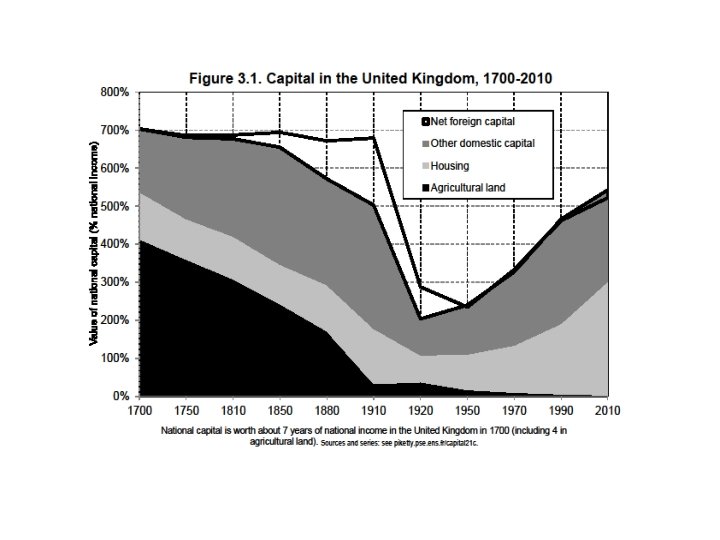
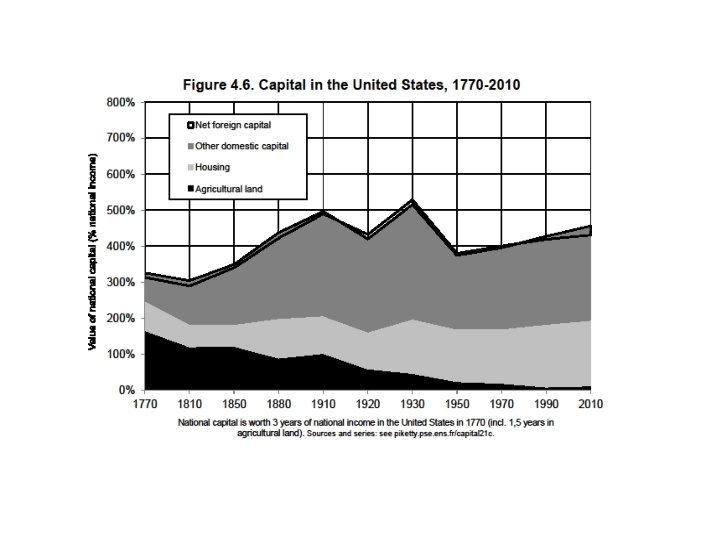
The metamorphosis of capital • There’s nothing bad with high wealth-income ratios (postwar reconstruction, growth slowdown), but this creates new policy challenges: financial regulation, real estate bubbles, return of inheritance A multidimensional approach to the history of capital and property relations: from land to business assets, foreign assets, real estate, public debt, immaterial capital, etc.

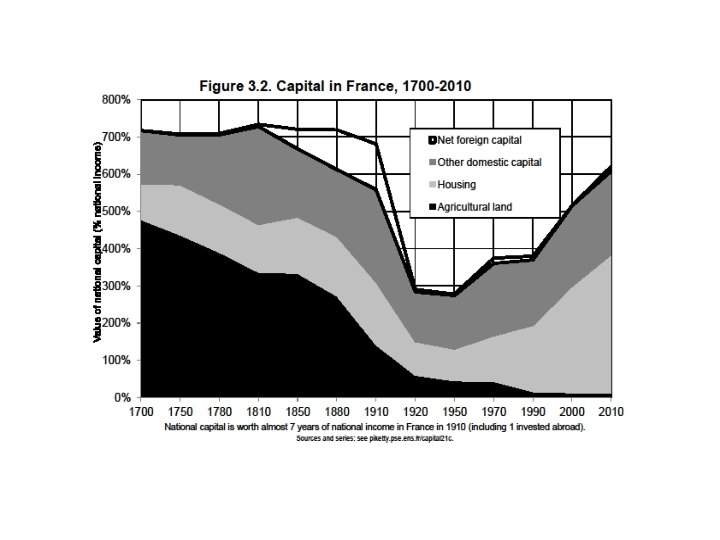
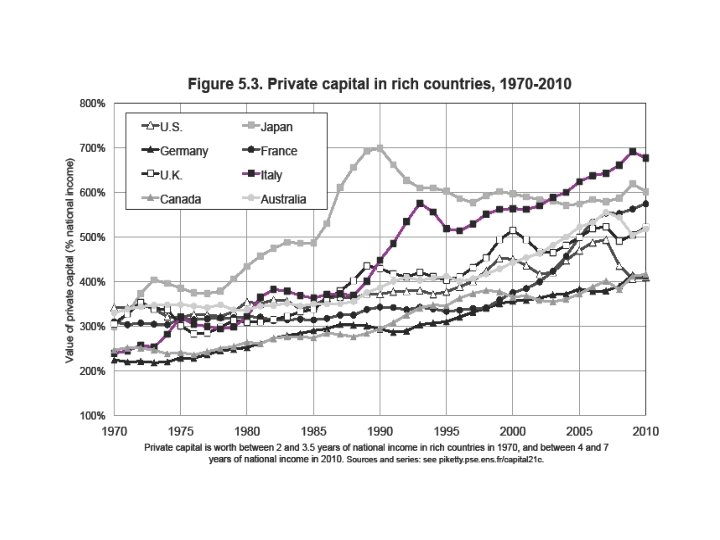

Figure S 5. 2. Private capital in rich countries: from the Japanese to the Spanish bubble 800% U. S. A Japan Germany France U. K. Italy Canada Australia Spain Value of private capital (% of national income) 700% 600% 500% 400% 300% 200% 1970 1975 1980 1985 1990 1995 2000 2005 Private capital almost reached 8 years of national income in Spain at the end of the 2000 s (ie. one more year than Japan in 1990). Sources and series: see piketty. pse. ens. fr/capital 21 c. 2010

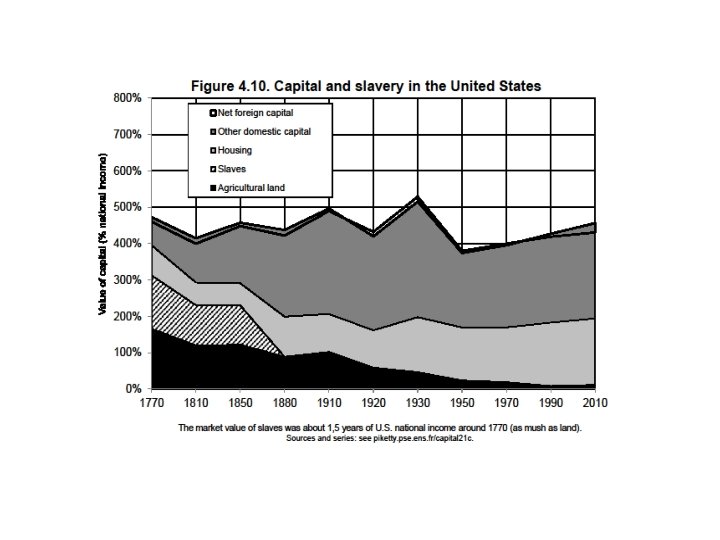
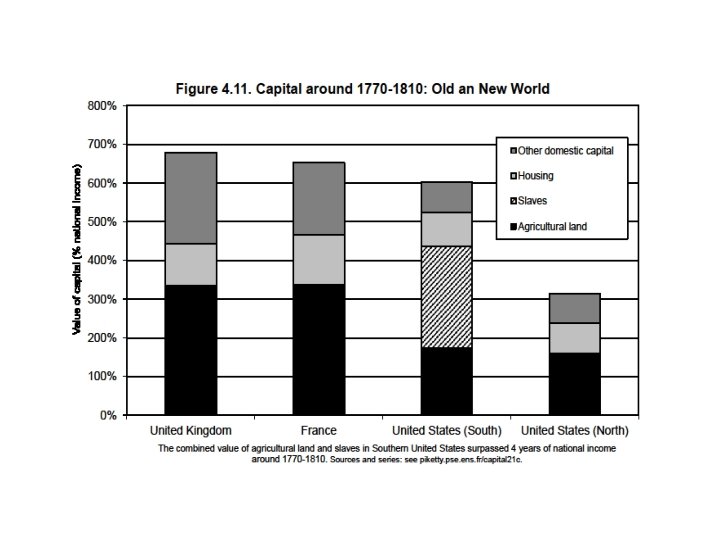
Capital & inequality in America • Inequality in America = a different structure as in Europe: more egalitarian in some ways, more inegalitarian in others • The New World in the 19 th century: the land of opportunity (capital accumulated in the past matters less than in Europe; perpetual pop. growth as a way to reduce the level of inherited wealth and wealth concentration)… and also the land of slavery: extreme form of property relation • Northern US were in many ways more egalitarian than Old Europe; but Southern US were more inegalitarian • We still have the same ambiguous relationship of America with inequality today: in some ways more merit-based; in other ways more violent ( « meritocratic extremism » )

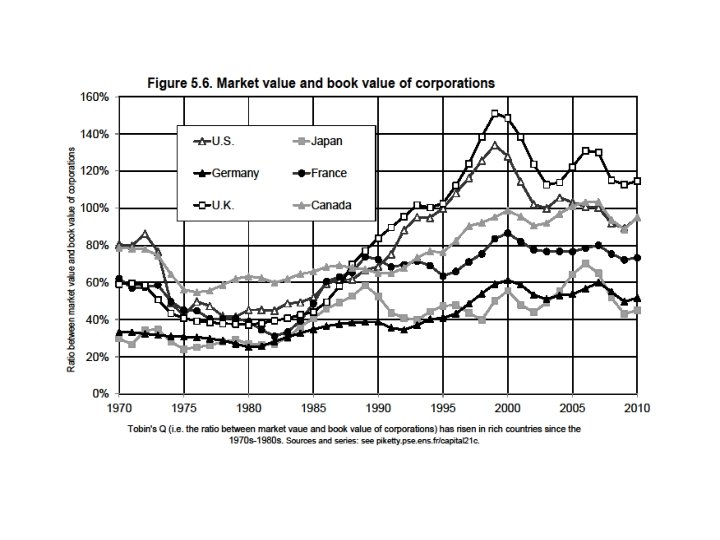
Capital & inequality in Germany • Lower market values of capital assets in Germany: lower real estate prices, and lower stock market cap of corporations • Stakeholder capitalism: shareholders have to share power with worker representatives, regional govt, etc. , so that the market value is much less than book value of corporation • This can be an efficient way to involve workers in firm strategy • 50% of board members are worker representatives in Germany; 30% in Sweden; 10% in France (since 2014) • This clearly illustrates that market and social values of capital can differ; property relations are socially, legally and historically determined

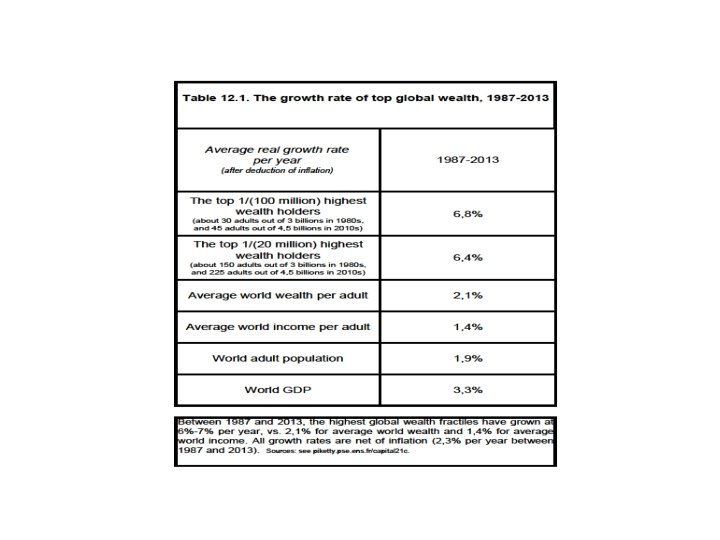
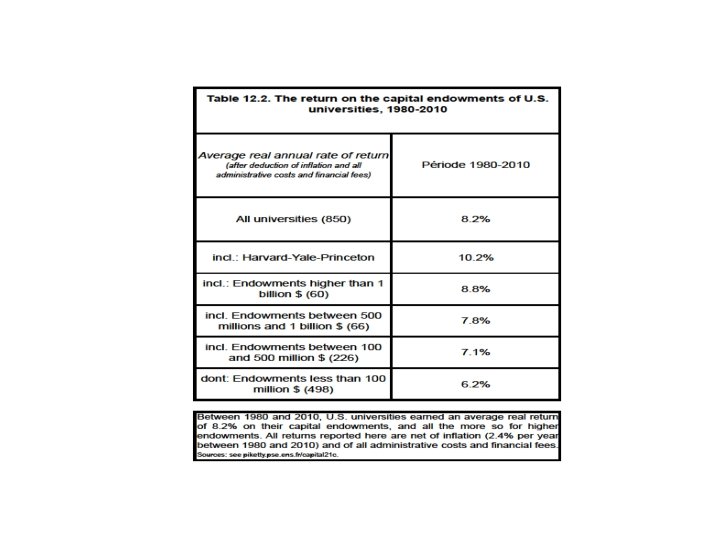
• 3. The future of wealth concentration. With high r - g during 21 c (r = net-of-tax rate of return, g = growth rate), then wealth inequality might reach or surpass 19 c oligarchic levels. Need for more transparency about wealth. Need for progressive taxation of net wealth.


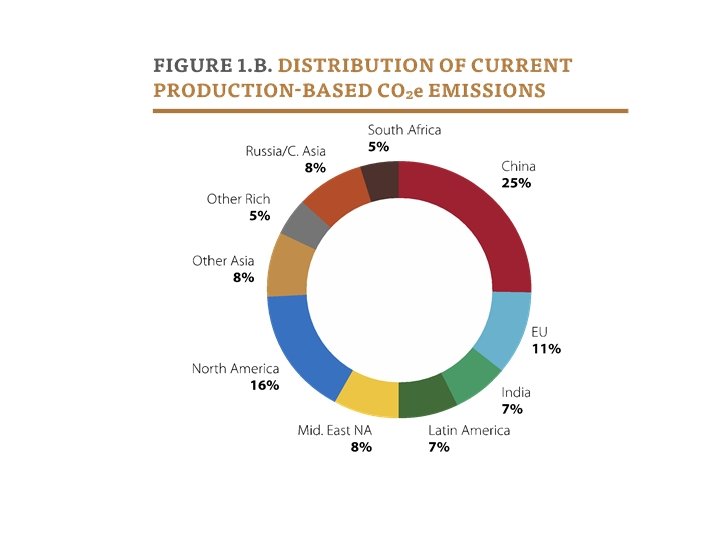
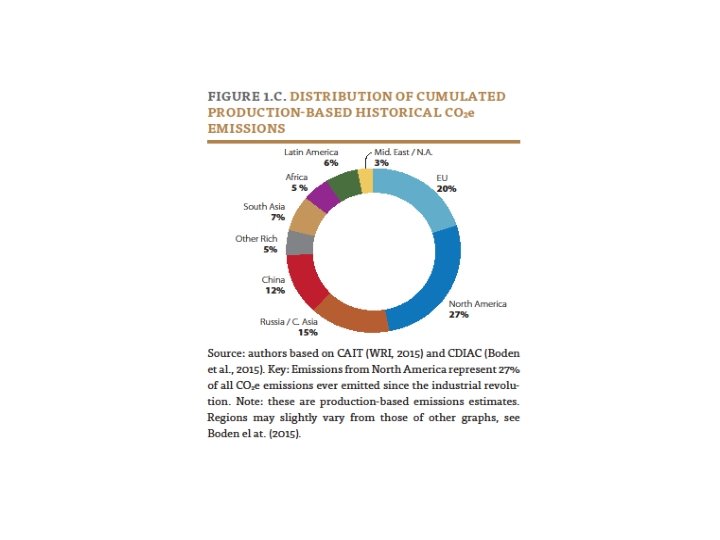
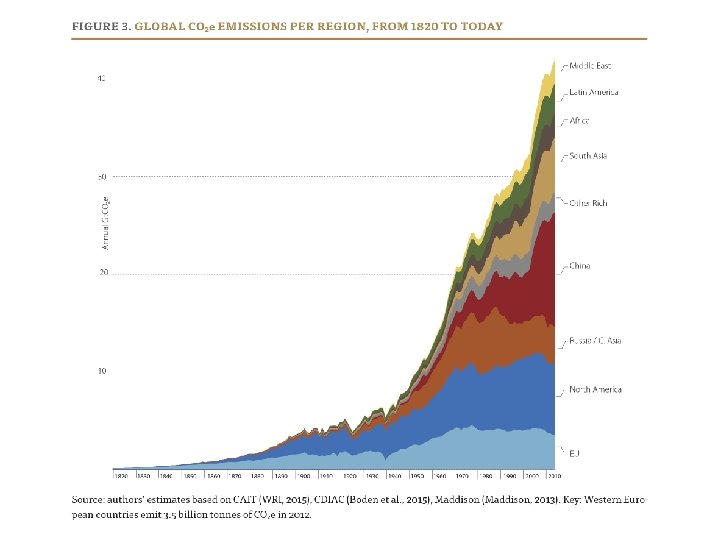
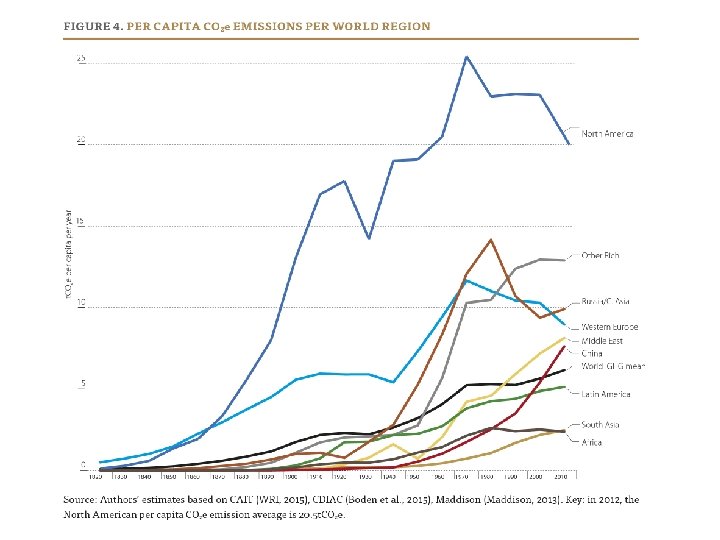
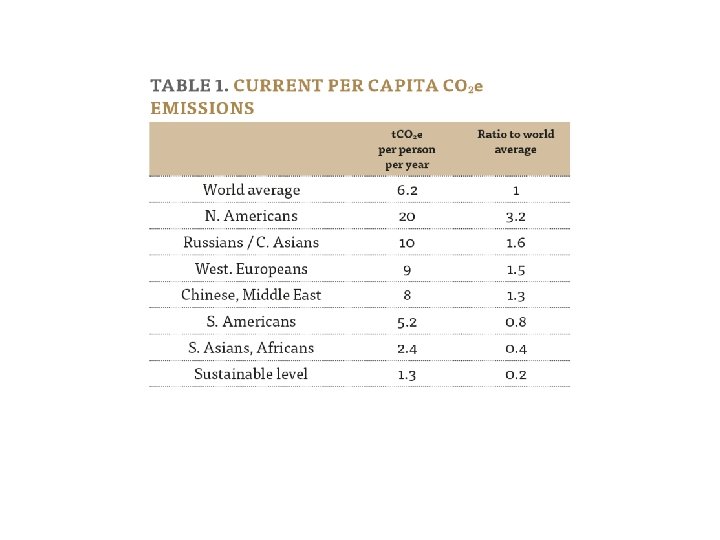
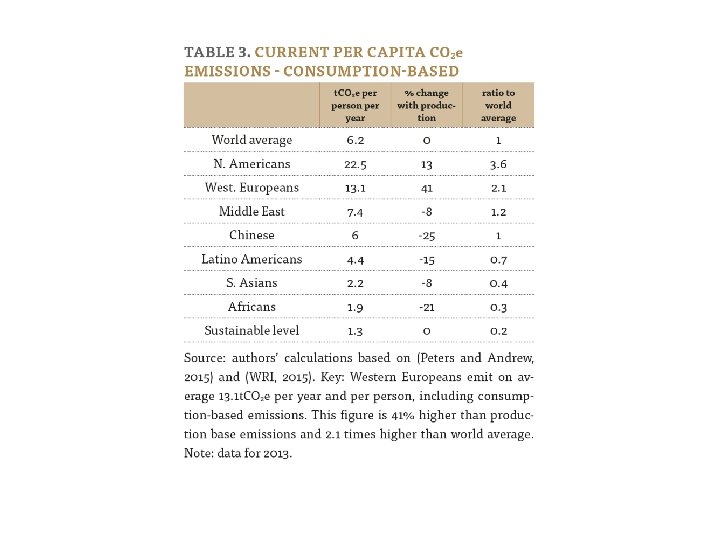
• 4. Inequality and carbon. Rising inequality and global warming need to be adressed together. Top global emitters must compensate poor countries for negative externality. Results from « Carbon and Inequality: from Kyoto to Paris. Trends in the Global Inequality of Carbon Emissions (1998 -2013) and Prospects for an Equitable Adaptation Fund » (joint with L. Chancel, PSE 2015)

Distribution of current consumptionbased emissions Russia/C. Asia 6% S. S. Africa 3% Other. Rich 5% China 22% Other Asia 8% EU 16% North America 21% India 7% Mid. East/N. A Latin America 6% 6%

Where are top individual emitters?

Who should contribute to climate adaptation funding?
")
Who should contribute to climate adaptation funding? (2)
")
Who should contribute to climate adaptation funding? (3)

Conclusions • The history of income and wealth inequality is deeply political, social and cultural; it involves beliefs systems, national identities and sharp reversals • In a way, both Marx and Kuznets were wrong: there are powerful forces pushing in the direction of rising or reducing inequality; which one dominates depends on the institutions and policies that different societies choose to adopt • High r-g can push toward high wealth concentration, but many other forces are also important • The ideal solution involves a broad combination of inclusive institutions, including progressive taxation of income, wealth and carbon; education, social & labor laws; financial transparency; economic & political democracy
- Slides: 50