Red IRIS monitoring and operational procedures Red IRIS









- Slides: 72

Red. IRIS monitoring and operational procedures Red. IRIS – Alberto Escolano Sánchez alberto. escolano@rediris. es 1

Agenda • • • Part I: Monitoring Concepts SNMP Hardware Tools Active Monitoring 2

Concepts • SNMP (Simple Network Management Protocol) – RFC 1157 – Protocol developed to manage nodes of an IP network • UDP (User Datagram Protocol) – RFC 768 – Most commonly used transport protocol for SNMP • SMI (Structure of Management Information) – RFC 1155 – RFC 2578 (version 2) – Contains the definitions for the structure and identification of management information for the Internet 3

Concepts • MIB (Management Information Base) – RFC 1156 – RFC 1213 (version 2) – Together with SNMP and SMI provide the architecture for managing the Internet • OID (Object Identifier) – List of numbers separated by points which specify an exact parameter • NMS (Network Management System) – Set of applications that monitor and control managed devices – Can be standard or vendor specific 4

Agenda • • • Part I: Monitoring Concepts SNMP Hardware Tools Active Monitoring 5

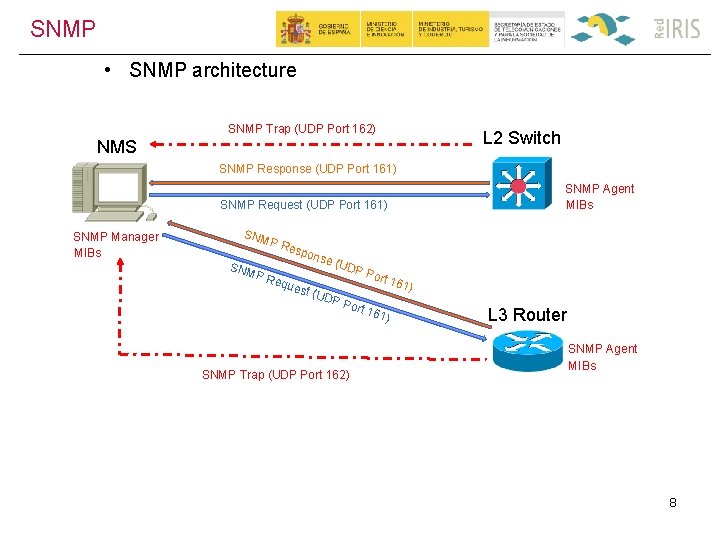
SNMP • Protocol used to manage network devices such as switches, routers and servers • Components – NMS: Software used to monitor and control managed devices – SNMP agent: Management software running in the managed device – Network device: Network node to be managed • SNMP uses the information provided by MIBs • MIBs describe the structure of the management data of a network device in a hierarchical way using OIDs • OIDs identify variables or elements that can be read or written via SNMP • Network devices generate and send SNMP traps to the management system 6

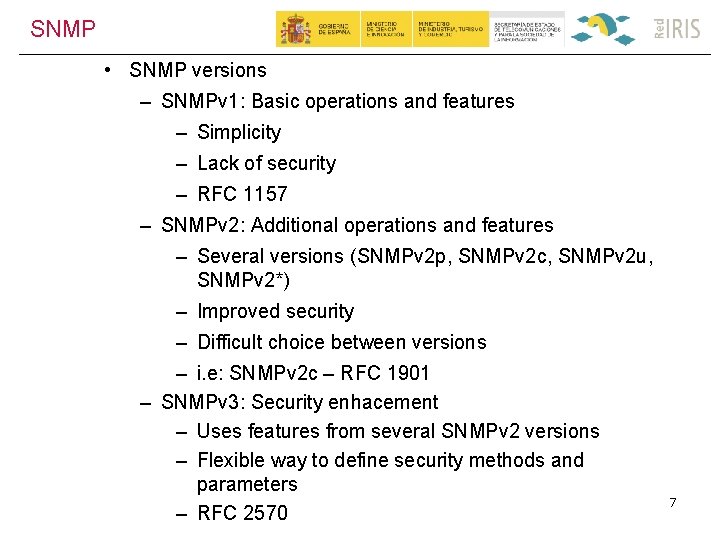
SNMP • SNMP versions – SNMPv 1: Basic operations and features – Simplicity – Lack of security – RFC 1157 – SNMPv 2: Additional operations and features – Several versions (SNMPv 2 p, SNMPv 2 c, SNMPv 2 u, SNMPv 2*) – Improved security – Difficult choice between versions – i. e: SNMPv 2 c – RFC 1901 – SNMPv 3: Security enhacement – Uses features from several SNMPv 2 versions – Flexible way to define security methods and parameters – RFC 2570 7

SNMP • SNMP architecture SNMP Trap (UDP Port 162) L 2 Switch NMS SNMP Response (UDP Port 161) SNMP Agent MIBs SNMP Request (UDP Port 161) SNMP Manager MIBs SNM PR espo equ nse est ( (UD P UDP Port SNMP Trap (UDP Port 162) Port 1 61) 161 ) L 3 Router SNMP Agent MIBs 8

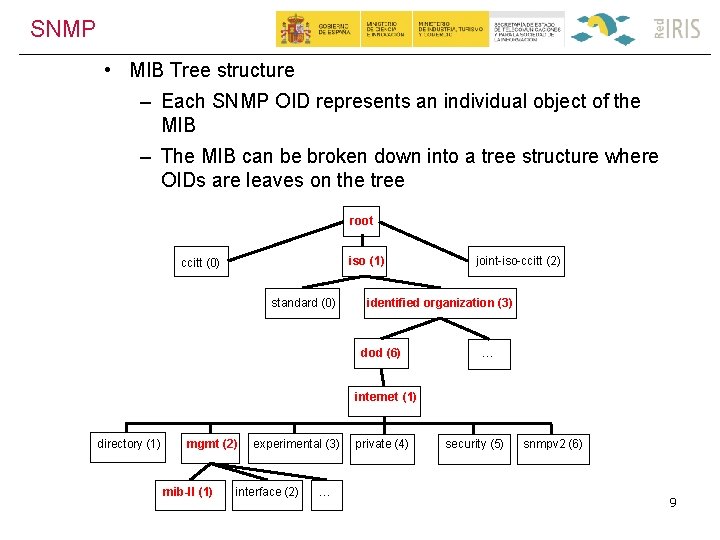
SNMP • MIB Tree structure – Each SNMP OID represents an individual object of the MIB – The MIB can be broken down into a tree structure where OIDs are leaves on the tree root iso (1) ccitt (0) standard (0) joint-iso-ccitt (2) identified organization (3) dod (6) … internet (1) directory (1) mgmt (2) mib-II (1) experimental (3) interface (2) … private (4) security (5) snmpv 2 (6) 9

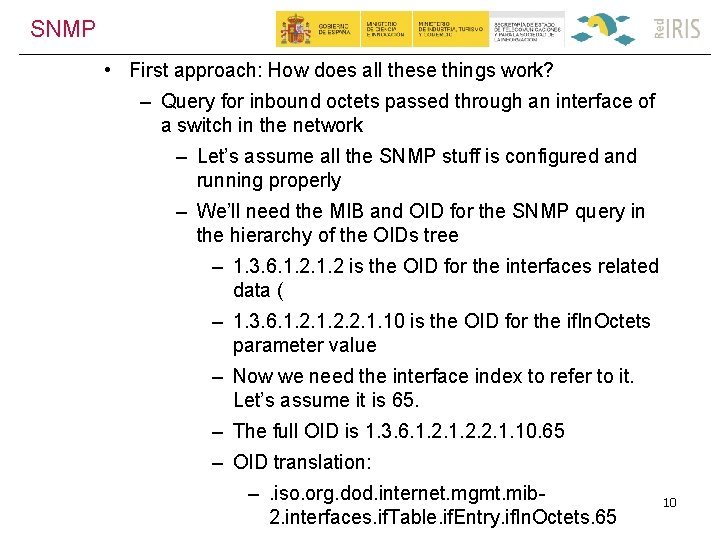
SNMP • First approach: How does all these things work? – Query for inbound octets passed through an interface of a switch in the network – Let’s assume all the SNMP stuff is configured and running properly – We’ll need the MIB and OID for the SNMP query in the hierarchy of the OIDs tree – 1. 3. 6. 1. 2 is the OID for the interfaces related data ( – 1. 3. 6. 1. 2. 2. 1. 10 is the OID for the if. In. Octets parameter value – Now we need the interface index to refer to it. Let’s assume it is 65. – The full OID is 1. 3. 6. 1. 2. 2. 1. 10. 65 – OID translation: –. iso. org. dod. internet. mgmt. mib 2. interfaces. if. Table. if. Entry. if. In. Octets. 65 10

SNMP • Second approach: Numeric OID conversion – 1. 3. 6. 1. 2. 2. 1. 10. 65 is converted using IF-MIB – IF-MIB partially detailed: IF-MIB DEFINITIONS : : = BEGIN IMPORTS MODULE-IDENTITY, OBJECT-TYPE, Counter 32, Gauge 32, Counter 64, Integer 32, Time. Ticks, mib-2, NOTIFICATION-TYPE FROM SNMPv 2 -SMI … if. MIB MODULE-IDENTITY LAST-UPDATED "200006140000 Z" ORGANIZATION "IETF Interfaces MIB Working Group" CONTACT-INFO … if. Entry OBJECT-TYPE SYNTAX If. Entry MAX-ACCESS not-accessible STATUS current DESCRIPTION "An entry containing management information applicable to a particular interface. " INDEX { if. Index } : : = { if. Table 1 } 11

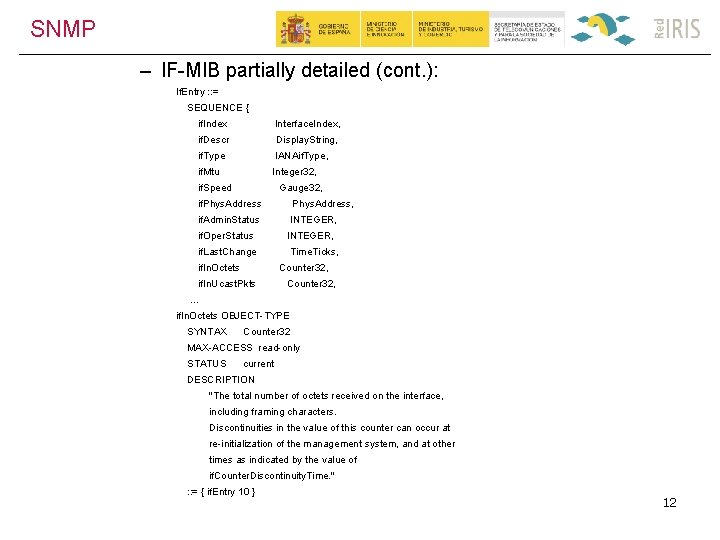
SNMP – IF-MIB partially detailed (cont. ): If. Entry : : = SEQUENCE { if. Index Interface. Index, if. Descr Display. String, if. Type IANAif. Type, if. Mtu Integer 32, if. Speed Gauge 32, if. Phys. Address, if. Admin. Status INTEGER, if. Oper. Status INTEGER, if. Last. Change if. In. Octets Time. Ticks, Counter 32, if. In. Ucast. Pkts Counter 32, … if. In. Octets OBJECT-TYPE SYNTAX Counter 32 MAX-ACCESS read-only STATUS current DESCRIPTION "The total number of octets received on the interface, including framing characters. Discontinuities in the value of this counter can occur at re-initialization of the management system, and at other times as indicated by the value of if. Counter. Discontinuity. Time. " : : = { if. Entry 10 } 12

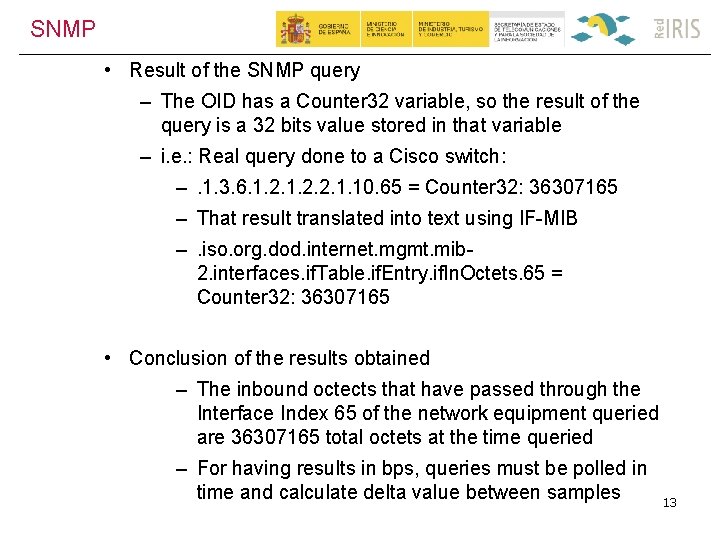
SNMP • Result of the SNMP query – The OID has a Counter 32 variable, so the result of the query is a 32 bits value stored in that variable – i. e. : Real query done to a Cisco switch: –. 1. 3. 6. 1. 2. 2. 1. 10. 65 = Counter 32: 36307165 – That result translated into text using IF-MIB –. iso. org. dod. internet. mgmt. mib 2. interfaces. if. Table. if. Entry. if. In. Octets. 65 = Counter 32: 36307165 • Conclusion of the results obtained – The inbound octects that have passed through the Interface Index 65 of the network equipment queried are 36307165 total octets at the time queried – For having results in bps, queries must be polled in time and calculate delta value between samples 13

Agenda • • • Part I: Monitoring Concepts SNMP Hardware Tools Active Monitoring 14

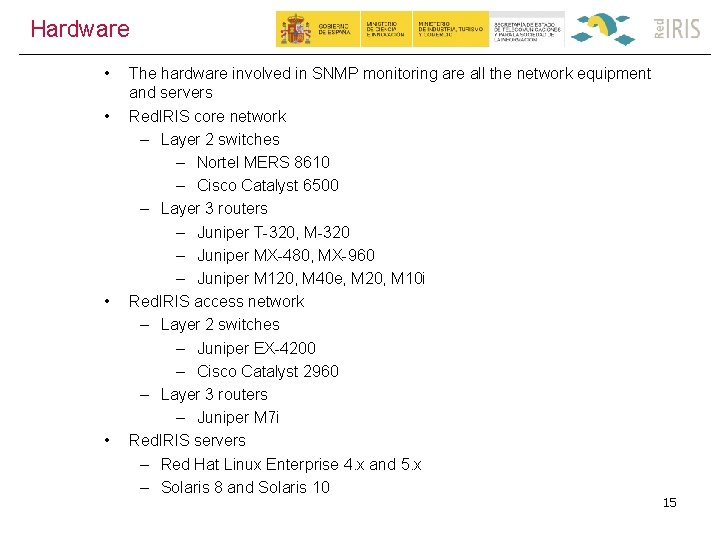
Hardware • • The hardware involved in SNMP monitoring are all the network equipment and servers Red. IRIS core network – Layer 2 switches – Nortel MERS 8610 – Cisco Catalyst 6500 – Layer 3 routers – Juniper T-320, M-320 – Juniper MX-480, MX-960 – Juniper M 120, M 40 e, M 20, M 10 i Red. IRIS access network – Layer 2 switches – Juniper EX-4200 – Cisco Catalyst 2960 – Layer 3 routers – Juniper M 7 i Red. IRIS servers – Red Hat Linux Enterprise 4. x and 5. x – Solaris 8 and Solaris 10 15

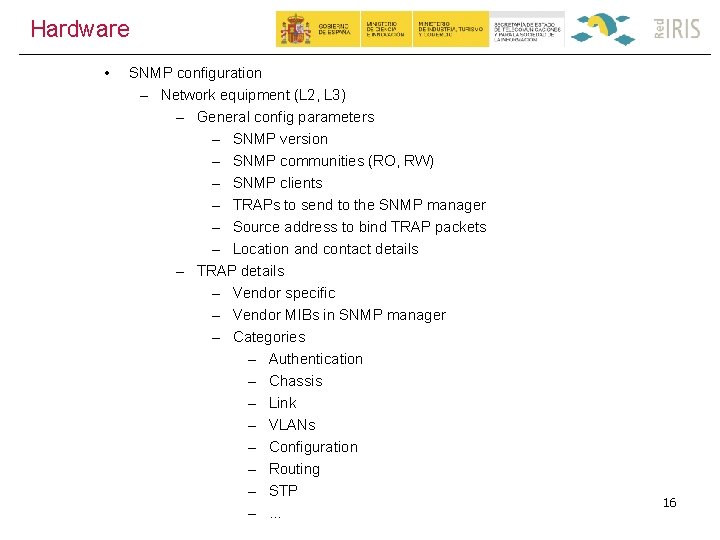
Hardware • SNMP configuration – Network equipment (L 2, L 3) – General config parameters – SNMP version – SNMP communities (RO, RW) – SNMP clients – TRAPs to send to the SNMP manager – Source address to bind TRAP packets – Location and contact details – TRAP details – Vendor specific – Vendor MIBs in SNMP manager – Categories – Authentication – Chassis – Link – VLANs – Configuration – Routing – STP – … 16

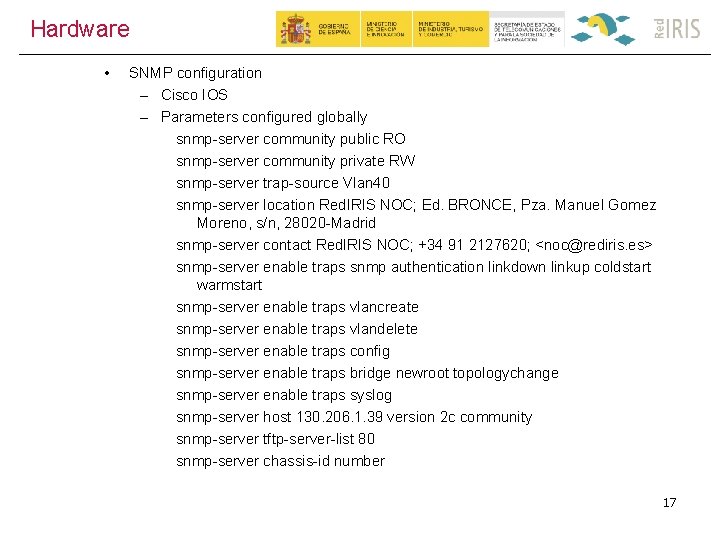
Hardware • SNMP configuration – Cisco IOS – Parameters configured globally snmp-server community public RO snmp-server community private RW snmp-server trap-source Vlan 40 snmp-server location Red. IRIS NOC; Ed. BRONCE, Pza. Manuel Gomez Moreno, s/n, 28020 -Madrid snmp-server contact Red. IRIS NOC; +34 91 2127620; <noc@rediris. es> snmp-server enable traps snmp authentication linkdown linkup coldstart warmstart snmp-server enable traps vlancreate snmp-server enable traps vlandelete snmp-server enable traps config snmp-server enable traps bridge newroot topologychange snmp-server enable traps syslog snmp-server host 130. 206. 1. 39 version 2 c community snmp-server tftp-server-list 80 snmp-server chassis-id number 17

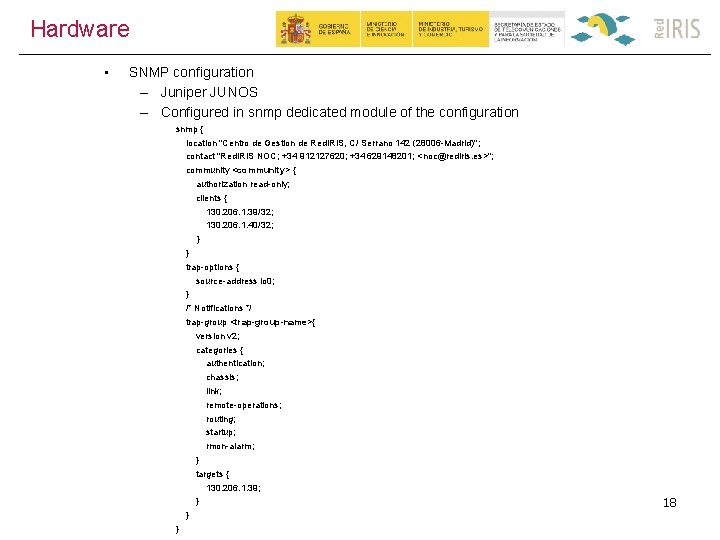
Hardware • SNMP configuration – Juniper JUNOS – Configured in snmp dedicated module of the configuration snmp { location "Centro de Gestion de Red. IRIS, C/ Serrano 142 (28006 -Madrid)"; contact "Red. IRIS NOC; +34 912127620; +34 629148201; <noc@rediris. es>"; community <community> { authorization read-only; clients { 130. 206. 1. 39/32; 130. 206. 1. 40/32; } } trap-options { source-address lo 0; } /* Notifications */ trap-group <trap-group-name>{ version v 2; categories { authentication; chassis; link; remote-operations; routing; startup; rmon-alarm; } targets { 130. 206. 1. 39; } } } 18

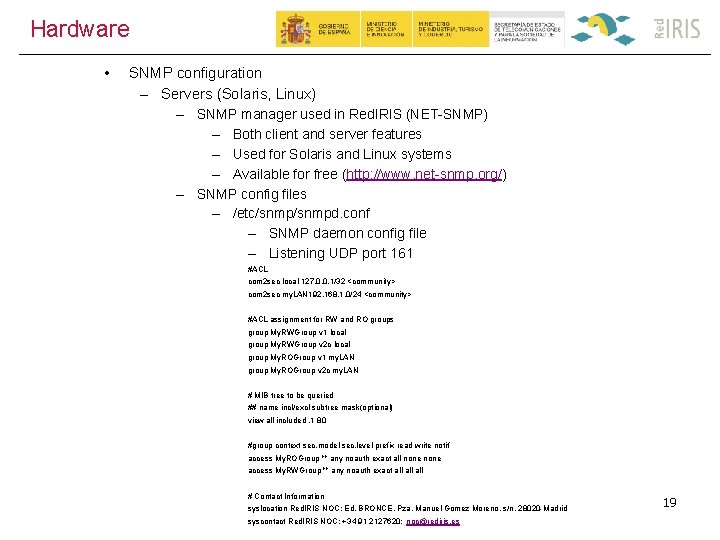
Hardware • SNMP configuration – Servers (Solaris, Linux) – SNMP manager used in Red. IRIS (NET-SNMP) – Both client and server features – Used for Solaris and Linux systems – Available for free (http: //www. net-snmp. org/) – SNMP config files – /etc/snmpd. conf – SNMP daemon config file – Listening UDP port 161 #ACL com 2 sec local 127. 0. 0. 1/32 <community> com 2 sec my. LAN 192. 168. 1. 0/24 <community> #ACL assignment for RW and RO groups group My. RWGroup v 1 local group My. RWGroup v 2 c local group My. ROGroup v 1 my. LAN group My. ROGroup v 2 c my. LAN # MIB tree to be queried ## name incl/excl subtree mask(optional) view all included. 1 80 #group context sec. model sec. level prefix read write notif access My. ROGroup "" any noauth exact all none access My. RWGroup "" any noauth exact all all # Contact Information syslocation Red. IRIS NOC; Ed. BRONCE, Pza. Manuel Gomez Moreno, s/n, 28020 -Madrid syscontact Red. IRIS NOC; +34 91 2127620; noc@rediris. es 19

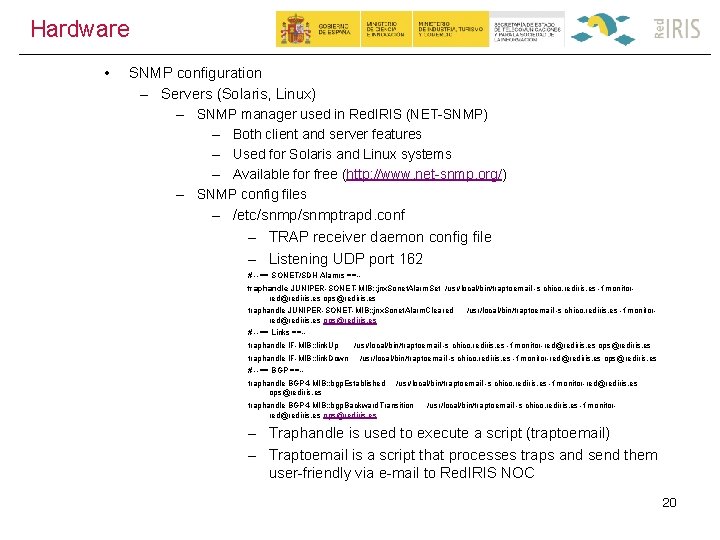
Hardware • SNMP configuration – Servers (Solaris, Linux) – SNMP manager used in Red. IRIS (NET-SNMP) – Both client and server features – Used for Solaris and Linux systems – Available for free (http: //www. net-snmp. org/) – SNMP config files – /etc/snmptrapd. conf – TRAP receiver daemon config file – Listening UDP port 162 # --== SONET/SDH Alamrs ==-traphandle JUNIPER-SONET-MIB: : jnx. Sonet. Alarm. Set /usr/local/bin/traptoemail -s chico. rediris. es -f monitorred@rediris. es ops@rediris. es traphandle JUNIPER-SONET-MIB: : jnx. Sonet. Alarm. Cleared red@rediris. es ops@rediris. es /usr/local/bin/traptoemail -s chico. rediris. es -f monitor- # --== Links ==-traphandle IF-MIB: : link. Up traphandle IF-MIB: : link. Down /usr/local/bin/traptoemail -s chico. rediris. es -f monitor-red@rediris. es ops@rediris. es # --== BGP ==-traphandle BGP 4 -MIB: : bgp. Established ops@rediris. es /usr/local/bin/traptoemail -s chico. rediris. es -f monitor-red@rediris. es traphandle BGP 4 -MIB: : bgp. Backward. Transition red@rediris. es ops@rediris. es /usr/local/bin/traptoemail -s chico. rediris. es -f monitor- – Traphandle is used to execute a script (traptoemail) – Traptoemail is a script that processes traps and send them user-friendly via e-mail to Red. IRIS NOC 20

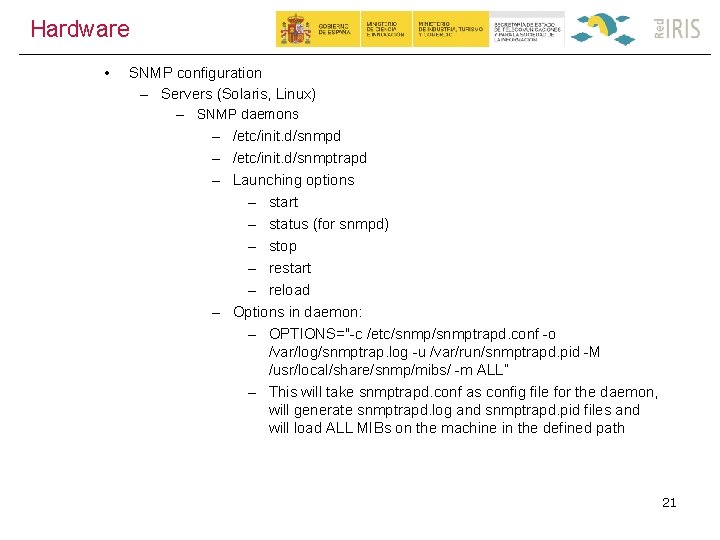
Hardware • SNMP configuration – Servers (Solaris, Linux) – SNMP daemons – /etc/init. d/snmpd – /etc/init. d/snmptrapd – Launching options – start – status (for snmpd) – stop – restart – reload – Options in daemon: – OPTIONS="-c /etc/snmptrapd. conf -o /var/log/snmptrap. log -u /var/run/snmptrapd. pid -M /usr/local/share/snmp/mibs/ -m ALL” – This will take snmptrapd. conf as config file for the daemon, will generate snmptrapd. log and snmptrapd. pid files and will load ALL MIBs on the machine in the defined path 21

Agenda • • • Part I: Monitoring Concepts SNMP Hardware Tools Active Monitoring 22

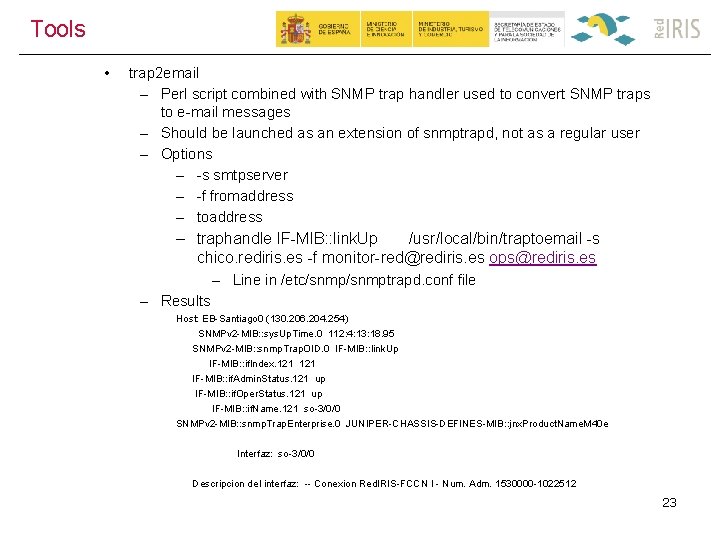
Tools • trap 2 email – Perl script combined with SNMP trap handler used to convert SNMP traps to e-mail messages – Should be launched as an extension of snmptrapd, not as a regular user – Options – -s smtpserver – -f fromaddress – toaddress – traphandle IF-MIB: : link. Up /usr/local/bin/traptoemail -s chico. rediris. es -f monitor-red@rediris. es ops@rediris. es – Line in /etc/snmptrapd. conf file – Results Host: EB-Santiago 0 (130. 206. 204. 254) SNMPv 2 -MIB: : sys. Up. Time. 0 112: 4: 13: 18. 95 SNMPv 2 -MIB: : snmp. Trap. OID. 0 IF-MIB: : link. Up IF-MIB: : if. Index. 121 IF-MIB: : if. Admin. Status. 121 up IF-MIB: : if. Oper. Status. 121 up IF-MIB: : if. Name. 121 so-3/0/0 SNMPv 2 -MIB: : snmp. Trap. Enterprise. 0 JUNIPER-CHASSIS-DEFINES-MIB: : jnx. Product. Name. M 40 e Interfaz: so-3/0/0 Descripcion del interfaz: -- Conexion Red. IRIS-FCCN I - Num. Adm. 1530000 -1022512 23

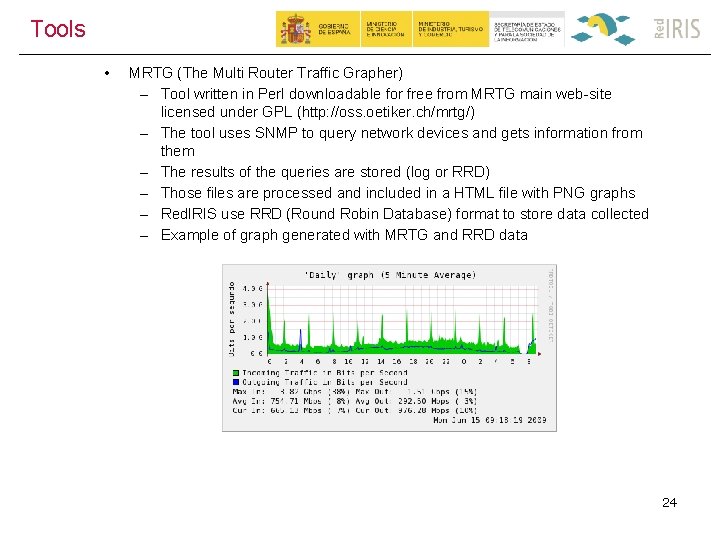
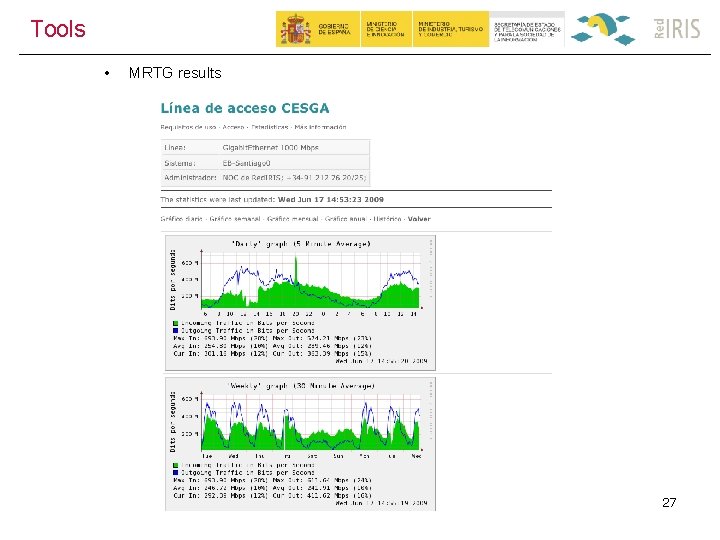
Tools • MRTG (The Multi Router Traffic Grapher) – Tool written in Perl downloadable for free from MRTG main web-site licensed under GPL (http: //oss. oetiker. ch/mrtg/) – The tool uses SNMP to query network devices and gets information from them – The results of the queries are stored (log or RRD) – Those files are processed and included in a HTML file with PNG graphs – Red. IRIS use RRD (Round Robin Database) format to store data collected – Example of graph generated with MRTG and RRD data 24

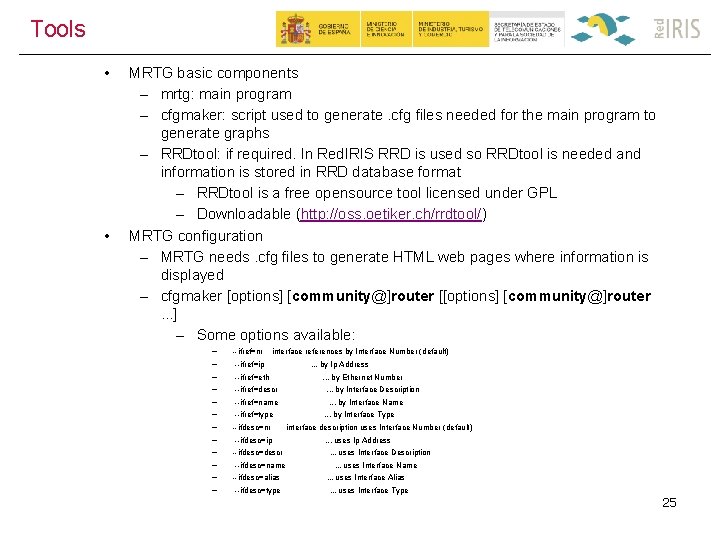
Tools • • MRTG basic components – mrtg: main program – cfgmaker: script used to generate. cfg files needed for the main program to generate graphs – RRDtool: if required. In Red. IRIS RRD is used so RRDtool is needed and information is stored in RRD database format – RRDtool is a free opensource tool licensed under GPL – Downloadable (http: //oss. oetiker. ch/rrdtool/) MRTG configuration – MRTG needs. cfg files to generate HTML web pages where information is displayed – cfgmaker [options] [community@]router [[options] [community@]router. . . ] – Some options available: – – – --ifref=nr interface references by Interface Number (default) --ifref=ip --ifref=eth --ifref=descr --ifref=name --ifref=type --ifdesc=nr --ifdesc=ip --ifdesc=descr --ifdesc=name --ifdesc=alias --ifdesc=type . . . by Ip Address. . . by Ethernet Number. . . by Interface Description. . . by Interface Name. . . by Interface Type interface description uses Interface Number (default). . . uses Ip Address. . . uses Interface Description. . . uses Interface Name. . . uses Interface Alias. . . uses Interface Type 25

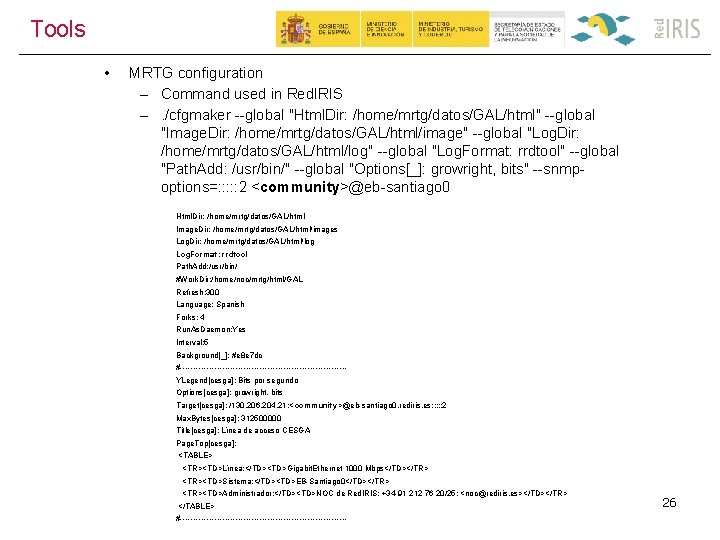
Tools • MRTG configuration – Command used in Red. IRIS –. /cfgmaker --global "Html. Dir: /home/mrtg/datos/GAL/html" --global "Image. Dir: /home/mrtg/datos/GAL/html/image" --global "Log. Dir: /home/mrtg/datos/GAL/html/log" --global "Log. Format: rrdtool" --global "Path. Add: /usr/bin/" --global "Options[_]: growright, bits" --snmpoptions=: : : 2 <community>@eb-santiago 0 Html. Dir: /home/mrtg/datos/GAL/html Image. Dir: /home/mrtg/datos/GAL/html/images Log. Dir: /home/mrtg/datos/GAL/html/log Log. Format: rrdtool Path. Add: /usr/bin/ #Work. Dir: /home/noc/mrtg/html/GAL Refresh: 300 Language: Spanish Forks: 4 Run. As. Daemon: Yes Interval: 5 Background[_]: #e 8 e 7 dc #-------------------------------YLegend[cesga]: Bits por segundo Options[cesga]: growright, bits Target[cesga]: /130. 206. 204. 21: < community>@eb-santiago 0. rediris. es: : : 2 Max. Bytes[cesga]: 312500000 Title[cesga]: Línea de acceso CESGA Page. Top[cesga]: <TABLE> <TR><TD>Línea: </TD><TD>Gigabit. Ethernet 1000 Mbps</TD></TR> <TR><TD>Sistema: </TD><TD>EB-Santiago 0</TD></TR> <TR><TD>Administrador: </TD><TD>NOC de Red. IRIS; +34 -91 212 76 20/25; <noc@rediris. es></TD></TR> </TABLE> #-------------------------------- 26

Tools • MRTG results 27

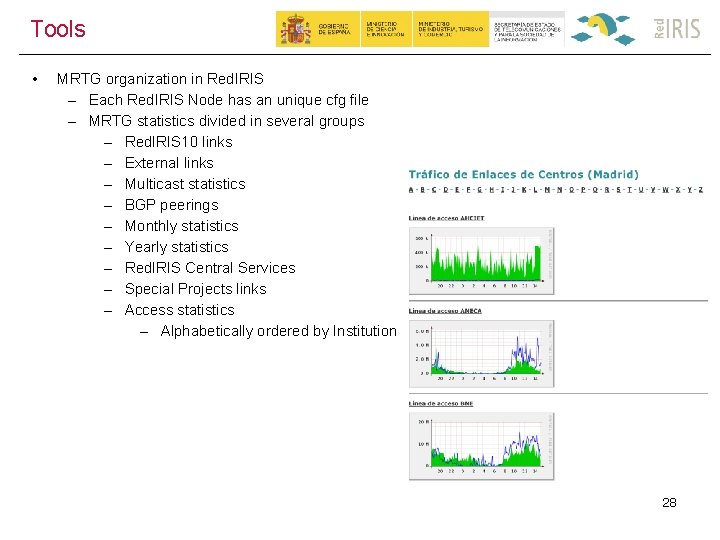
Tools • MRTG organization in Red. IRIS – Each Red. IRIS Node has an unique cfg file – MRTG statistics divided in several groups – Red. IRIS 10 links – External links – Multicast statistics – BGP peerings – Monthly statistics – Yearly statistics – Red. IRIS Central Services – Special Projects links – Access statistics – Alphabetically ordered by Institution 28

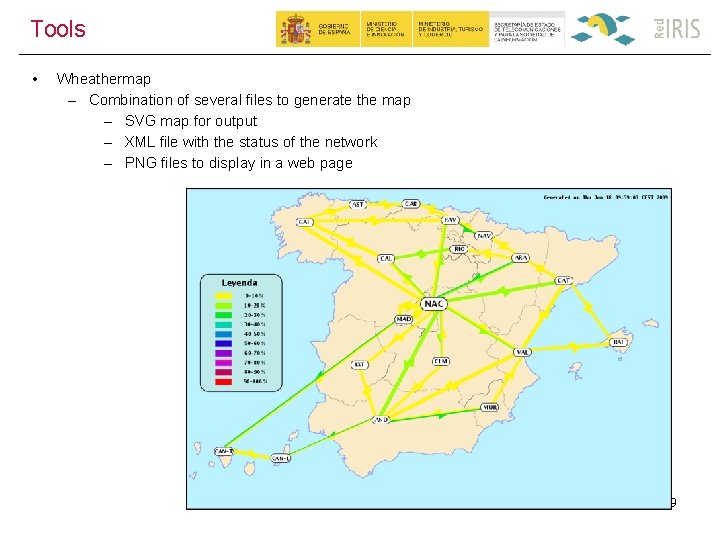
Tools • Wheathermap – Combination of several files to generate the map – SVG map for output – XML file with the status of the network – PNG files to display in a web page 29

Tools • Nagios – Open Source monitoring tool licensed under GPL – Free downloadable (http: //www. nagios. org/) – Prerequisites needed to install the tool – HTTP server (Apache) – GCC compiler to build the binaries from source – GD development libraries – In fedora Linux for example all packages can be installed with yum install httpd yum install gcc yum install glibc-common yum install gd gd-devel – Download and install Nagios and Nagios Plugins – Nagios Plugins are needed to check the status of hosts and services – HTTP, POP 3, FTP, SSH, NTP… – CPU Load, Disk Usage, Memory Usage, Users… – Servers and Hosts (Unix/Linux, Windows) – Routers, Switches – … 30

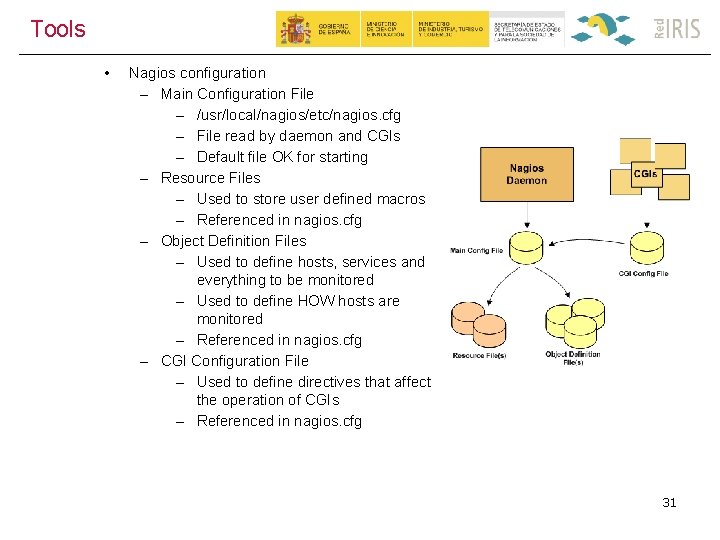
Tools • Nagios configuration – Main Configuration File – /usr/local/nagios/etc/nagios. cfg – File read by daemon and CGIs – Default file OK for starting – Resource Files – Used to store user defined macros – Referenced in nagios. cfg – Object Definition Files – Used to define hosts, services and everything to be monitored – Used to define HOW hosts are monitored – Referenced in nagios. cfg – CGI Configuration File – Used to define directives that affect the operation of CGIs – Referenced in nagios. cfg 31

Tools • Nagios configuration examples – Main Configuration File – nagios. cfg – Default file after installing is OK for starting with the tool – Resource Files – Optional and useful to store usernames, passwords of paths – See resource. cfg file in the sample-config directory of the Nagios installation package – Object Definition Files – Defined in nagios cfg: cfg_file=<file_name> cfg_file=/usr/local/nagios/etc/hosts. cfg_file=/usr/local/nagios/etc/services. cfg_file=/usr/local/nagios/etc/commands. cfg – Example hosts. cfg file define host{ use generic-host_name chico. rediris. es alias Chico Address 130. 206. 1. 3 check_command check-host-alive max_check_attempts 10 notification_interval 120 notification_period 24× 7 notification_options d, u, r } – CGI Configuration File – cgi. cfg file located in the config directory authorized_for_system_information=nagiosadmin authorized_for_configuration_information=nagiosadmin authorized_for_system_commands=nagiosadmin 32

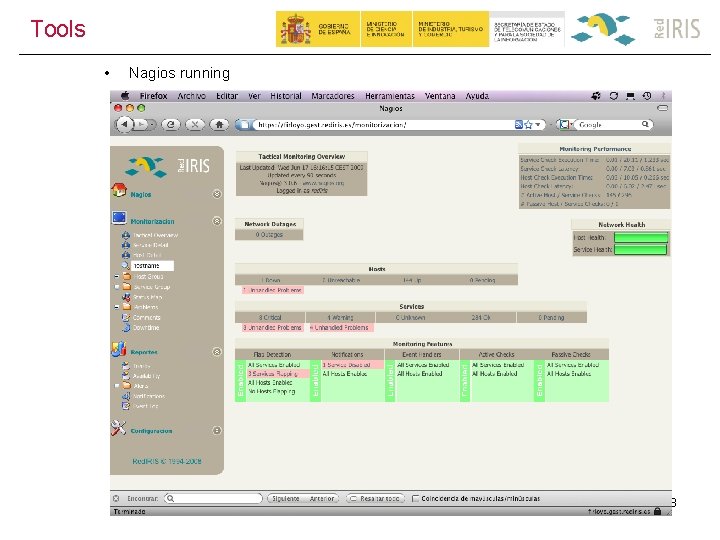
Tools • Nagios running 33

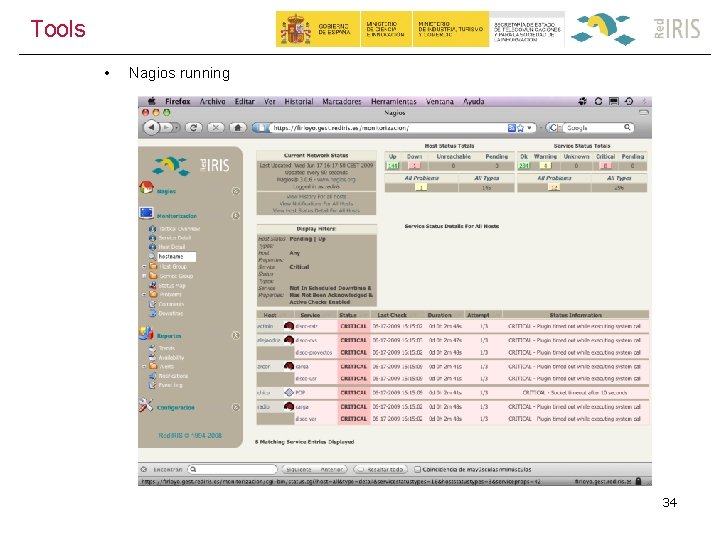
Tools • Nagios running 34

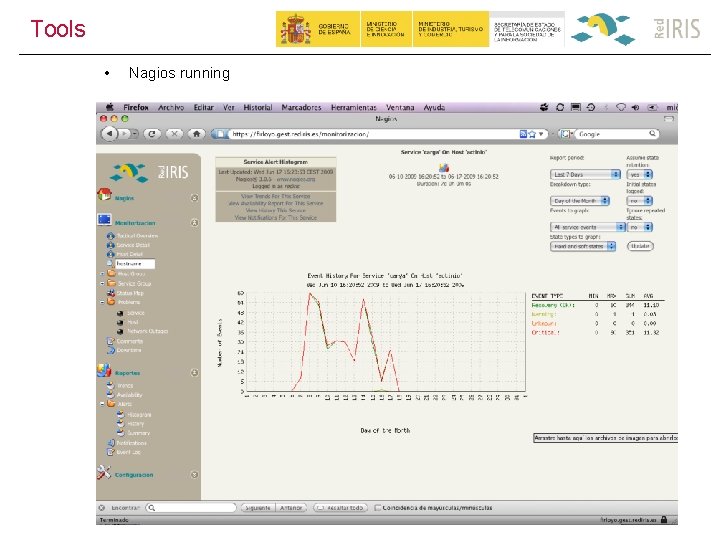
Tools • Nagios running 35

Tools • Nagios running 36

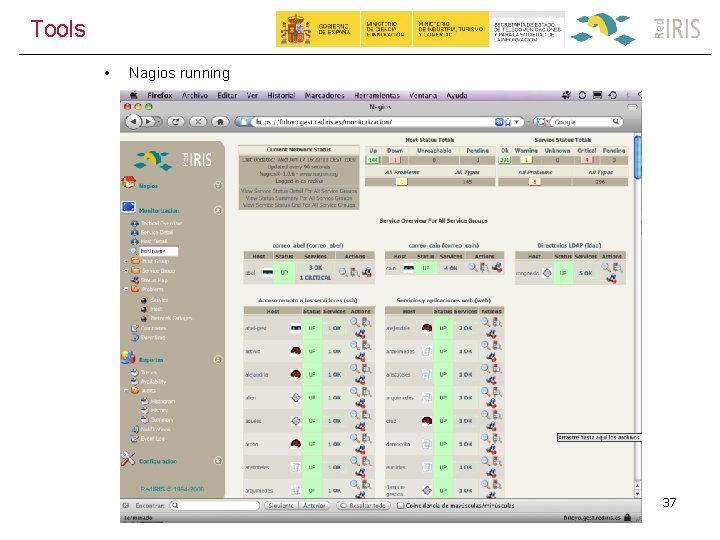
Tools • Nagios running 37

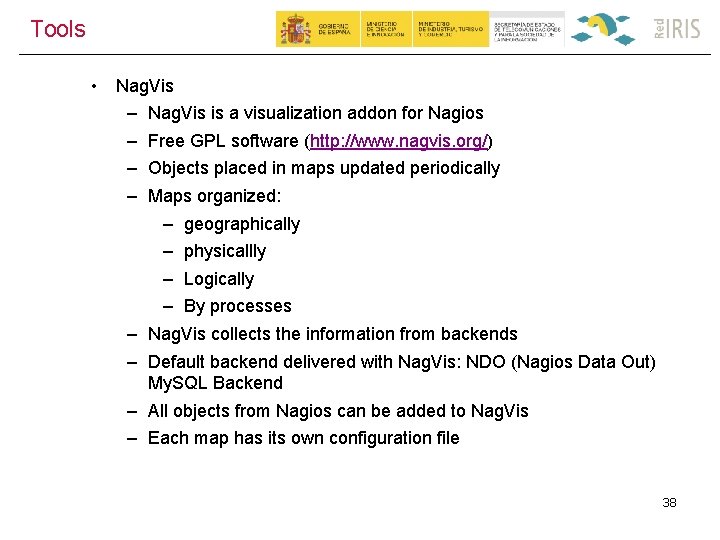
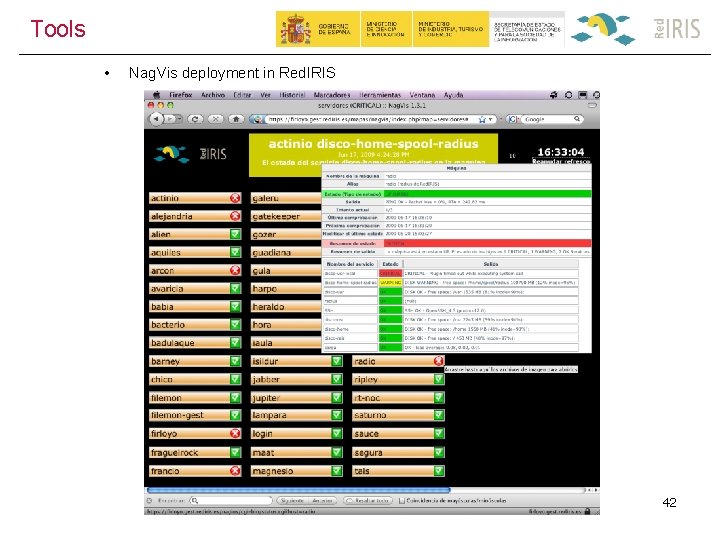
Tools • Nag. Vis – – – – Nag. Vis is a visualization addon for Nagios Free GPL software (http: //www. nagvis. org/) Objects placed in maps updated periodically Maps organized: – geographically – physicallly – Logically – By processes Nag. Vis collects the information from backends Default backend delivered with Nag. Vis: NDO (Nagios Data Out) My. SQL Backend All objects from Nagios can be added to Nag. Vis Each map has its own configuration file 38

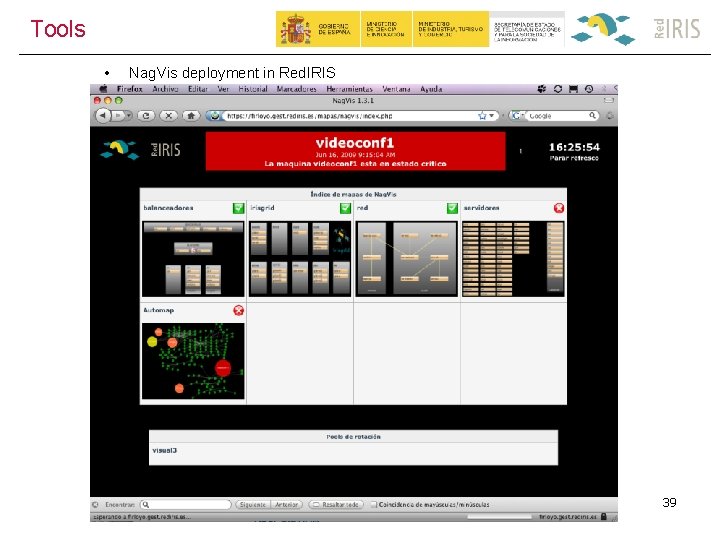
Tools • Nag. Vis deployment in Red. IRIS 39

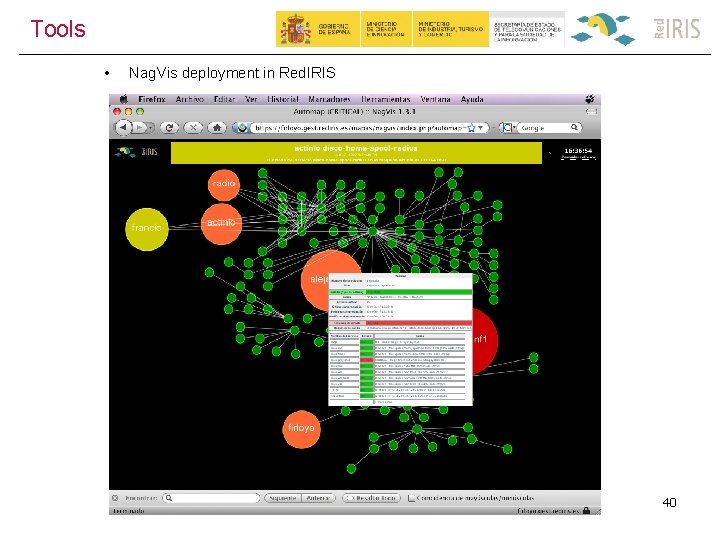
Tools • Nag. Vis deployment in Red. IRIS 40

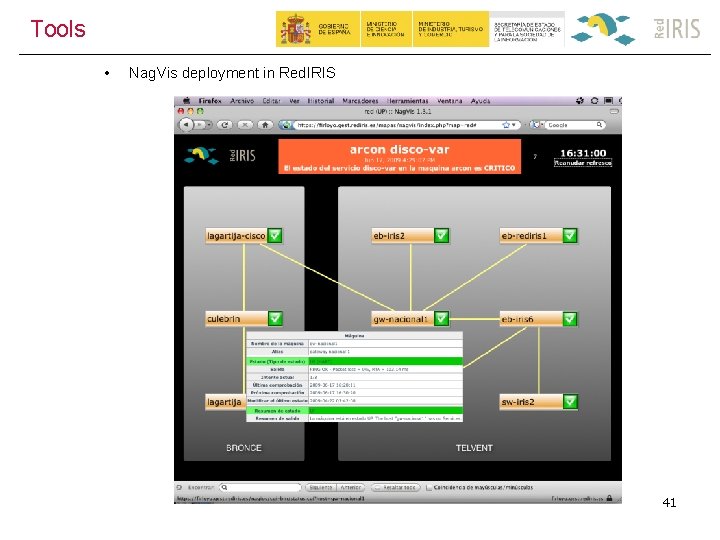
Tools • Nag. Vis deployment in Red. IRIS 41

Tools • Nag. Vis deployment in Red. IRIS 42

Agenda • • • Part I: Monitoring Concepts SNMP Hardware Tools Active Monitoring 43

Active Monitoring • • • Until now all monitoring issues covered are passive monitoring related – Passive monitoring is considered when devices are periodically polled to collect data Active Monitoring – What is? – Active requires “action” – Active monitoring is considered when injecting packets in the network to make tests and get results – Throughput – Delay Active Monitoring – How to do it? – In Red. IRIS we are actually deploying perf. SONAR (PERFormance Service Oriented Network monitoring ARchitecture ) – Information and downloading (http: //www. perfsonar. net/) – DANTE vs Internet 2 version – JAVA vs Perl 44

Active Monitoring • perf. SONAR components – Client / Server application – Client-side - perf. SONAR UI (User Interface) – Server-side – 1 Linux box for throughput measurements (BWCTL) – 1 Linux box for delay measurements (OWAMP) – Server installation – Red Hat Enterprise Linux 5. 3 recomended – May run in any Linux distribution – Red. IRIS tested in Cent. OS Linux 5. 3 – Set of tools available in RPM binaries and TGZ sources – Some dependencies not resolved – It’s not expensive but hard to deploy – Client installation – JAVA graphical client multi-platform available 45

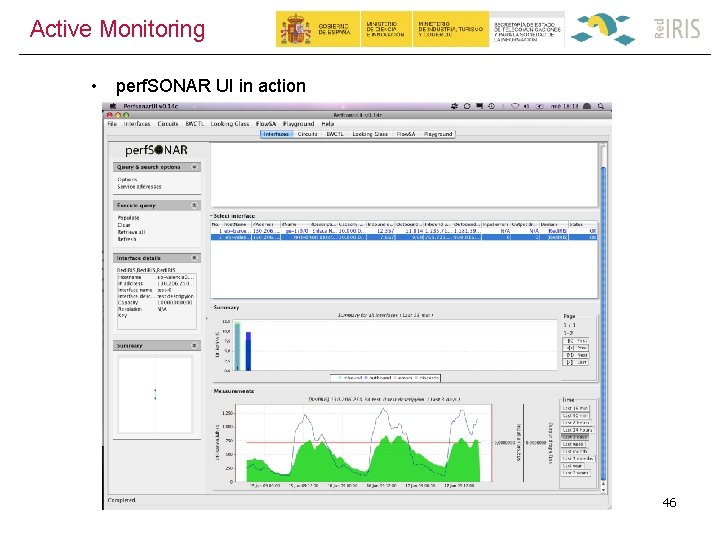
Active Monitoring • perf. SONAR UI in action 46

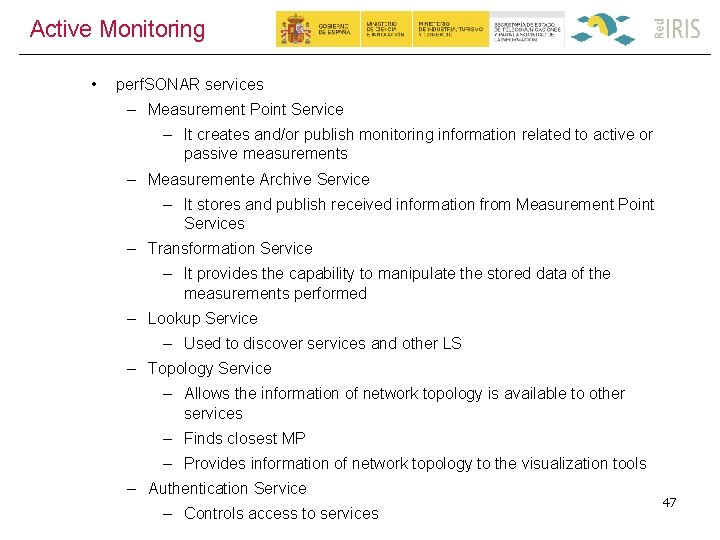
Active Monitoring • perf. SONAR services – Measurement Point Service – It creates and/or publish monitoring information related to active or passive measurements – Measuremente Archive Service – It stores and publish received information from Measurement Point Services – Transformation Service – It provides the capability to manipulate the stored data of the measurements performed – Lookup Service – Used to discover services and other LS – Topology Service – Allows the information of network topology is available to other services – Finds closest MP – Provides information of network topology to the visualization tools – Authentication Service – Controls access to services 47

Active Monitoring • perf. SONAR services – Measurement Point Service – It creates and/or publish monitoring information related to active or passive measurements – Measuremente Archive Service – It stores and publish received information from Measurement Point Services – Transformation Service – It provides the capability to manipulate the stored data of the measurements performed – Lookup Service – Used to discover services and other LS – Topology Service – Allows the information of network topology is available to other services – Finds closest MP – Provides information of network topology to the visualization tools – Authentication Service – Controls access to services 48

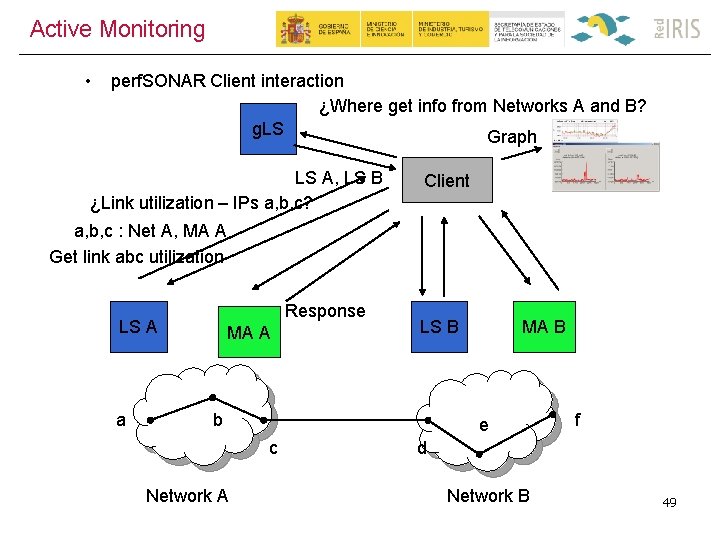
Active Monitoring • perf. SONAR Client interaction ¿Where get info from Networks A and B? g. LS Graph LS A, LS B ¿Link utilization – IPs a, b, c? Client a, b, c : Net A, MA A Get link abc utilization Response LS A a MA A LS B b e c Network A MA B f d Network B 49

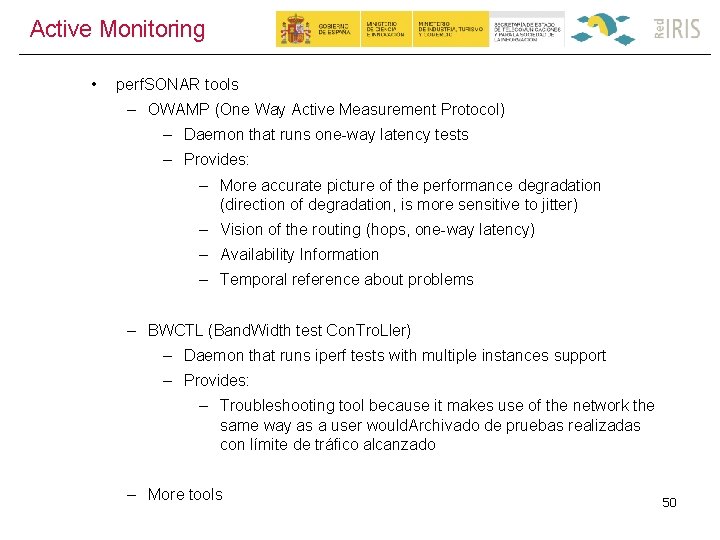
Active Monitoring • perf. SONAR tools – OWAMP (One Way Active Measurement Protocol) – Daemon that runs one-way latency tests – Provides: – More accurate picture of the performance degradation (direction of degradation, is more sensitive to jitter) – Vision of the routing (hops, one-way latency) – Availability Information – Temporal reference about problems – BWCTL (Band. Width test Con. Tro. Ller) – Daemon that runs iperf tests with multiple instances support – Provides: – Troubleshooting tool because it makes use of the network the same way as a user would. Archivado de pruebas realizadas con límite de tráfico alcanzado – More tools 50

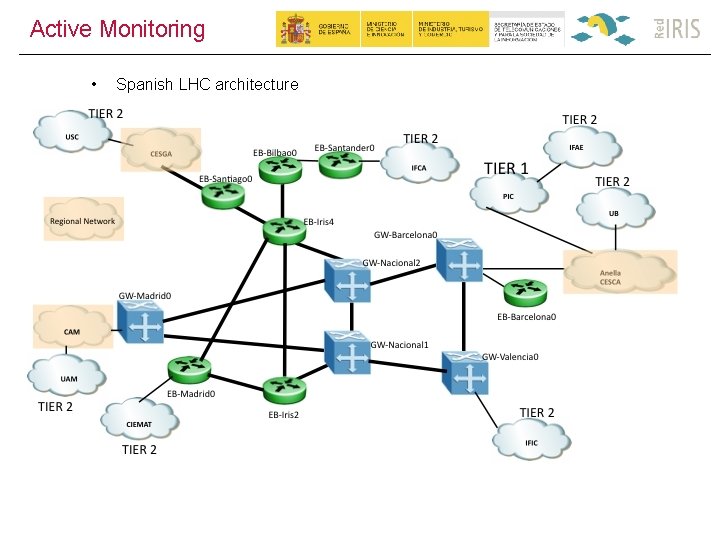
Active Monitoring • Spanish LHC architecture

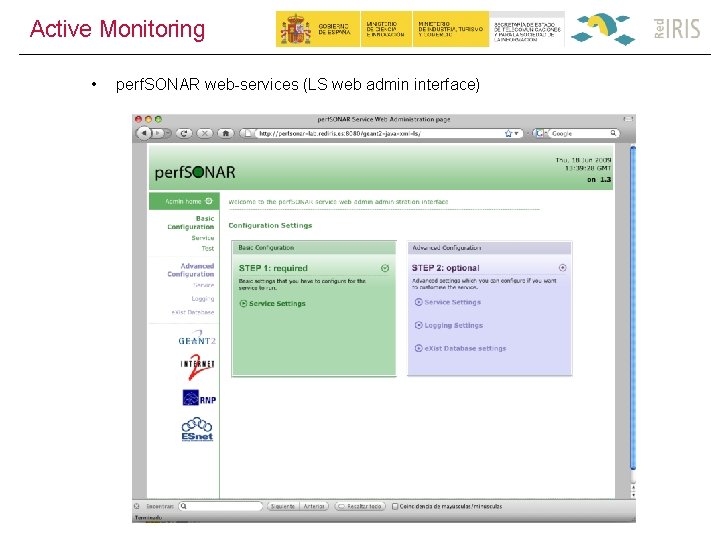
Active Monitoring • perf. SONAR web-services (LS web admin interface)

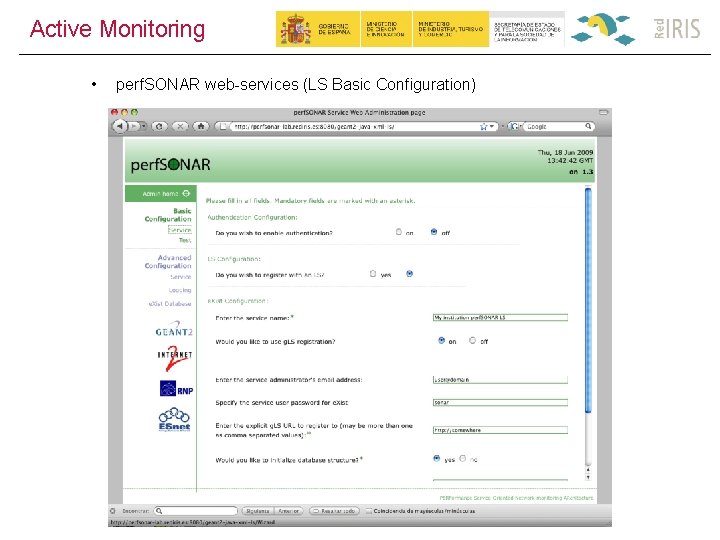
Active Monitoring • perf. SONAR web-services (LS Basic Configuration)

Agenda • • Part II: Operational Procedures Organization Incidents Maintenance works 24 x 7 SLAs Procedure 54

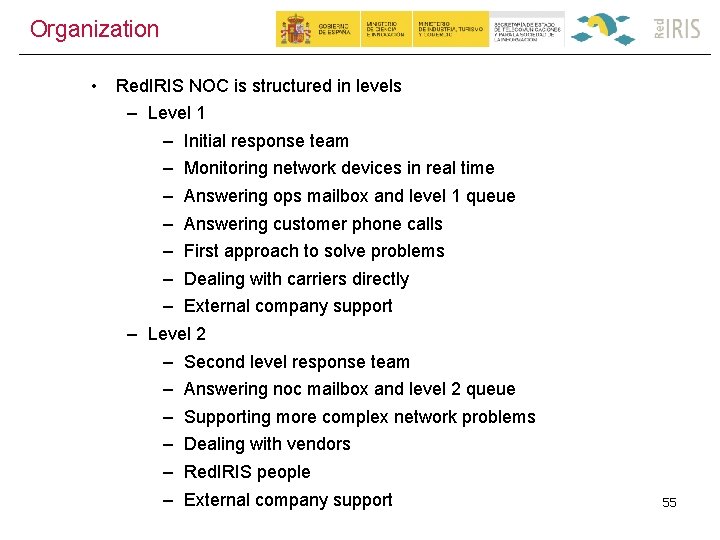
Organization • Red. IRIS NOC is structured in levels – Level 1 – Initial response team – Monitoring network devices in real time – Answering ops mailbox and level 1 queue – Answering customer phone calls – First approach to solve problems – Dealing with carriers directly – External company support – Level 2 – Second level response team – Answering noc mailbox and level 2 queue – Supporting more complex network problems – Dealing with vendors – Red. IRIS people – External company support 55

Agenda • • Part II: Operational Procedures Organization Incidents Maintenance works 24 x 7 SLAs Procedure 56

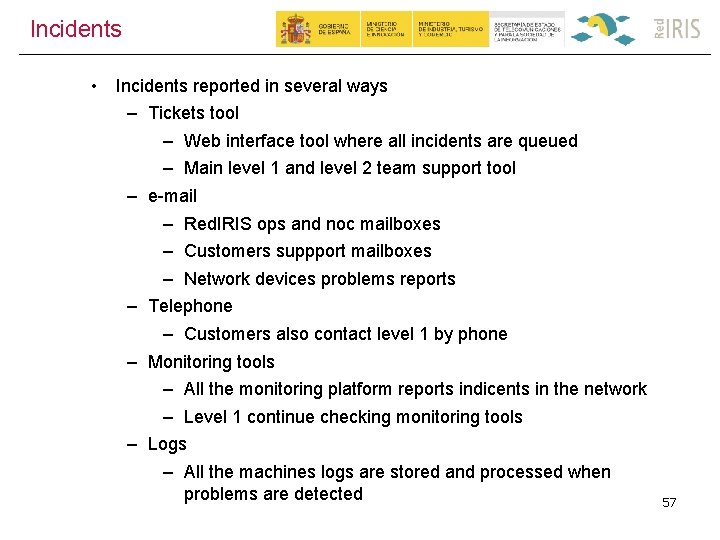
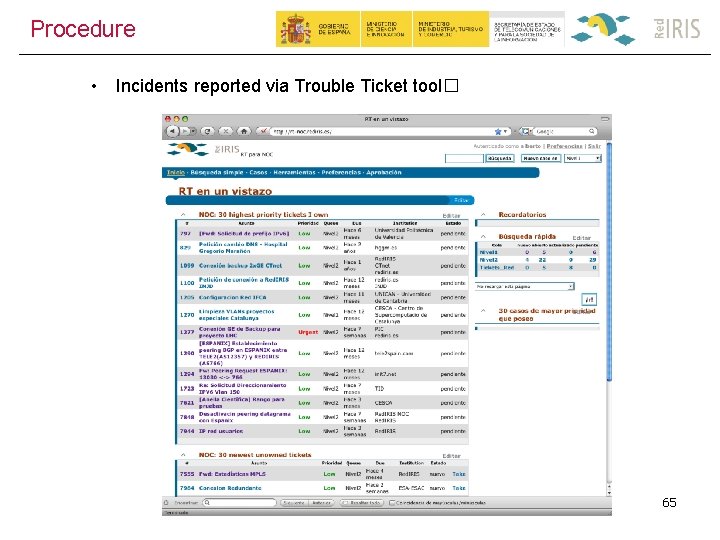
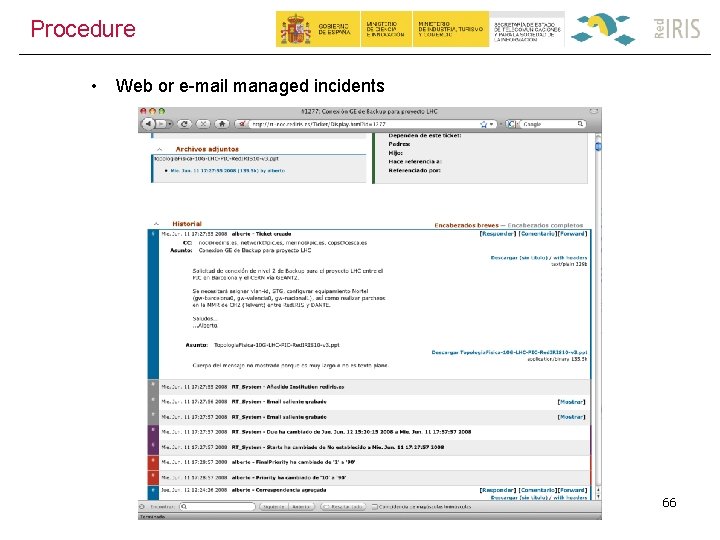
Incidents • Incidents reported in several ways – Tickets tool – Web interface tool where all incidents are queued – Main level 1 and level 2 team support tool – e-mail – Red. IRIS ops and noc mailboxes – Customers suppport mailboxes – Network devices problems reports – Telephone – Customers also contact level 1 by phone – Monitoring tools – All the monitoring platform reports indicents in the network – Level 1 continue checking monitoring tools – Logs – All the machines logs are stored and processed when problems are detected 57

Agenda • • Part II: Operational Procedures Organization Incidents Maintenance works 24 x 7 SLAs Procedure 58

Maintenance works • • Different possibilities – Network operator programmed work – 15 previous days notification – Red. IRIS aceptation – Red. IRIS programmed work – Engineering tasks – Maintenance tasks – New service configuration – Non-programmed works – Due to unexpected problems – Network links (fiber cuts, etc. ) – Network equipment (hardware problems) Ticket system notification for all Institutions connected to Red. IRIS – Web based tool used to notify and update information about network problems – Notifications via e-mail 59

Agenda • • Part II: Operational Procedures Organization Incidents Maintenance works 24 x 7 SLAs Procedure 60

24 x 7 • • • External company 24 x 7 x 365 monitoring – Support when Red. IRIS people not in the office – Procedures to monitor all Red. IRIS equipment – Procedures to open/close RMAs – Hardware replacement procedures established – Network operator and hardware vendors interaction They can also do in the equipment – Execute “show” commands for monitoring – Receive SNMP trap notifications – Console login for Hardware replacements They can NOT do in the equipment – Execute “config” commands – Modify running configuration – Configure new services 61

Agenda • • Part II: Operational Procedures Organization Incidents Maintenance works 24 x 7 SLAs Procedure 62

SLAs • • • Network Operators SLA – Maintanence works MUST be 15 previous days notified – If this is not done then a penalty is applied – The links stability and quality must be guaranteed – No degradation – No outages – There is a penalty for link failures greater than 10 secs – There is a maximum incident response time established – Incremental penalty to several failures of the same link External company SLA – Dedicated people guaranteed – Maximum incident response time – Hardware stockage available Hardware vendor SLA – 4 hour hardware replacement guaranteed – Engineering support 63

Agenda • • Part II: Operational Procedures Organization Incidents Maintenance works 24 x 7 SLAs Procedure 64

Procedure • Incidents reported via Trouble Ticket tool� 65

Procedure • Web or e-mail managed incidents 66

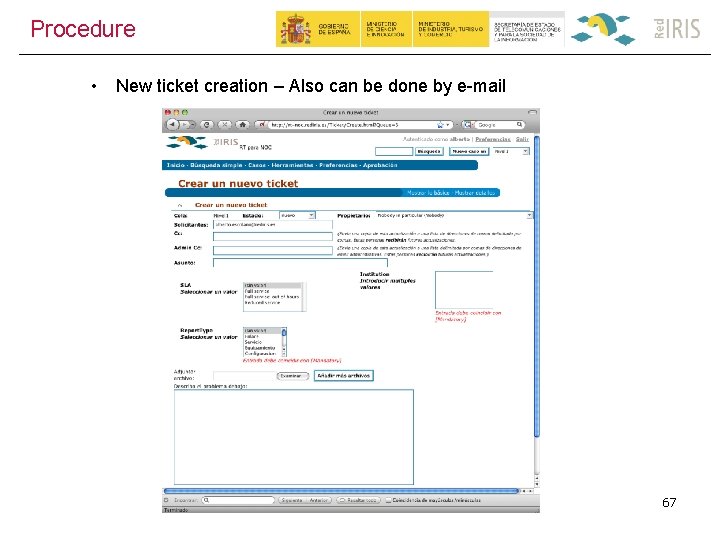
Procedure • New ticket creation – Also can be done by e-mail 67

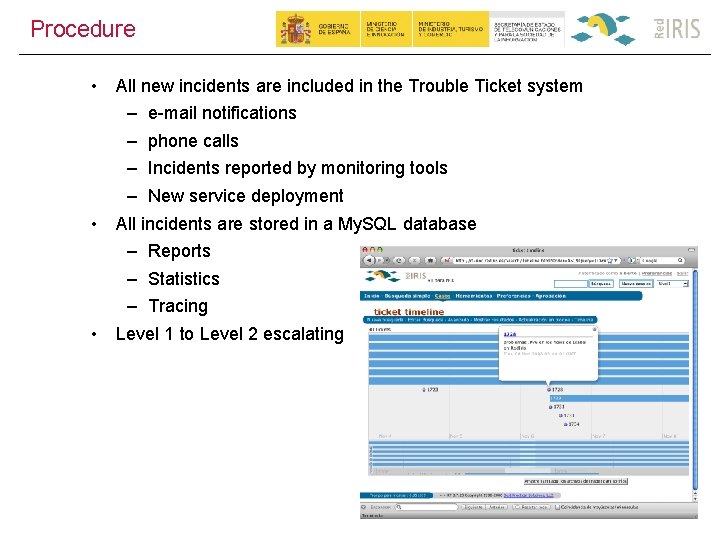
Procedure • All new incidents are included in the Trouble Ticket system • – e-mail notifications – phone calls – Incidents reported by monitoring tools – New service deployment All incidents are stored in a My. SQL database – Reports – Statistics – Tracing Level 1 to Level 2 escalating • 68

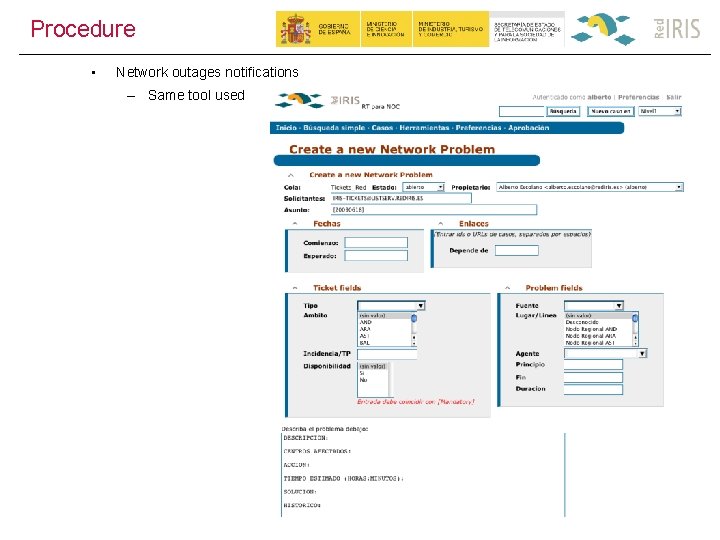
Procedure • Network outages notifications – Same tool used 69

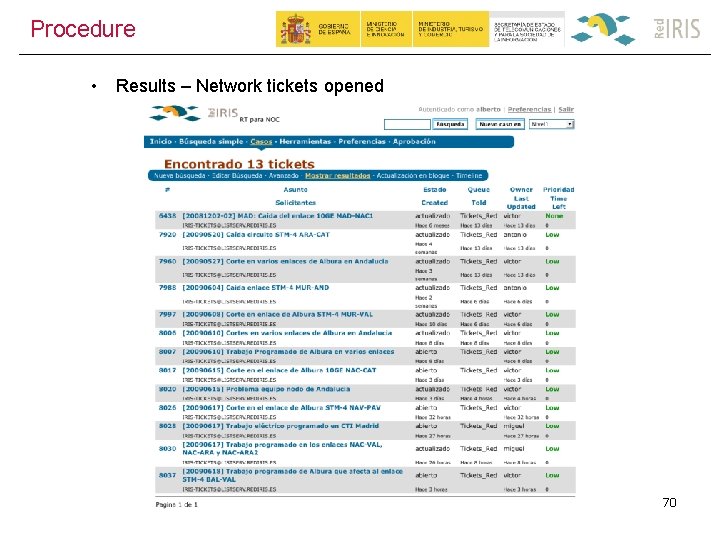
Procedure • Results – Network tickets opened 70

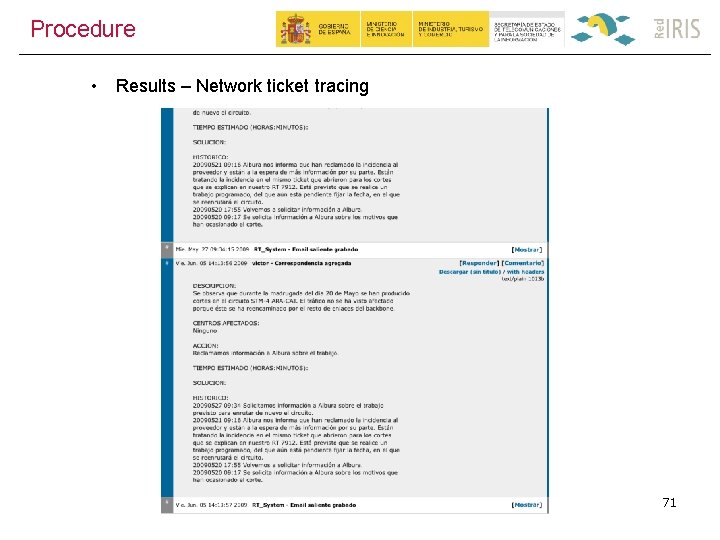
Procedure • Results – Network ticket tracing 71

Questions ? 72