
Recognition The Margaret Thatcher Illusion by Peter Thompson
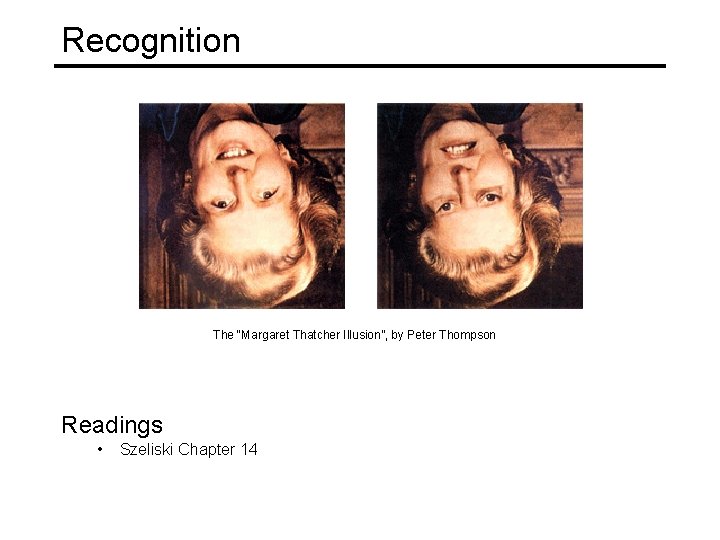
Recognition The “Margaret Thatcher Illusion”, by Peter Thompson Readings • Szeliski Chapter 14
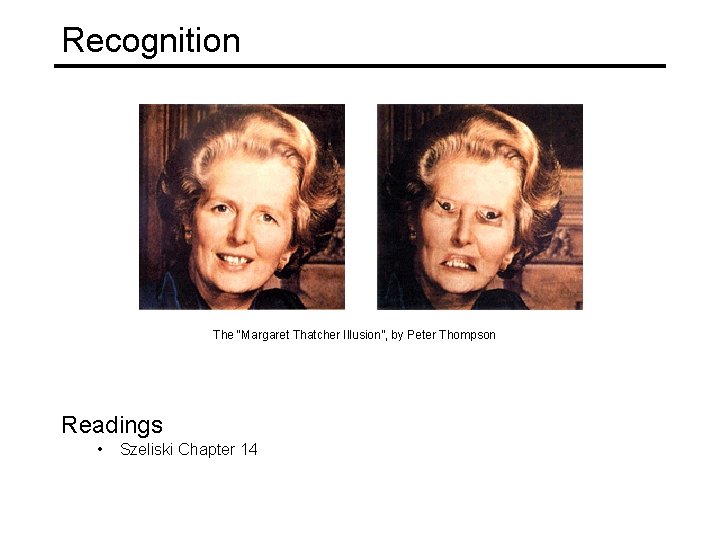
Recognition The “Margaret Thatcher Illusion”, by Peter Thompson Readings • Szeliski Chapter 14

What do we mean by “object recognition”? Next 15 slides adapted from Li, Fergus, & Torralba’s excellent short course on category and object recognition
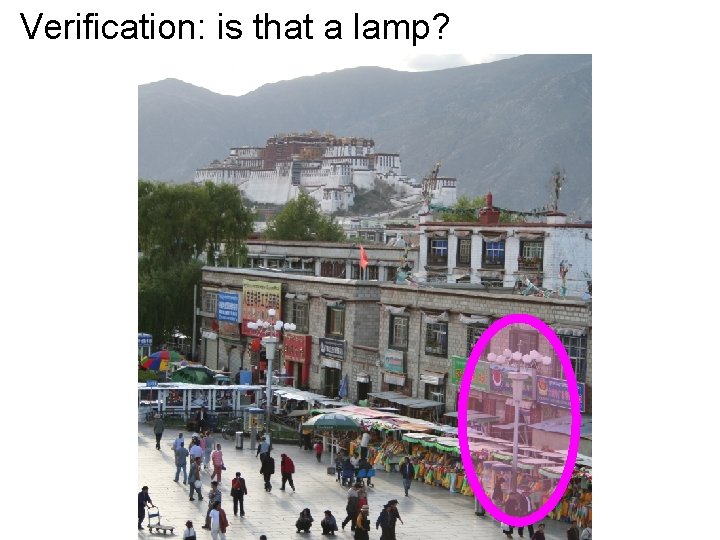
Verification: is that a lamp?
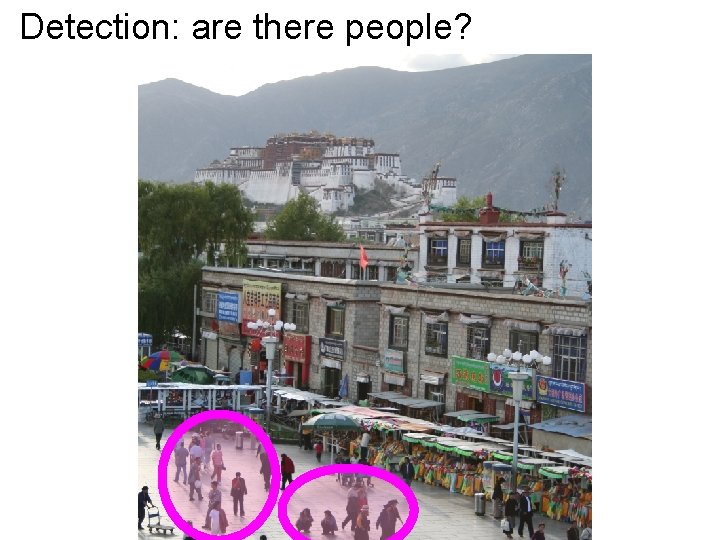
Detection: are there people?
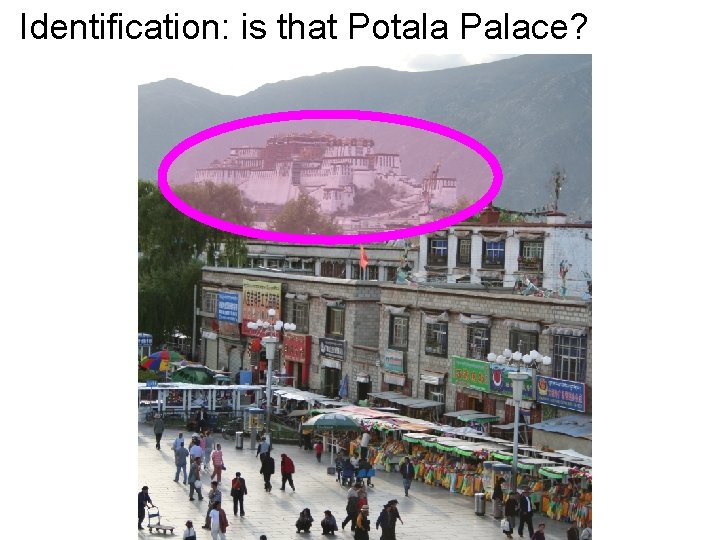
Identification: is that Potala Palace?
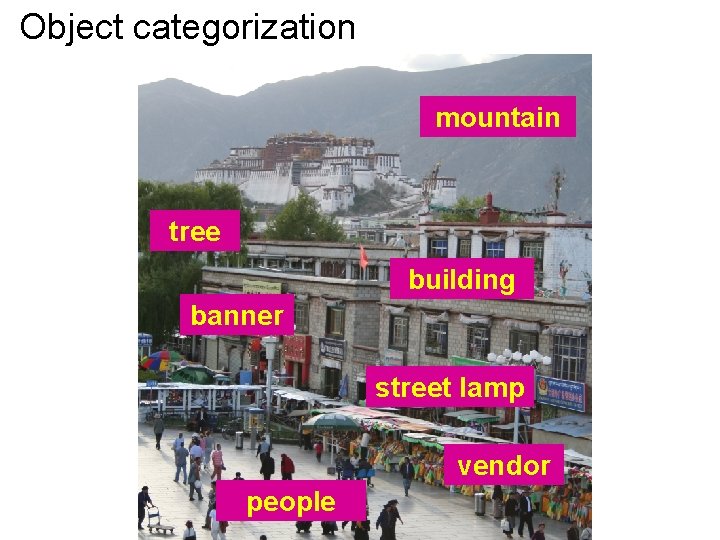
Object categorization mountain tree building banner street lamp vendor people
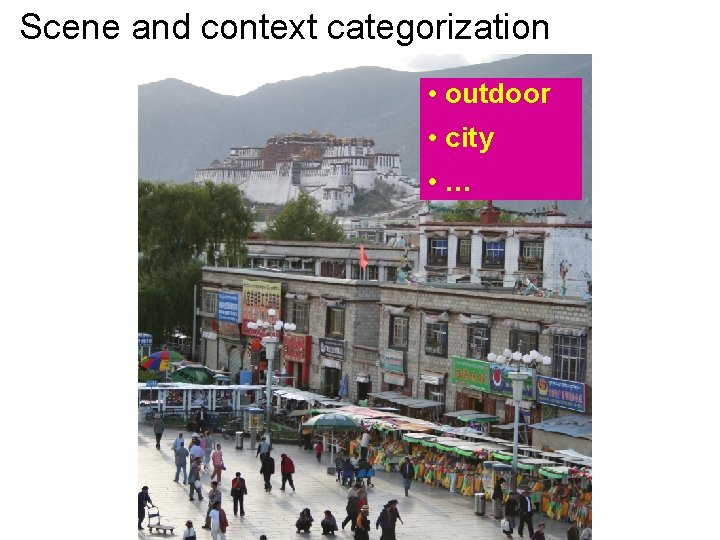
Scene and context categorization • outdoor • city • …
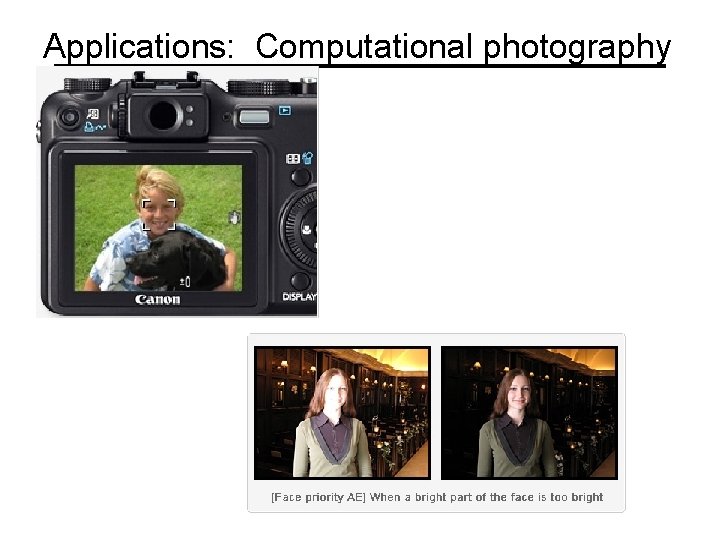
Applications: Computational photography
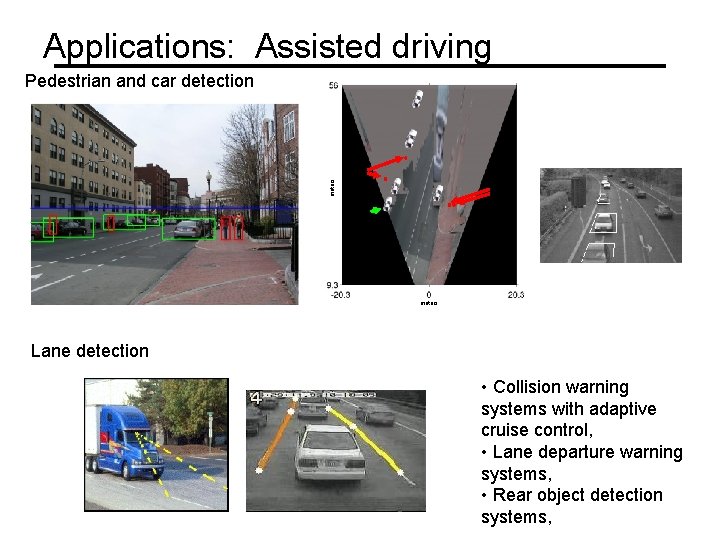
Applications: Assisted driving Pedestrian and car detection meters Ped Car meters Lane detection • Collision warning systems with adaptive cruise control, • Lane departure warning systems, • Rear object detection systems,
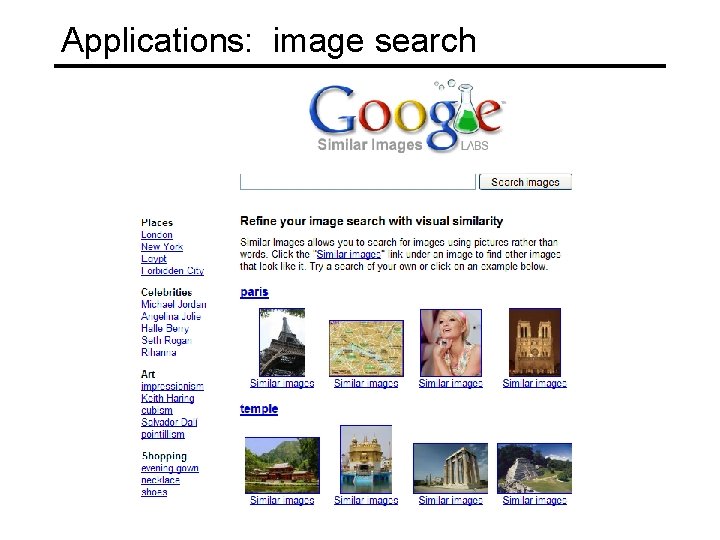
Applications: image search
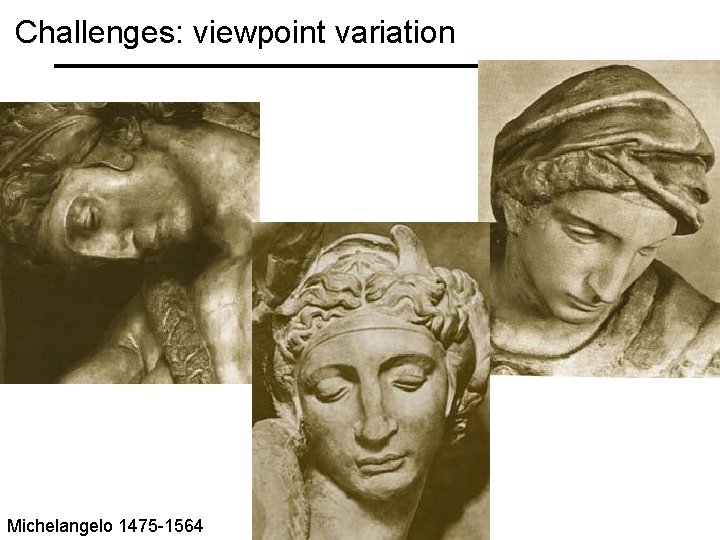
Challenges: viewpoint variation Michelangelo 1475 -1564
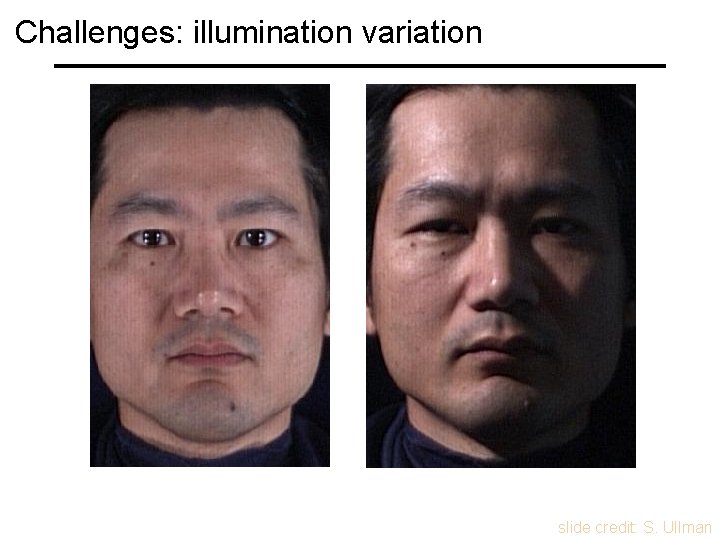
Challenges: illumination variation slide credit: S. Ullman
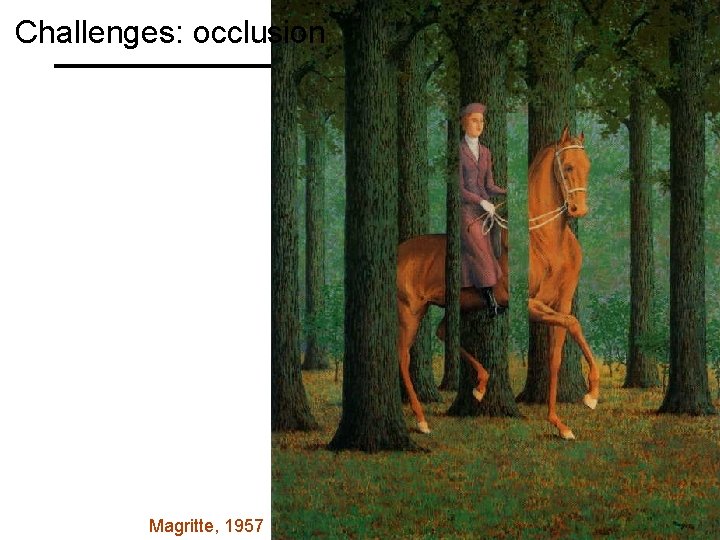
Challenges: occlusion Magritte, 1957
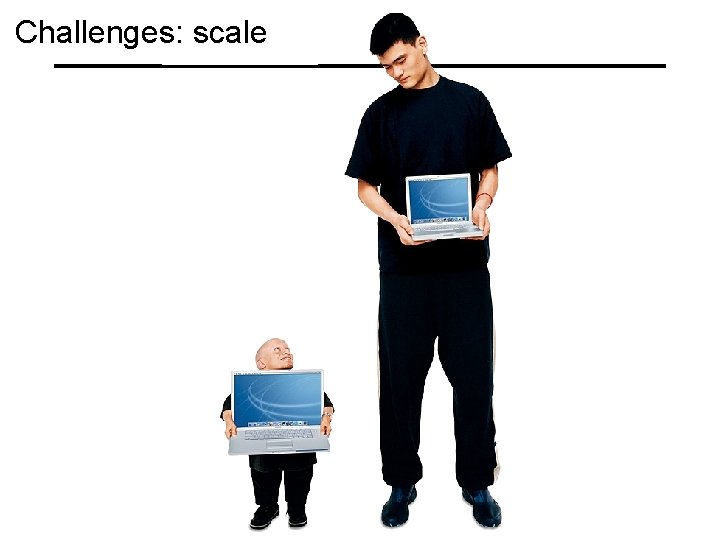
Challenges: scale
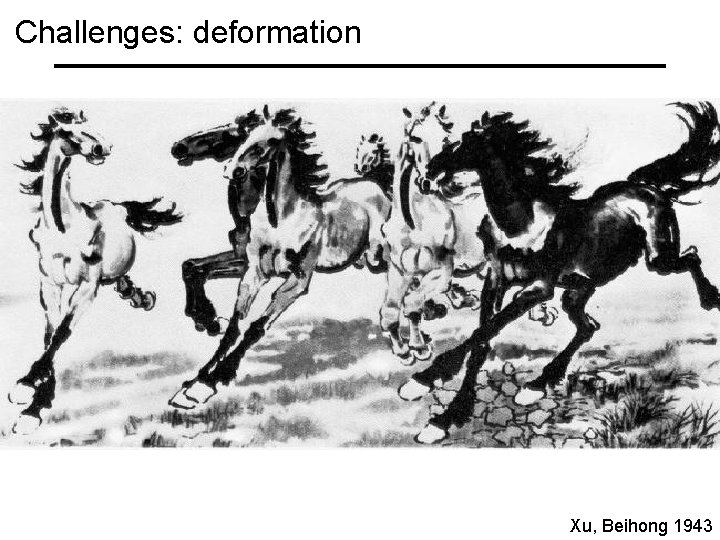
Challenges: deformation Xu, Beihong 1943
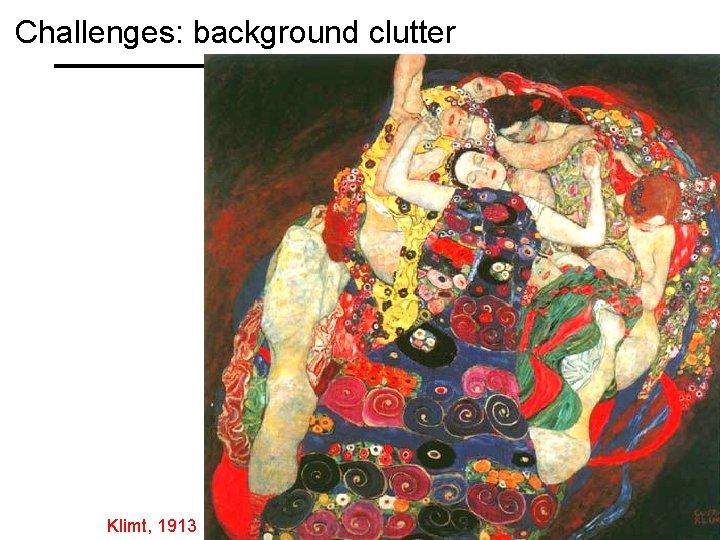
Challenges: background clutter Klimt, 1913
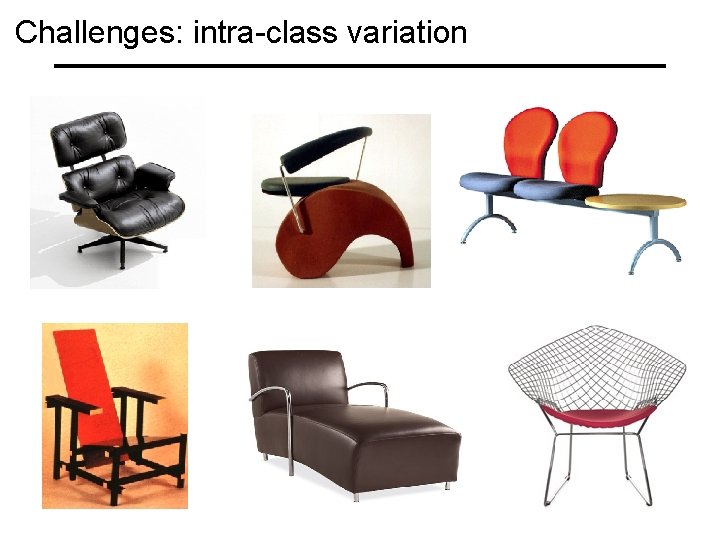
Challenges: intra-class variation
Let’s start simple Today • skin detection • eigenfaces • face detection with adaboost
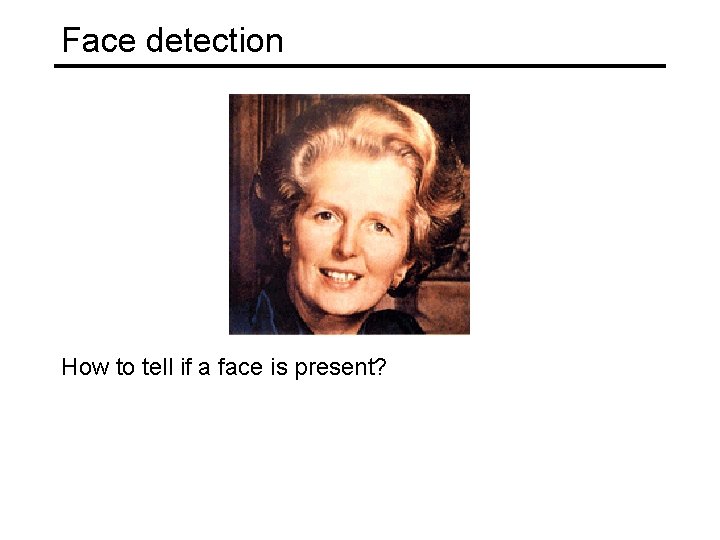
Face detection How to tell if a face is present?
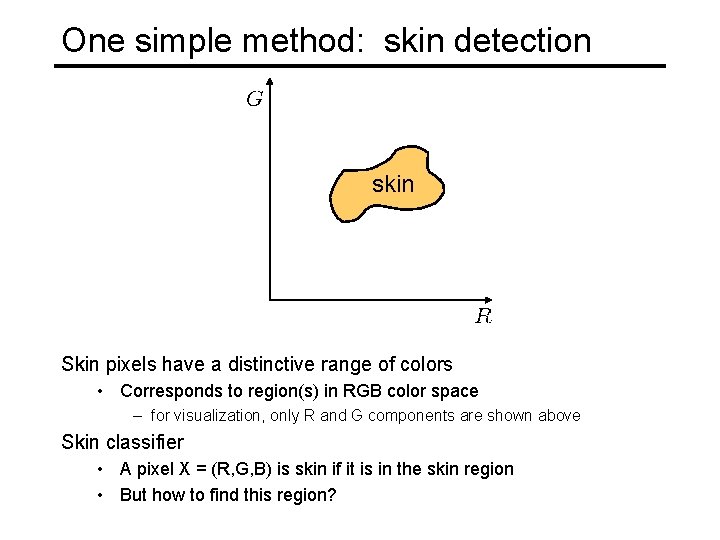
One simple method: skin detection skin Skin pixels have a distinctive range of colors • Corresponds to region(s) in RGB color space – for visualization, only R and G components are shown above Skin classifier • A pixel X = (R, G, B) is skin if it is in the skin region • But how to find this region?
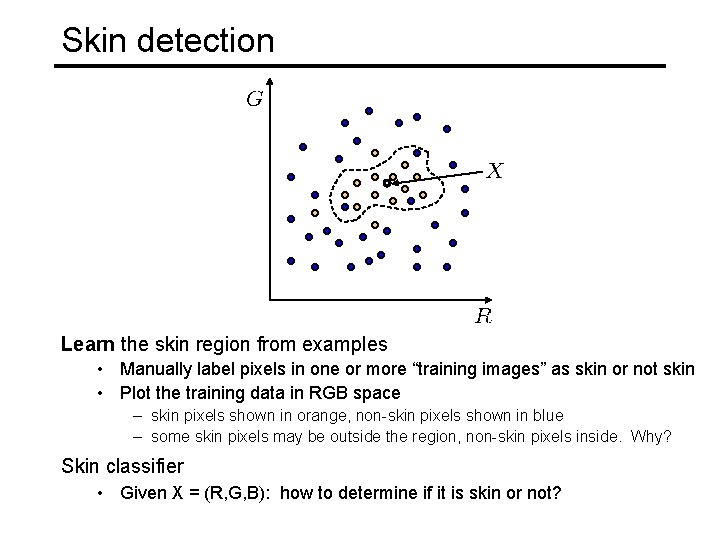
Skin detection Learn the skin region from examples • Manually label pixels in one or more “training images” as skin or not skin • Plot the training data in RGB space – skin pixels shown in orange, non-skin pixels shown in blue – some skin pixels may be outside the region, non-skin pixels inside. Why? Skin classifier • Given X = (R, G, B): how to determine if it is skin or not?
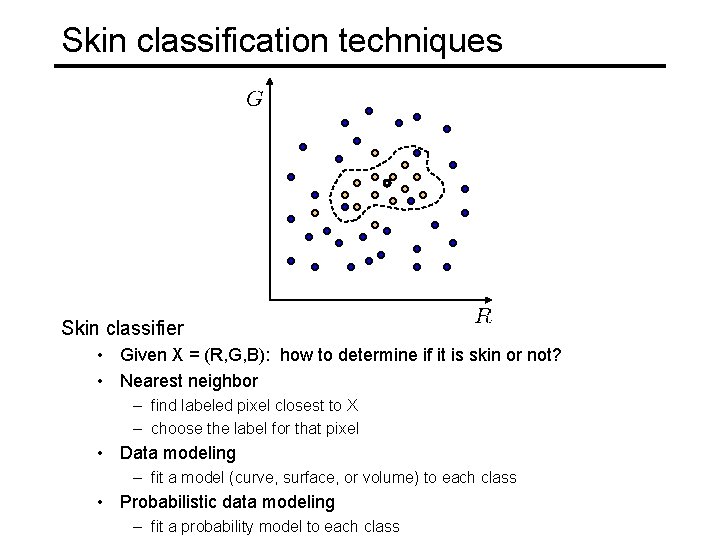
Skin classification techniques Skin classifier • Given X = (R, G, B): how to determine if it is skin or not? • Nearest neighbor – find labeled pixel closest to X – choose the label for that pixel • Data modeling – fit a model (curve, surface, or volume) to each class • Probabilistic data modeling – fit a probability model to each class
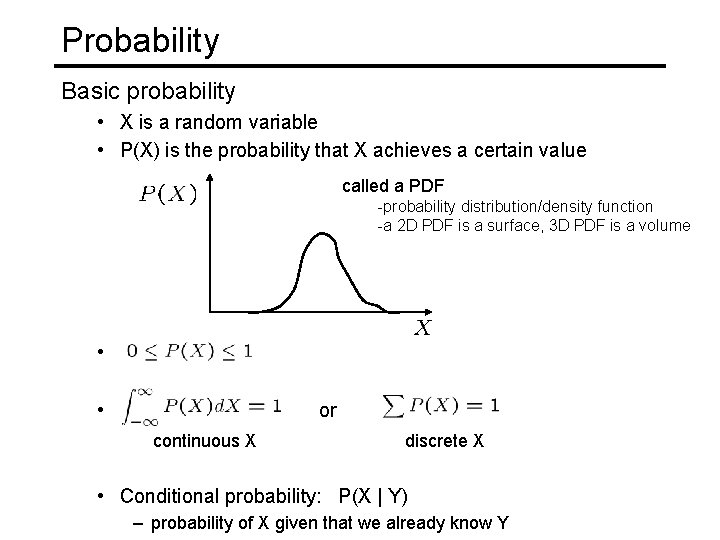
Probability Basic probability • X is a random variable • P(X) is the probability that X achieves a certain value called a PDF -probability distribution/density function -a 2 D PDF is a surface, 3 D PDF is a volume • • or continuous X discrete X • Conditional probability: P(X | Y) – probability of X given that we already know Y
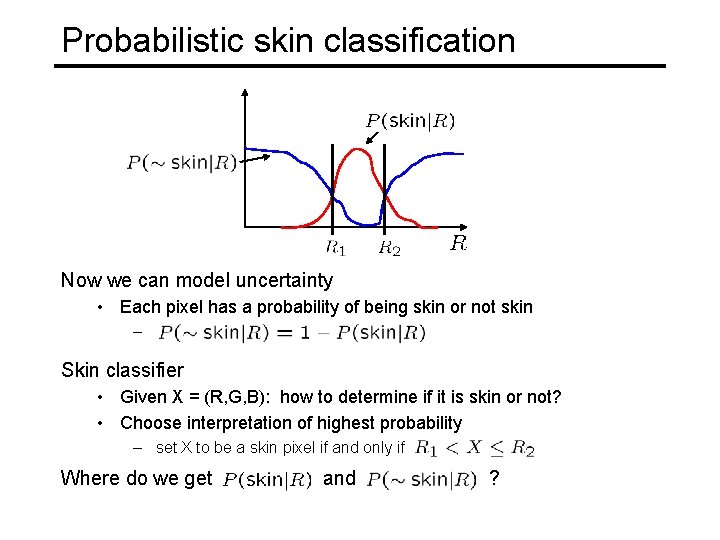
Probabilistic skin classification Now we can model uncertainty • Each pixel has a probability of being skin or not skin – Skin classifier • Given X = (R, G, B): how to determine if it is skin or not? • Choose interpretation of highest probability – set X to be a skin pixel if and only if Where do we get and ?
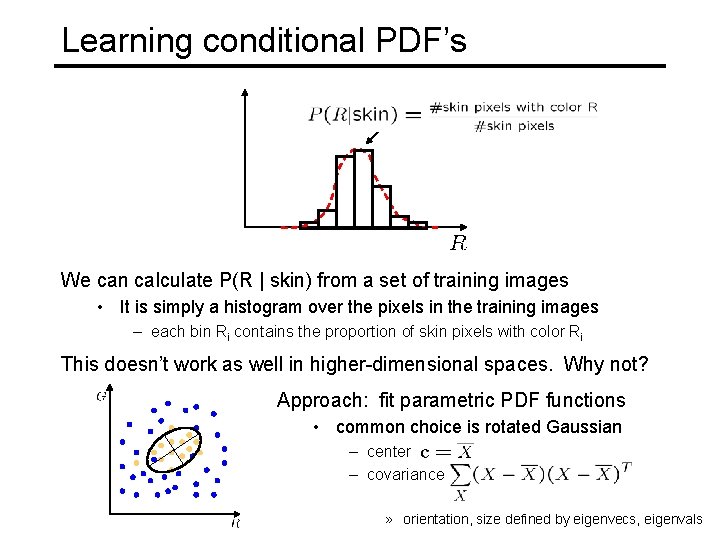
Learning conditional PDF’s We can calculate P(R | skin) from a set of training images • It is simply a histogram over the pixels in the training images – each bin Ri contains the proportion of skin pixels with color Ri This doesn’t work as well in higher-dimensional spaces. Why not? Approach: fit parametric PDF functions • common choice is rotated Gaussian – center – covariance » orientation, size defined by eigenvecs, eigenvals
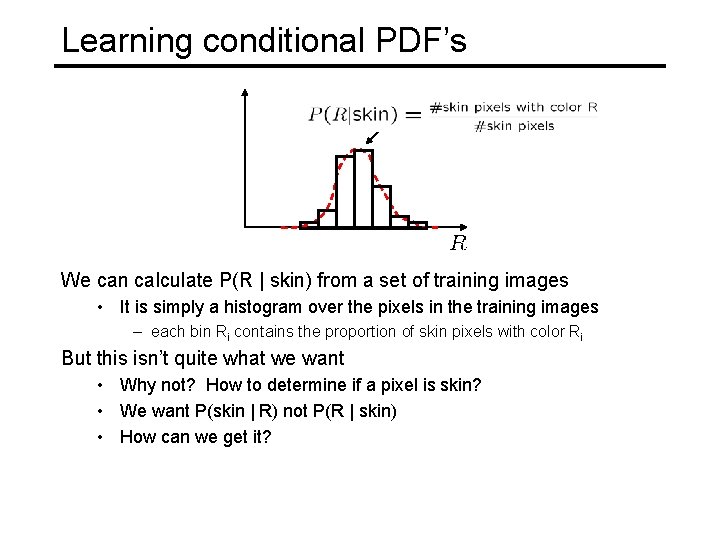
Learning conditional PDF’s We can calculate P(R | skin) from a set of training images • It is simply a histogram over the pixels in the training images – each bin Ri contains the proportion of skin pixels with color Ri But this isn’t quite what we want • Why not? How to determine if a pixel is skin? • We want P(skin | R) not P(R | skin) • How can we get it?
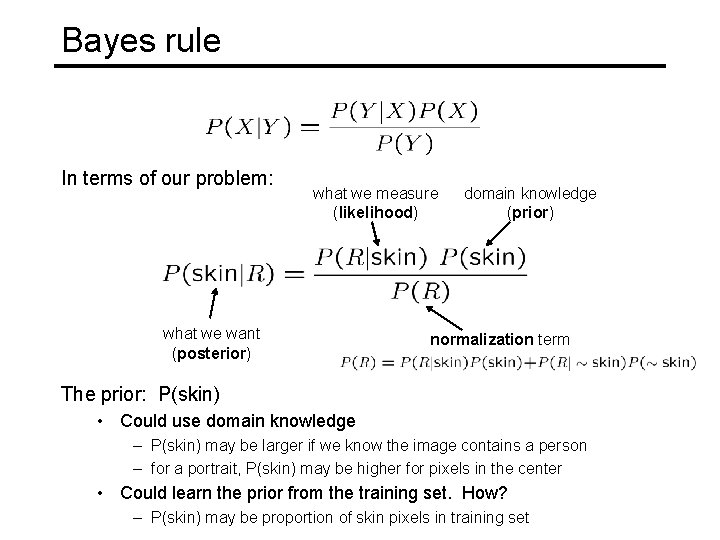
Bayes rule In terms of our problem: what we measure (likelihood) what we want (posterior) domain knowledge (prior) normalization term The prior: P(skin) • Could use domain knowledge – P(skin) may be larger if we know the image contains a person – for a portrait, P(skin) may be higher for pixels in the center • Could learn the prior from the training set. How? – P(skin) may be proportion of skin pixels in training set
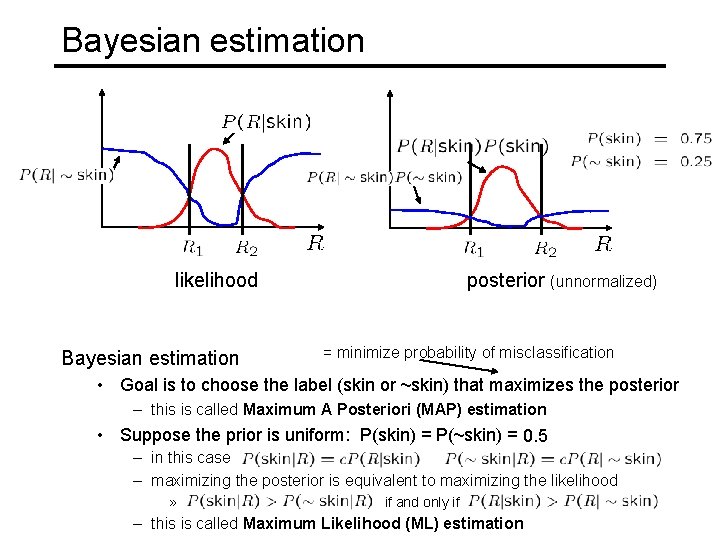
Bayesian estimation likelihood Bayesian estimation posterior (unnormalized) = minimize probability of misclassification • Goal is to choose the label (skin or ~skin) that maximizes the posterior – this is called Maximum A Posteriori (MAP) estimation • Suppose the prior is uniform: P(skin) = P(~skin) = 0. 5 – in this case , – maximizing the posterior is equivalent to maximizing the likelihood » if and only if – this is called Maximum Likelihood (ML) estimation
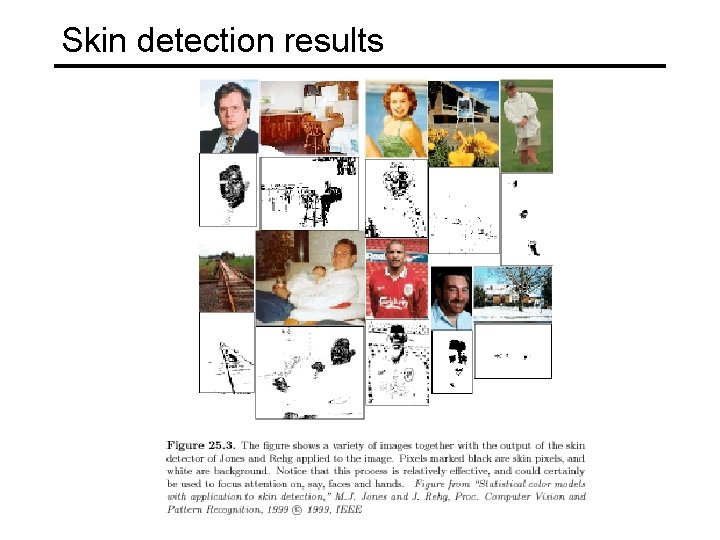
Skin detection results
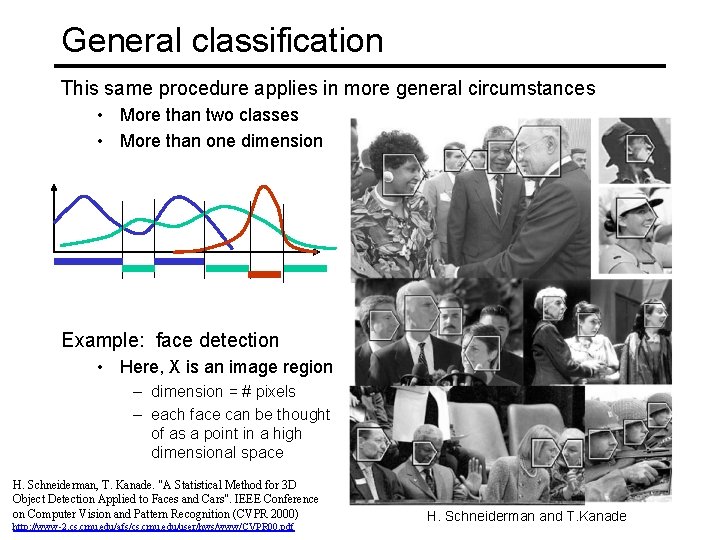
General classification This same procedure applies in more general circumstances • More than two classes • More than one dimension Example: face detection • Here, X is an image region – dimension = # pixels – each face can be thought of as a point in a high dimensional space H. Schneiderman, T. Kanade. "A Statistical Method for 3 D Object Detection Applied to Faces and Cars". IEEE Conference on Computer Vision and Pattern Recognition (CVPR 2000) http: //www-2. cs. cmu. edu/afs/cs. cmu. edu/user/hws/www/CVPR 00. pdf H. Schneiderman and T. Kanade
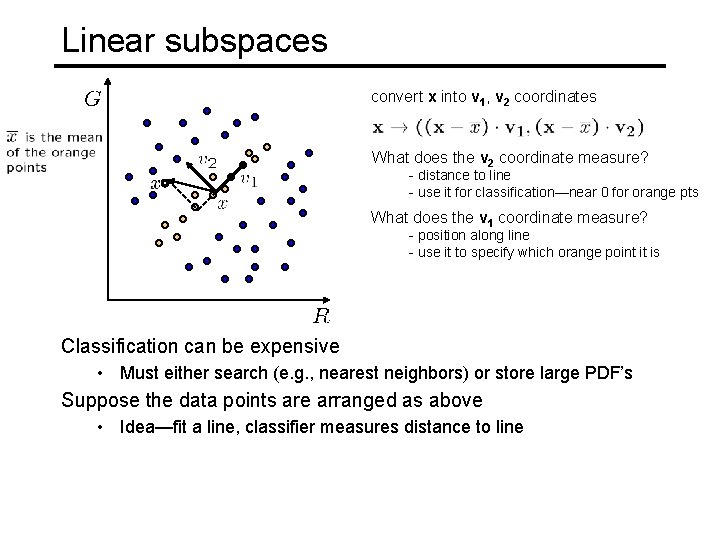
Linear subspaces convert x into v 1, v 2 coordinates What does the v 2 coordinate measure? - distance to line - use it for classification—near 0 for orange pts What does the v 1 coordinate measure? - position along line - use it to specify which orange point it is Classification can be expensive • Must either search (e. g. , nearest neighbors) or store large PDF’s Suppose the data points are arranged as above • Idea—fit a line, classifier measures distance to line
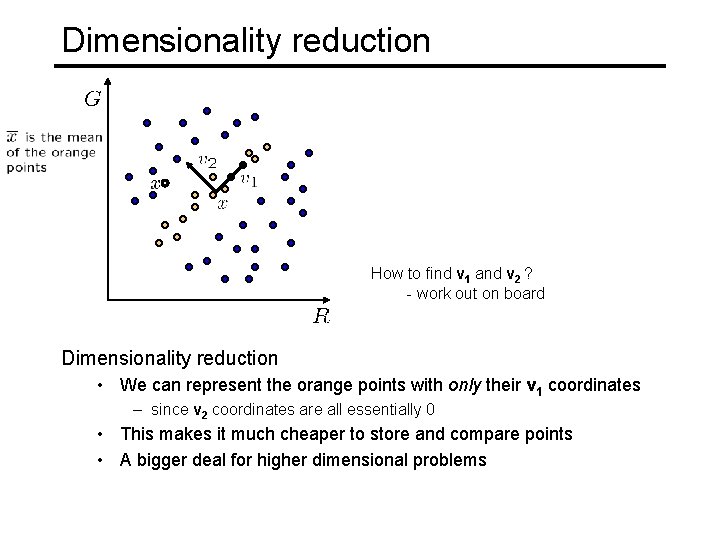
Dimensionality reduction How to find v 1 and v 2 ? - work out on board Dimensionality reduction • We can represent the orange points with only their v 1 coordinates – since v 2 coordinates are all essentially 0 • This makes it much cheaper to store and compare points • A bigger deal for higher dimensional problems
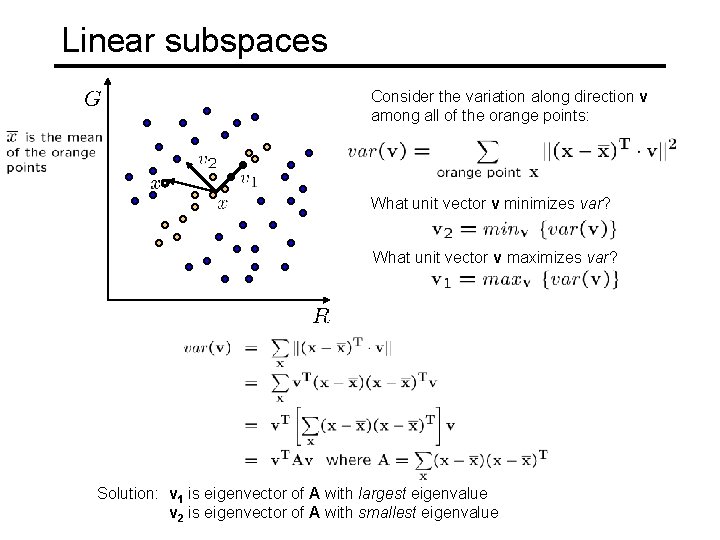
Linear subspaces Consider the variation along direction v among all of the orange points: What unit vector v minimizes var? What unit vector v maximizes var? Solution: v 1 is eigenvector of A with largest eigenvalue v 2 is eigenvector of A with smallest eigenvalue
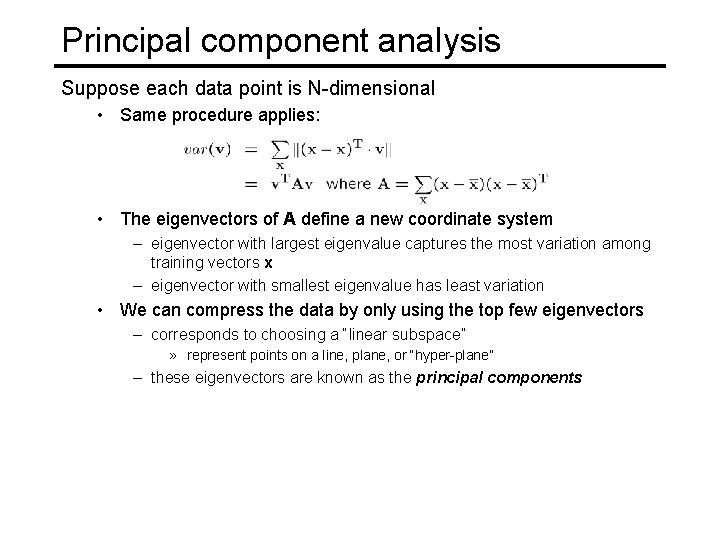
Principal component analysis Suppose each data point is N-dimensional • Same procedure applies: • The eigenvectors of A define a new coordinate system – eigenvector with largest eigenvalue captures the most variation among training vectors x – eigenvector with smallest eigenvalue has least variation • We can compress the data by only using the top few eigenvectors – corresponds to choosing a “linear subspace” » represent points on a line, plane, or “hyper-plane” – these eigenvectors are known as the principal components
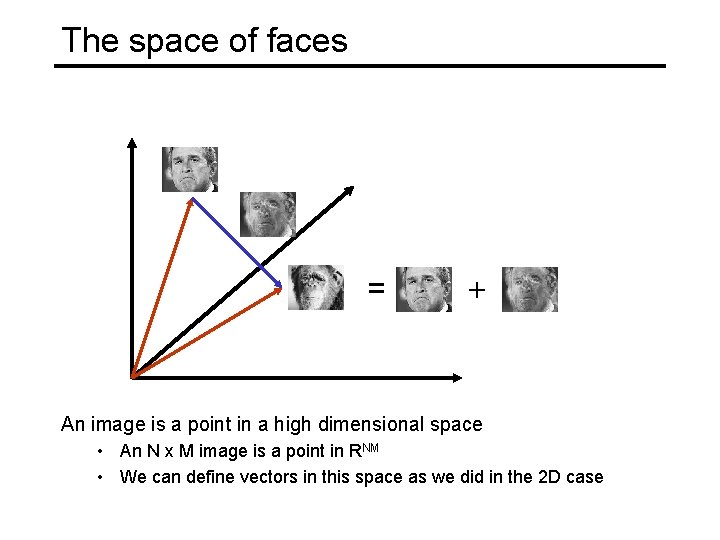
The space of faces = + An image is a point in a high dimensional space • An N x M image is a point in RNM • We can define vectors in this space as we did in the 2 D case
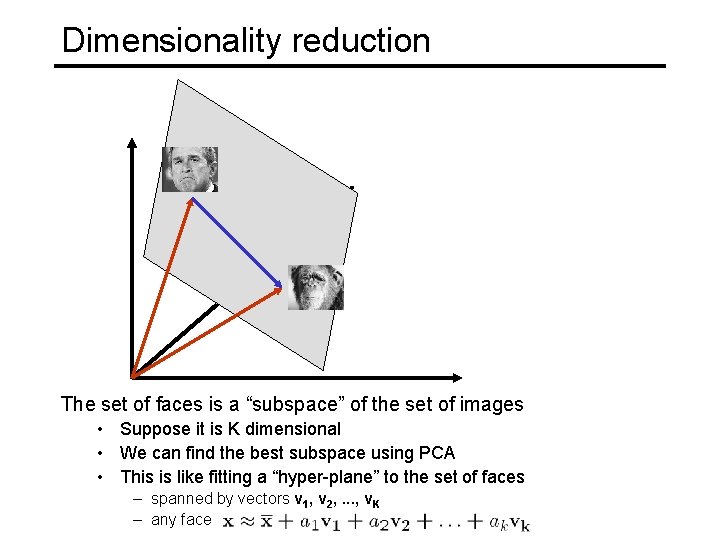
Dimensionality reduction The set of faces is a “subspace” of the set of images • Suppose it is K dimensional • We can find the best subspace using PCA • This is like fitting a “hyper-plane” to the set of faces – spanned by vectors v 1, v 2, . . . , v. K – any face
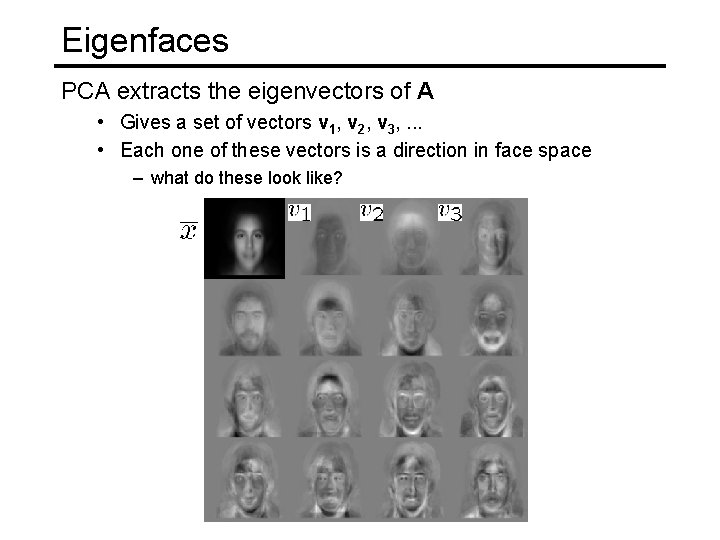
Eigenfaces PCA extracts the eigenvectors of A • Gives a set of vectors v 1, v 2, v 3, . . . • Each one of these vectors is a direction in face space – what do these look like?
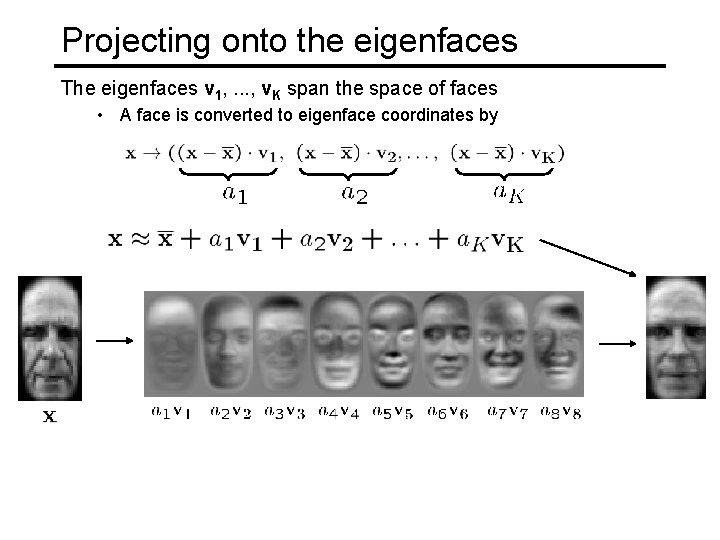
Projecting onto the eigenfaces The eigenfaces v 1, . . . , v. K span the space of faces • A face is converted to eigenface coordinates by
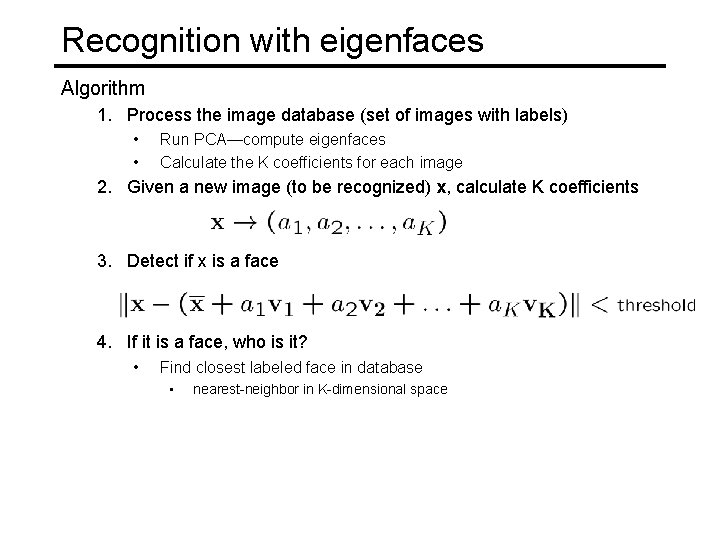
Recognition with eigenfaces Algorithm 1. Process the image database (set of images with labels) • • Run PCA—compute eigenfaces Calculate the K coefficients for each image 2. Given a new image (to be recognized) x, calculate K coefficients 3. Detect if x is a face 4. If it is a face, who is it? • Find closest labeled face in database • nearest-neighbor in K-dimensional space
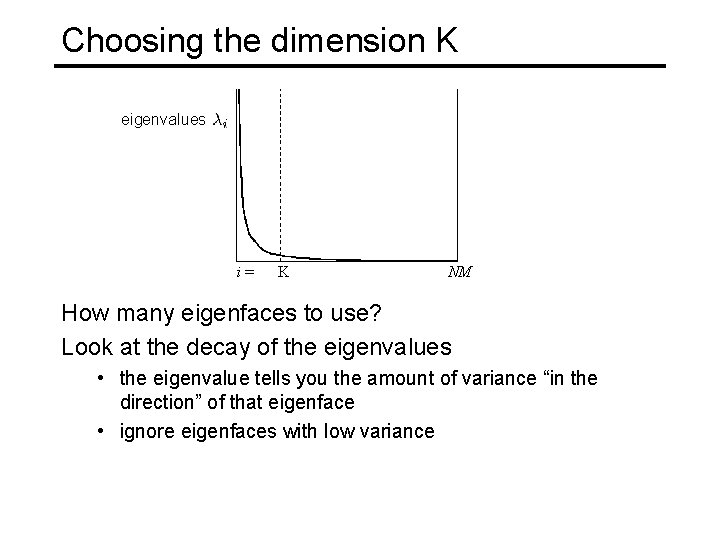
Choosing the dimension K eigenvalues i= K NM How many eigenfaces to use? Look at the decay of the eigenvalues • the eigenvalue tells you the amount of variance “in the direction” of that eigenface • ignore eigenfaces with low variance
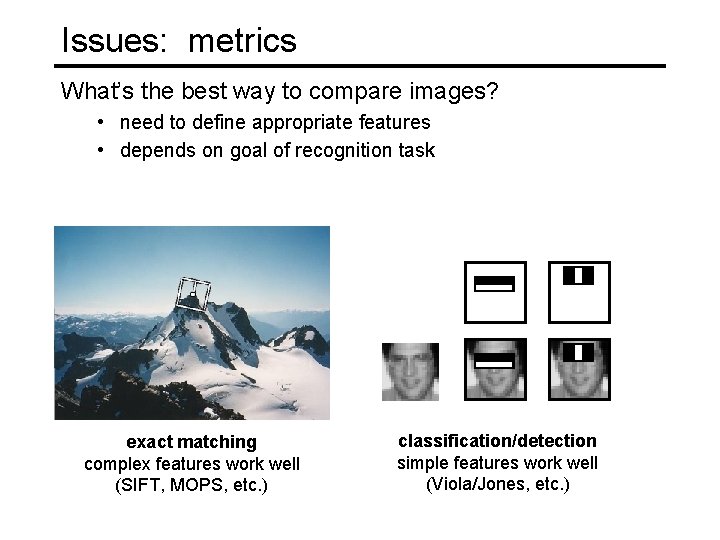
Issues: metrics What’s the best way to compare images? • need to define appropriate features • depends on goal of recognition task exact matching complex features work well (SIFT, MOPS, etc. ) classification/detection simple features work well (Viola/Jones, etc. )
Metrics Lots more feature types that we haven’t mentioned • moments, statistics – metrics: Earth mover’s distance, . . . • edges, curves – metrics: Hausdorff, shape context, . . . • 3 D: surfaces, spin images – metrics: chamfer (ICP) • . . .
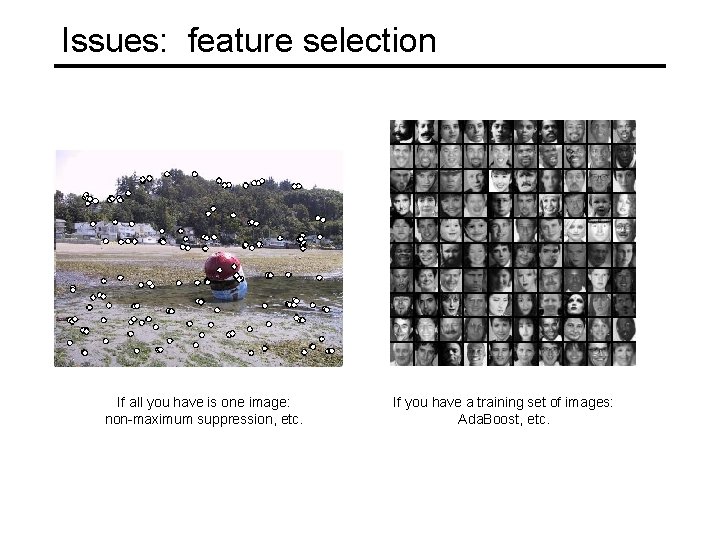
Issues: feature selection If all you have is one image: non-maximum suppression, etc. If you have a training set of images: Ada. Boost, etc.
Issues: data modeling Generative methods • model the “shape” of each class – histograms, PCA, mixtures of Gaussians – graphical models (HMM’s, belief networks, etc. ) –. . . Discriminative methods • model boundaries between classes – perceptrons, neural networks – support vector machines (SVM’s)
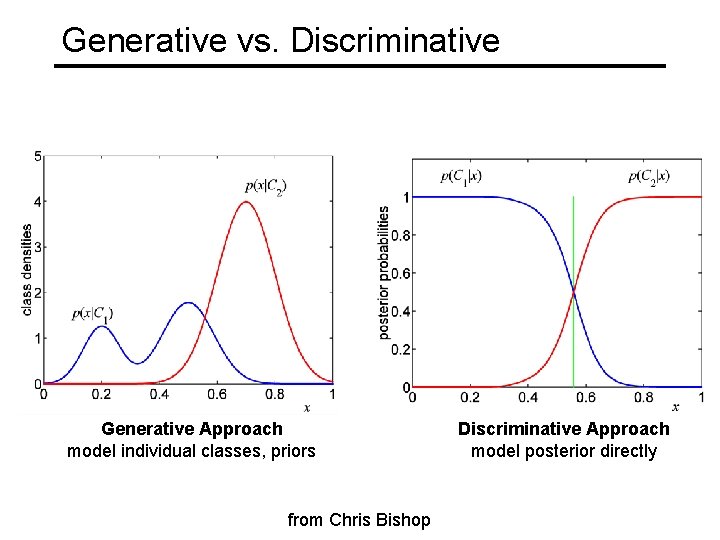
Generative vs. Discriminative Generative Approach model individual classes, priors from Chris Bishop Discriminative Approach model posterior directly
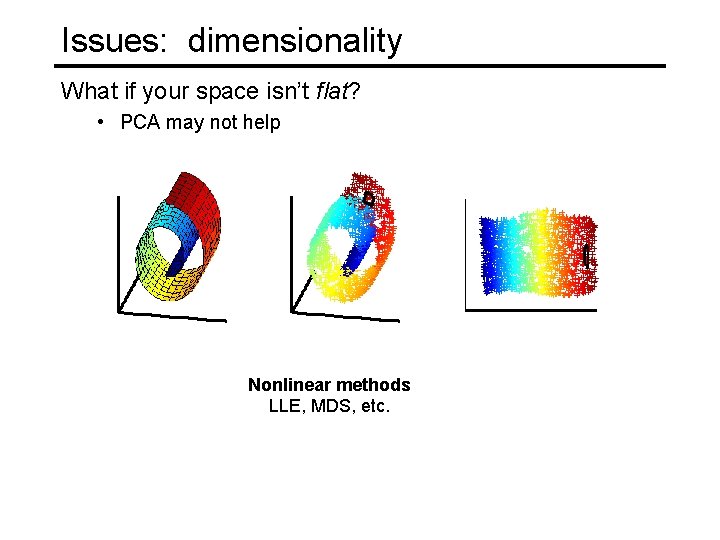
Issues: dimensionality What if your space isn’t flat? • PCA may not help Nonlinear methods LLE, MDS, etc.
Issues: speed Case study: Viola Jones face detector Next few slides adapted Grauman & Liebe’s tutorial • http: //www. vision. ee. ethz. ch/~bleibe/teaching/tutorial-aaai 08/ Also see Paul Viola’s talk (video) • http: //www. cs. washington. edu/education/courses/577/04 sp/contents. html#DM
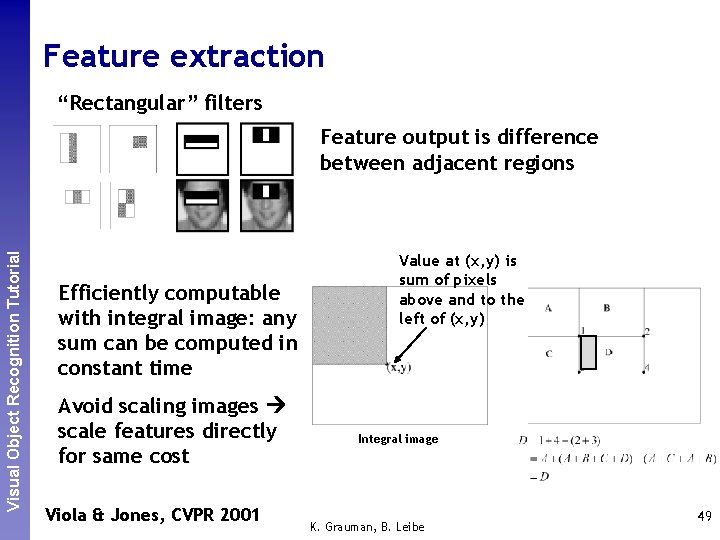
Feature extraction Perceptual and. Recognition Sensory Augmented Visual Object Tutorial Computing “Rectangular” filters Feature output is difference between adjacent regions Efficiently computable with integral image: any sum can be computed in constant time Avoid scaling images scale features directly for same cost Viola & Jones, CVPR 2001 Value at (x, y) is sum of pixels above and to the left of (x, y) Integral image K. Grauman, B. Leibe 49
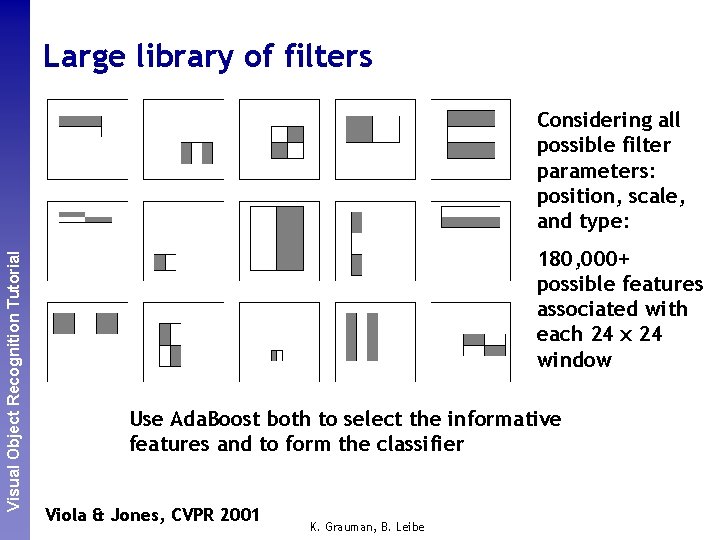
Perceptual and. Recognition Sensory Augmented Visual Object Tutorial Computing Large library of filters Considering all possible filter parameters: position, scale, and type: 180, 000+ possible features associated with each 24 x 24 window Use Ada. Boost both to select the informative features and to form the classifier Viola & Jones, CVPR 2001 K. Grauman, B. Leibe
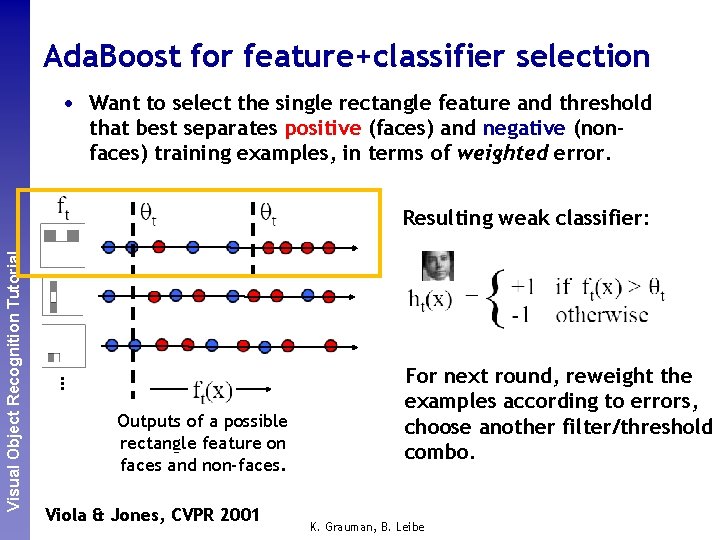
Ada. Boost for feature+classifier selection that best separates positive (faces) and negative (nonfaces) training examples, in terms of weighted error. Resulting weak classifier: … Perceptual and. Recognition Sensory Augmented Visual Object Tutorial Computing • Want to select the single rectangle feature and threshold Outputs of a possible rectangle feature on faces and non-faces. Viola & Jones, CVPR 2001 For next round, reweight the examples according to errors, choose another filter/threshold combo. K. Grauman, B. Leibe
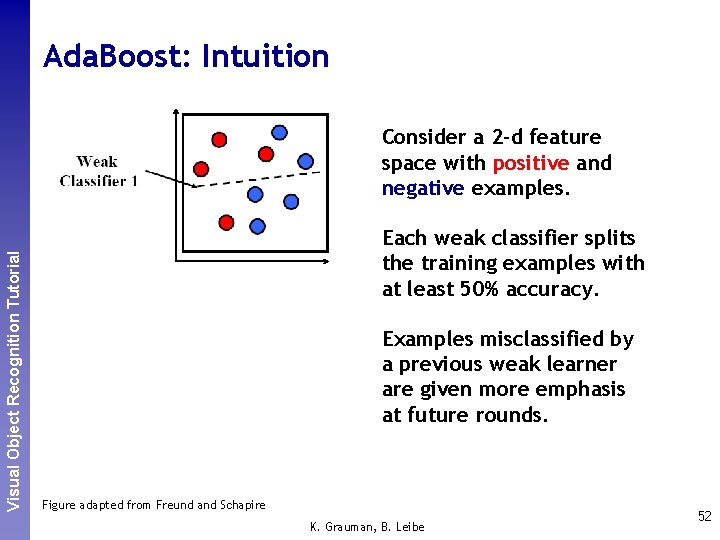
Perceptual and. Recognition Sensory Augmented Visual Object Tutorial Computing Ada. Boost: Intuition Consider a 2 -d feature space with positive and negative examples. Each weak classifier splits the training examples with at least 50% accuracy. Examples misclassified by a previous weak learner are given more emphasis at future rounds. Figure adapted from Freund and Schapire K. Grauman, B. Leibe 52
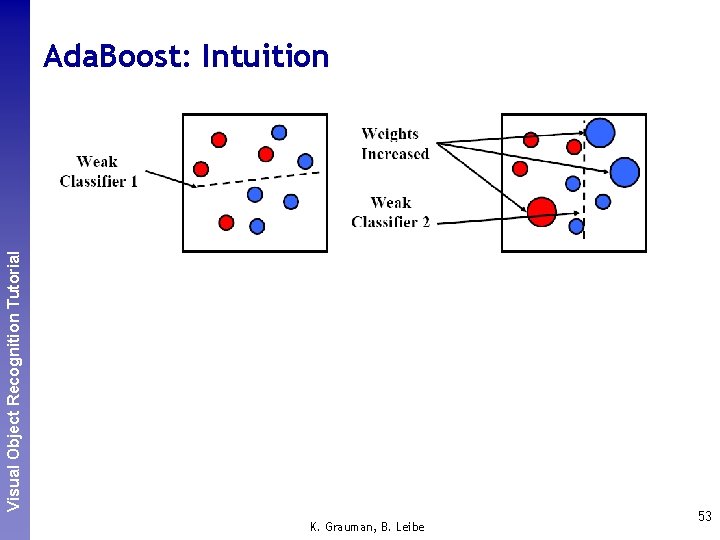
Perceptual and. Recognition Sensory Augmented Visual Object Tutorial Computing Ada. Boost: Intuition K. Grauman, B. Leibe 53
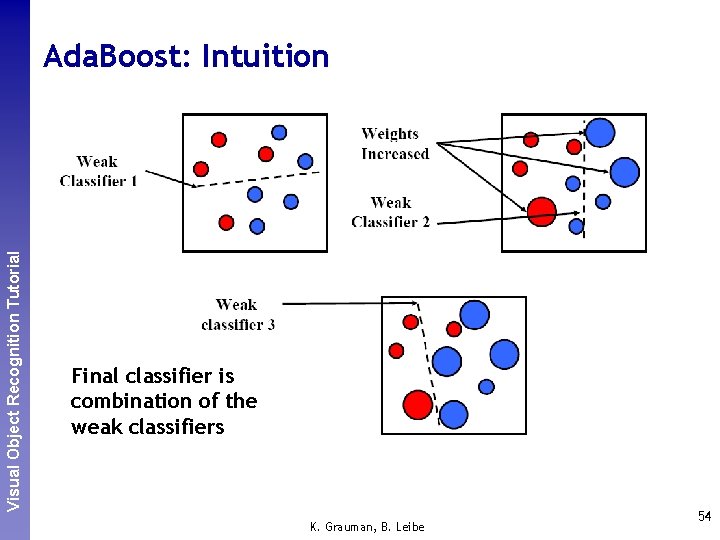
Perceptual and. Recognition Sensory Augmented Visual Object Tutorial Computing Ada. Boost: Intuition Final classifier is combination of the weak classifiers K. Grauman, B. Leibe 54
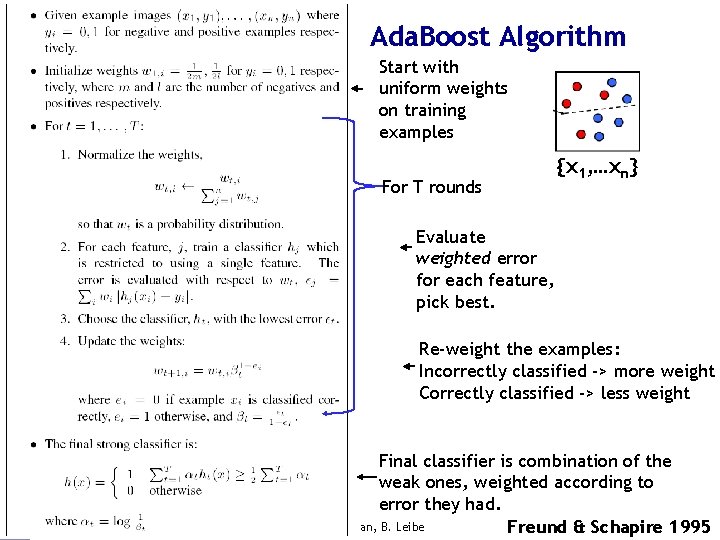
Ada. Boost Algorithm Perceptual and. Recognition Sensory Augmented Visual Object Tutorial Computing Start with uniform weights on training examples For T rounds {x 1, …xn} Evaluate weighted error for each feature, pick best. Re-weight the examples: Incorrectly classified -> more weight Correctly classified -> less weight Final classifier is combination of the weak ones, weighted according to error they had. K. Grauman, B. Leibe Freund & Schapire 1995
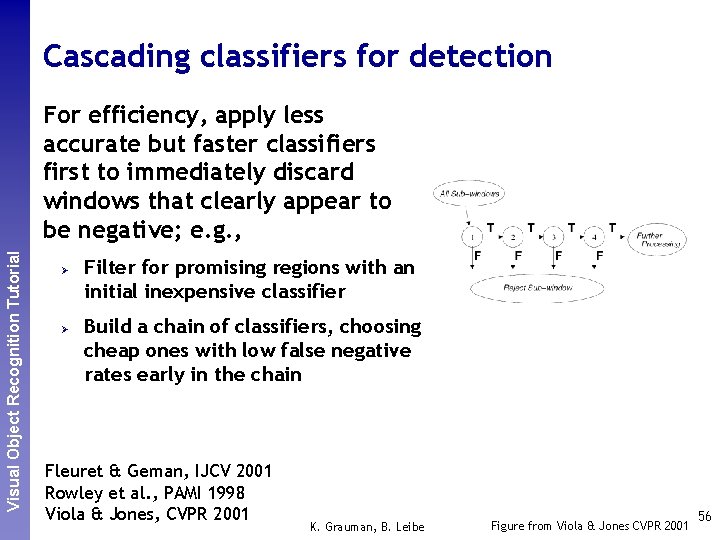
Perceptual and. Recognition Sensory Augmented Visual Object Tutorial Computing Cascading classifiers for detection For efficiency, apply less accurate but faster classifiers first to immediately discard windows that clearly appear to be negative; e. g. , Ø Ø Filter for promising regions with an initial inexpensive classifier Build a chain of classifiers, choosing cheap ones with low false negative rates early in the chain Fleuret & Geman, IJCV 2001 Rowley et al. , PAMI 1998 Viola & Jones, CVPR 2001 K. Grauman, B. Leibe Figure from Viola & Jones CVPR 2001 56
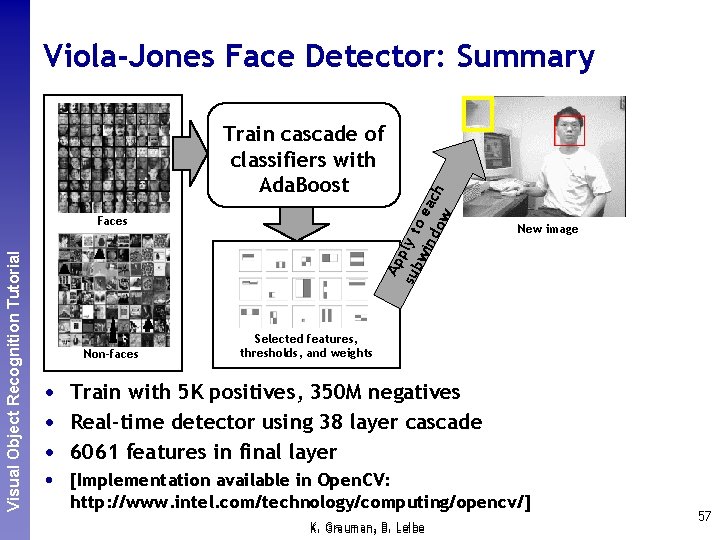
Train cascade of classifiers with Ada. Boost Ap sub ply t wi o ea nd ow ch Perceptual and. Recognition Sensory Augmented Visual Object Tutorial Computing Viola-Jones Face Detector: Summary Faces Non-faces New image Selected features, thresholds, and weights • Train with 5 K positives, 350 M negatives • Real-time detector using 38 layer cascade • 6061 features in final layer • [Implementation available in Open. CV: http: //www. intel. com/technology/computing/opencv/] K. Grauman, B. Leibe 57
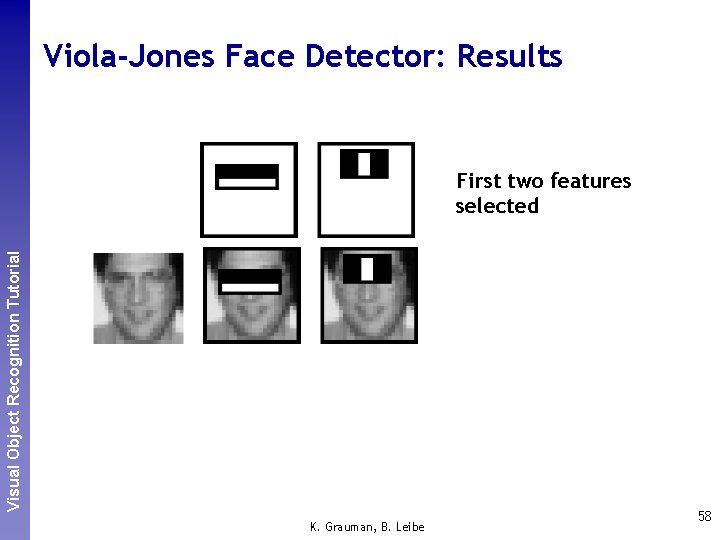
Perceptual and. Recognition Sensory Augmented Visual Object Tutorial Computing Viola-Jones Face Detector: Results First two features selected K. Grauman, B. Leibe 58
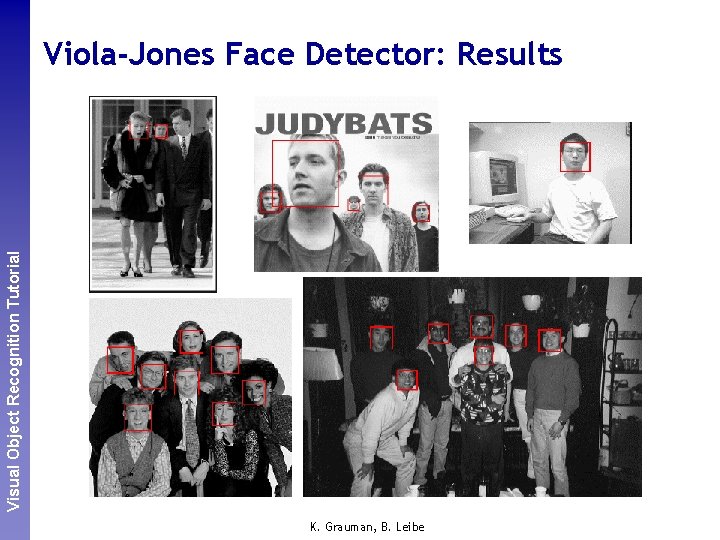
Perceptual and. Recognition Sensory Augmented Visual Object Tutorial Computing Viola-Jones Face Detector: Results K. Grauman, B. Leibe
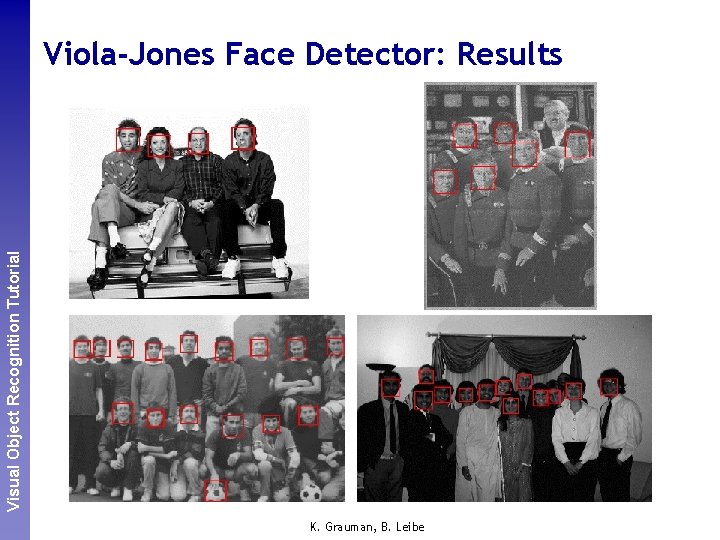
Perceptual and. Recognition Sensory Augmented Visual Object Tutorial Computing Viola-Jones Face Detector: Results K. Grauman, B. Leibe
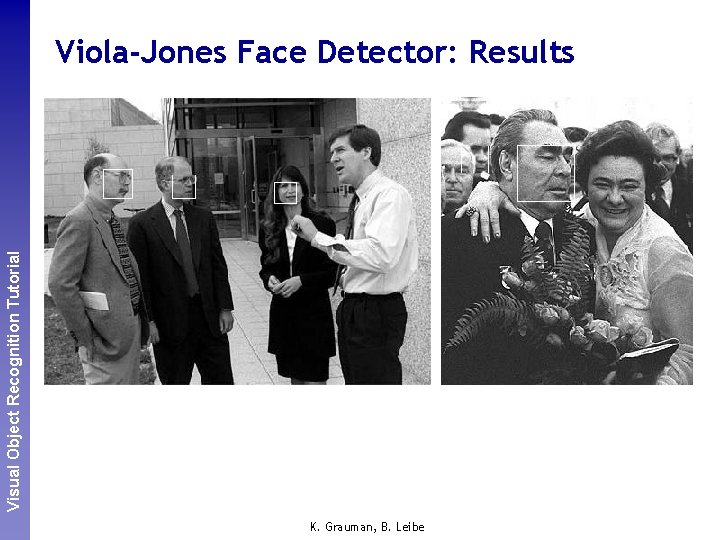
Perceptual and. Recognition Sensory Augmented Visual Object Tutorial Computing Viola-Jones Face Detector: Results K. Grauman, B. Leibe
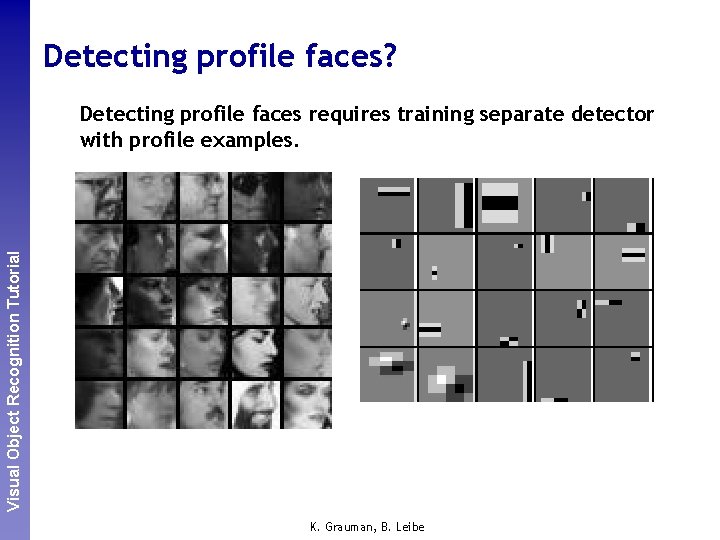
Detecting profile faces? Perceptual and. Recognition Sensory Augmented Visual Object Tutorial Computing Detecting profile faces requires training separate detector with profile examples. K. Grauman, B. Leibe
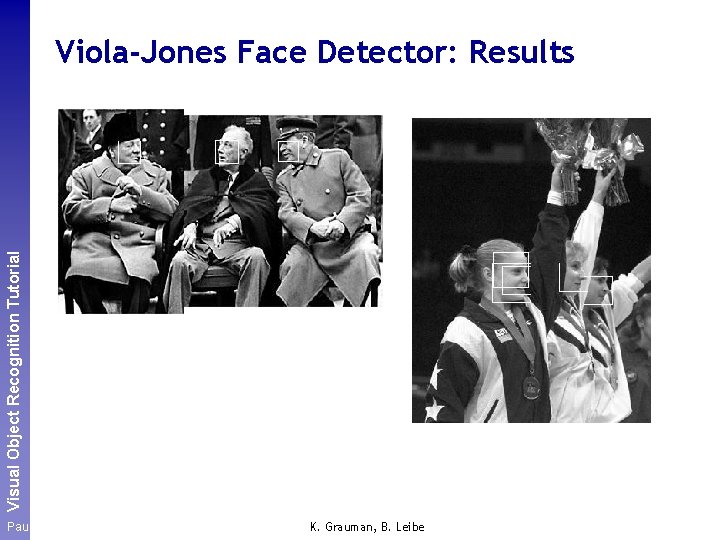
Perceptual and. Recognition Sensory Augmented Visual Object Tutorial Computing Viola-Jones Face Detector: Results Paul Viola, ICCV tutorial K. Grauman, B. Leibe
- Slides: 63