Recent Trends in Beam Size Measurement Using the

Recent Trends in Beam Size Measurement Using the Spatial Coherence of Visible Synchrotron Radiation Toshiyuki MITSUHASHI KEK

Agenda of talk 1. Simple imaging system for beam profile measurement. 2. Profile and size measurement via spatial coherence 3. SR interferometer 4. Theoretical resolution and error transfer 5. Measurement of vertical small beam size
 7.")
6. Measurement of horizontal beam size The incoherent depth of field effect (IDOF) 7. Application of interferometry for the beam size measurement in the LHC

1. Simple imaging system for beam profile measurement. Band-pass filter Entrance aperture Magnification lens Aberration-free lens Achromat or Apochromat f=500 to 1000 mm l=550 nm, Dl=10 nm Glan-tayler prism

Example of image of the beam

Uncertainty principal in imaging. Dq Dq/l·Dx≥ 1 So, large opening of light will necessary to obtain a good spatial resolution. For example, l=400 nm and opening of 7 mrad, Dx≈57 mm for 1: 1 image.

Deconvolution with MEM method by using the Wiener inverse filter Fourier transform of blurred image G(u, v) in spatial frequency domain (u, v) is given by, where H(u, v) is thought as a inverse filter (Fourier transform of PSF), F(u, v) is a Fourier transform of geometric image, and N(u, v) is a Fourier transform of noise in the image). The Wiener inverse filter Hw is given by, where asterisk indicates the complex conjugate of H, fn is a power spectra of the noise, and ff is a power spectra of the signal.

Original image Image after deconvolution

2. Profile and size measurement via spatial coherence
")
To measure a size of object by means of spatial coherence of light (interferometry) was first proposed by H. Fizeau in 1868! This method was realized by A. A. Michelson as the measurement of apparent diameter of star with his stellar interferometer in 1921. This principle was now known as “ Van Cittert. Zernike theorem” because of their works; 1934 Van Cittert 1938 Zernike.

Spatial coherence and profile of the object Van Cittert-Zernike theorem According to van Cittert-Zernike theorem, with the condition of light is 1 st order temporal incoherent (no phase correlation), the complex degree of spatial coherence g(ux, uy) is given by the Fourier Transform of the spatial profile f(x, y) of the object (beam) at longer wavelengths such as visible light. where ux, uy are spatial frequencies given by;

Simple understanding of van Cittert-Zernike theorem Point source having certain size

3. SR interferometer a wavefront-division type interferometer using polarized, quasi-monochromatic rays
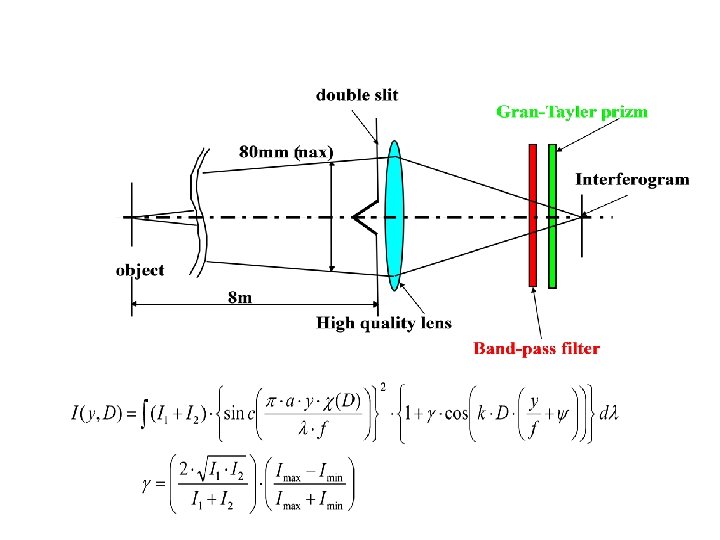

Typical interferogram in vertical direction
 from independent electrons")
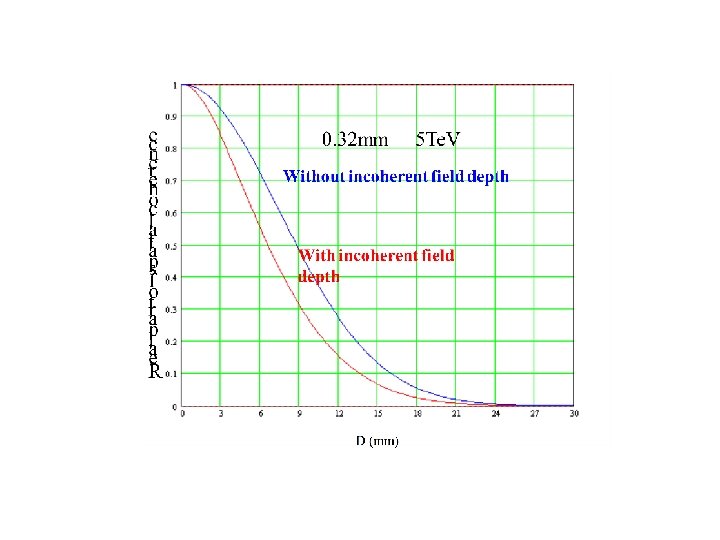
Effect of incoherent depth of field of (IDOF) from independent electrons
 : observation derection electron 3 n(T=t-Dt) n(T=t+Dt)")
electron 2 electron 1 n(T) : observation derection electron 3 n(T=t-Dt) n(T=t+Dt)
 : observation derection electron 3 n(T=t-Dt) n(T=t+Dt)")
electron 2 electron 1 n(T) : observation derection electron 3 n(T=t-Dt) n(T=t+Dt)

IDOF has no effect for vertical beam size measurement when the beam size is not strongly change along the orbit. But in the horizontal direction, apparent beam profile is changed with IDOF, we need include this effect to horizontal beam size measurement.

When the incoherent depth of field < Airy disk length of the diffraction r (1 -cos q ) r -q For example q Image is simply superimposition of horizontal beam profiles

The apparent beam profile is given by , Where s denotes beam size and term means displacement of center of Gaussian distribution represented by r and q. q is rotation angle of optical axis of pencil of light.

Then the real part of spatial coherence is given by Fourier cosine transform of this apparent distribution is given by , Intensity Imbalance factor Fourier cosine transform

4. Theoretical resolution and error transfer
, the interference fringe by point")
If the phase of light has no uncertainty (Df=0), the interference fringe by point source is given by;

Interference fringe with no phase fluctuation g=1 No theoretical uncertainty infinite resolution!

According to quantum optics, In the large number limit, uncertainty principle concerning to phase is given by Df·DN≥ 1/2 where DN is uncertainty of photon number.

Using the wavy aspect of photon in small number of photons, Forcibly ; From uncertainty principal Df·DN≥ 1/2, then, Df≥ 1/(2·DN). Even in the case of coherent mode, interference fringe will be smeared by the uncertainty of phase.
 The visibility of interference fringe will reduced by uncertainty")
Introducing some uncertainty ( p/2) The visibility of interference fringe will reduced by uncertainty of phase under the small number of photons. But actually, under the small number of photons, photons are more particle like, and difficult to see wave-phenomena.

Actually, we can have sufficient photons for an interferogram, and theoretical limit due to the phase uncertainty is negligible small In actual optical component, with l/10, this error corresponds to 0. 26 mm

Statistical Error transfer from Dg to Ds under assuming Dg=0. 01 as a function of g.

Systematic error due to nonlinearity near the CCD baseline

Saturation is significant in visibility better than 0. 9 g=0. 864

Convert visibility into beam size. We can see clear saturation in smaller double slit range which has visibility near 1. Saturation is significant in visibility better than 0. 9 g=0. 864 The visibility 0. 90 with D=60 mm, l=400 nm for the ATF interferometer corresponds to a beam size of 3. 5 mm. This size seems smallest measurable size with a normal setup of the interferometer.

5. Review of vertical small beam size measurements

Gaussian profile approximation s. D

Visibility as a function of double slit separation at ALBA. Solid blue line is the Gaussian fitted result.

Visibility as a function of double slit separation at SPEAR 3. The dotted line is measurement result, and the solid line is a Gaussian fit.

choose a fixed D and determine the beam size from the measurement of the visibility


Interferogram measured at D=50 mm and l=550 nm for low coupling mode at SPEAR 3.

Interferogram at the KEK ATF. Red line is measurement, and blue line is fitting. D=60 mm and l=400 nm.

7. Review for recent measurement of horizontal beam sizes The incoherent depth of field effect (IDOF) The visibility measurement as a function of slit separation is necessary for the observation of IDOF effect.

Then the real part of spatial coherence is given by Fourier cosine transform of this apparent distribution is given by , Intensity Imbalance factor Fourier cosine transform

Horizontal beam visibility measurements at SPEAR 3. Dots are measurements, red line is fitting with IODF and blue line is calculated visibility curve for a beam size 132. 7 mm without IDOF.

Horizontal visibility measured at ASLS as a function of slit separation. Blue line is calculated visibility curve for a beam size 88 mm without IDOF.

Horizontal visibility measured at ASLS as a function of slit separation. Blue line is calculated visibility curve for a beam size 88 mm without IDOF. Designed beam size at the source point is 87 mm

Horizontal visibility measured at ATF as a function of slit separation. Blue line is calculated visibility curve for a beam size 38. 5 mm without IDOF.

Measured data is in good agreement with IODF fitting. 38. 5 mm is good agreed to designd horizontal beam size of 39 mm

7. Application of interferometry for the beam size measurement in the LHC

Schematic drawing of the BSRT Synchrotron light sources Extraction mirror SR from inside of Bending magnet covers high energy range Magnetic field intensity at 7 Te. V 3. 9 T Bending radius 6013 m Bending angle 1. 58 mrad 2 -period Undulator for injection energy Edge radiation covers middle range of energy

SR from LHC SR from bending magnet in LHC. Opening angle is only about 0. 2 mrad SR from KEK PF About 10 times narrower than the Electron machine! Resolution in imaging is 10 times poor. We need a method having 10 times better resolution. Use the interferomtery! -6 -4 -2 0 2 q (mrad) 4 6

A Schematic drawing of new interferometer line

Usable separation of double slit

IDOF for horizontal beam size measurement is very significant due to very long Bending radius (6013 m) and narrow opening (0. 2 mrad) of SR at 7 Te. V

When the incoherent depth of field < Airy disk length of the diffraction r (1 -cos q ) r -q For example q Image is simply superimposition of horizontal beam profiles

Usable separation of double slit

First interferograms at LHC Taken at 6. 5 Te. V with pilot bunch having 5 x 10⁹ protons

d=3 mm a = 1. 5 mm h=6 mm λ = 560 nm

d=6 mm a = 1. 5 mm h=6 mm λ = 560 nm

d=9 mm a = 1. 5 mm h=6 mm λ = 560 nm

d = 12 mm a = 1. 5 mm h=6 mm λ = 560 nm

d = 15 mm a = 1. 5 mm h=6 mm λ = 560 nm

d = 18 mm a = 1. 5 mm h=6 mm λ = 560 nm

d = 21 mm a = 1. 5 mm h=6 mm λ = 560 nm

Very rough estimation of the vertical beam size At 6. 5 Tev Visibility from the interferogram at D=21 mm is roughly 0. 24 Corresponding vertical beam size is about 200 mm

SUMMARY 1. Van Cittert-Zernike’s theorem introduced Design of SR interferometer Interferograms for vertical and horizontal is discussed. 2. The theoretical resolution and the practical errors are discussed. We can measure the vertical beam size down to 3 -4 mm. 3. Recent trends in measurements for vertical and horizontal beam sizes in ALBA, SPEAR 3, ASLS and ATF were reviewed. 4. As a fresh topic, SR interferometry for LHC was also introduced.

The beam size measurement with SR interferometry is now popular worldwide, not only for electron machines but also for high-energy the proton machines such as the LHC.

Thank you very much for your attention.
- Slides: 69