
Recanalization v Outcome Why the Mismatch Lawrence R


- Slides: 17
Recanalization v. Outcome: Why the Mismatch? Lawrence R. Wechsler, M. D. Professor and Chair, Department of Neurology University of Pittsburgh
Lawrence R. Wechsler, MD § Ownership Interest (Stocks, Stock Options or Ownership Interest) – Neuro Interventional Therapeutic
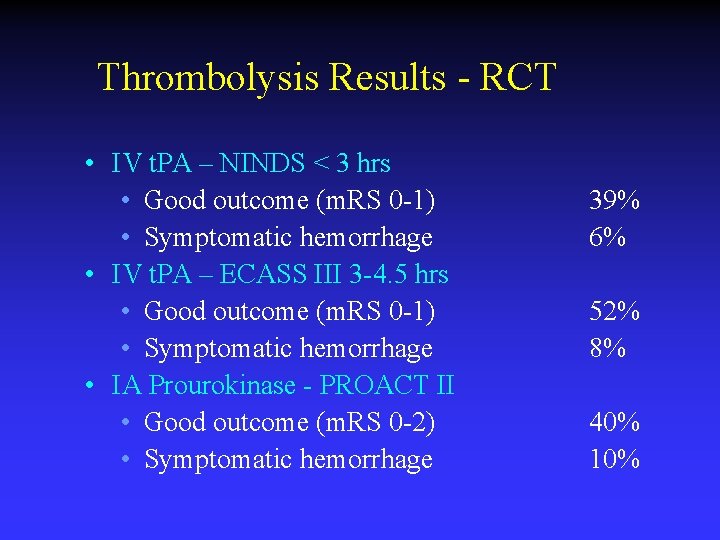
Thrombolysis Results - RCT • IV t. PA – NINDS < 3 hrs • Good outcome (m. RS 0 -1) • Symptomatic hemorrhage • IV t. PA – ECASS III 3 -4. 5 hrs • Good outcome (m. RS 0 -1) • Symptomatic hemorrhage • IA Prourokinase - PROACT II • Good outcome (m. RS 0 -2) • Symptomatic hemorrhage 39% 6% 52% 8% 40% 10%
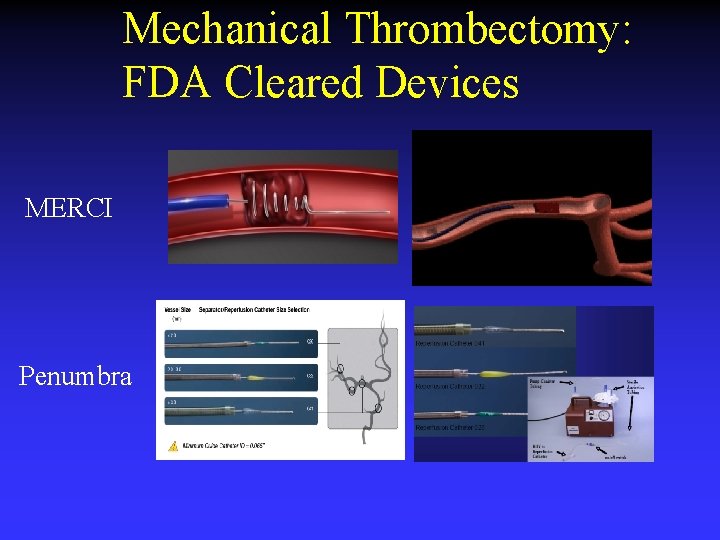
Mechanical Thrombectomy: FDA Cleared Devices MERCI Penumbra
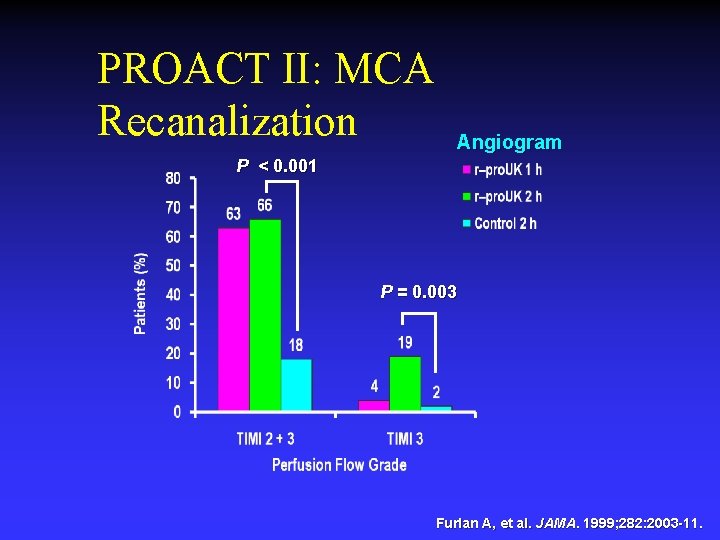
PROACT II: MCA Recanalization Angiogram P < 0. 001 P = 0. 003 Furlan A, et al. JAMA. 1999; 282: 2003 -11.
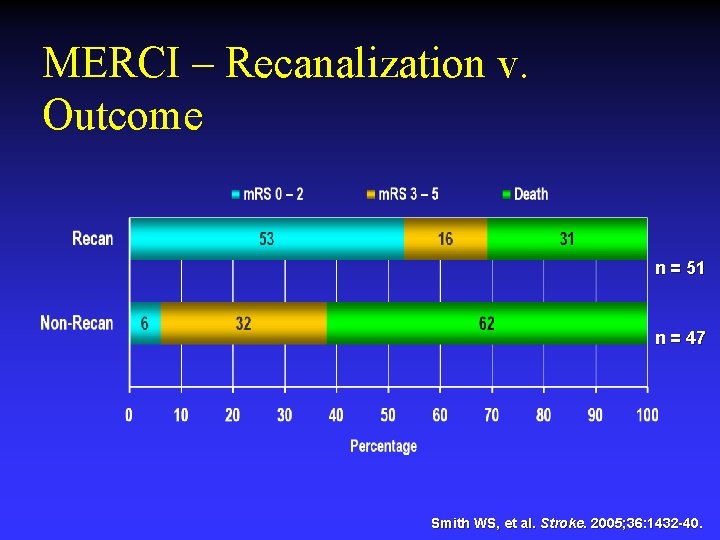
MERCI – Recanalization v. Outcome n = 51 n = 47 Smith WS, et al. Stroke. 2005; 36: 1432 -40.
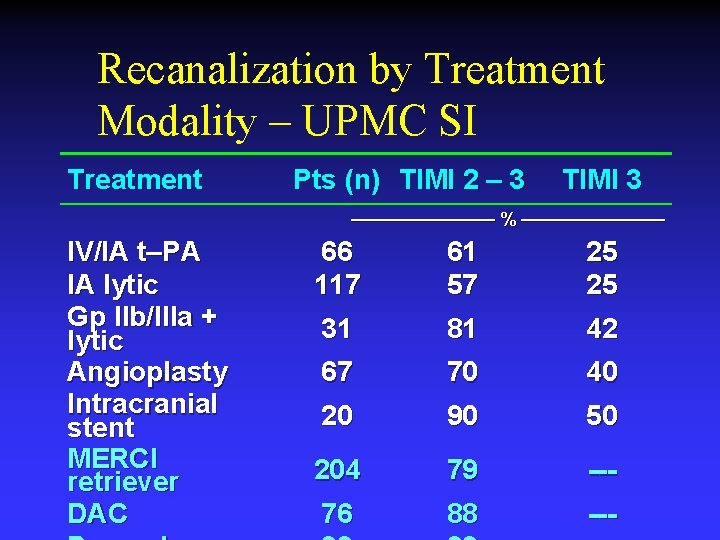
Recanalization by Treatment Modality – UPMC SI Treatment Pts (n) TIMI 2 – 3 TIMI 3 ———— % ———— IV/IA t–PA IA lytic Gp IIb/IIIa + lytic Angioplasty Intracranial stent MERCI retriever DAC 66 117 61 57 25 25 31 81 42 67 70 40 20 90 50 204 79 --- 76 88 ---
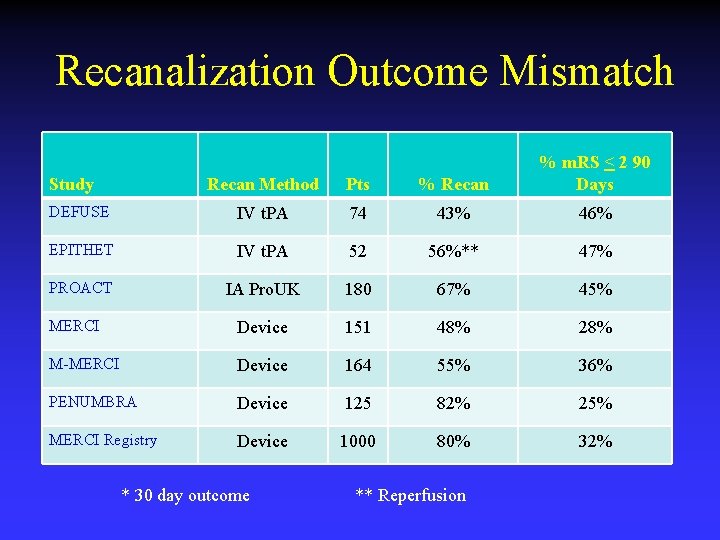
Recanalization Outcome Mismatch Recan Method Pts % Recan % m. RS < 2 90 Days DEFUSE IV t. PA 74 43% 46% EPITHET IV t. PA 52 56%** 47% PROACT IA Pro. UK 180 67% 45% MERCI Device 151 48% 28% M-MERCI Device 164 55% 36% PENUMBRA Device 125 82% 25% MERCI Registry Device 1000 80% 32% Study * 30 day outcome ** Reperfusion
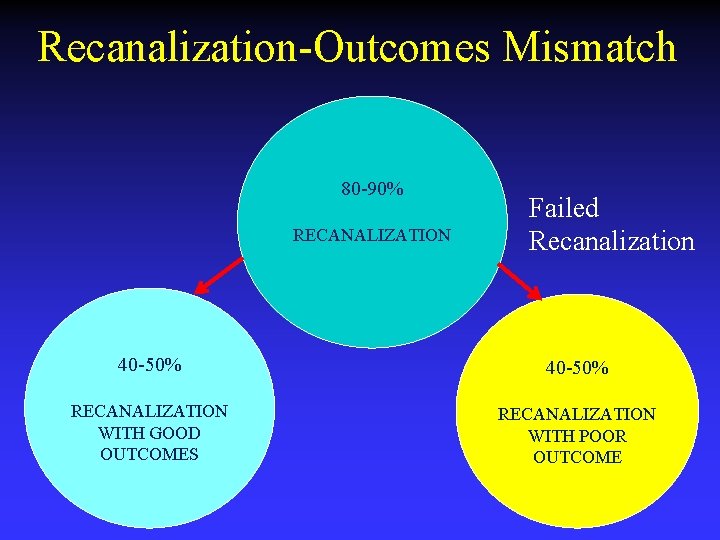
Recanalization-Outcomes Mismatch 80 -90% RECANALIZATION Failed Recanalization 40 -50% RECANALIZATION WITH GOOD OUTCOMES RECANALIZATION WITH POOR OUTCOME
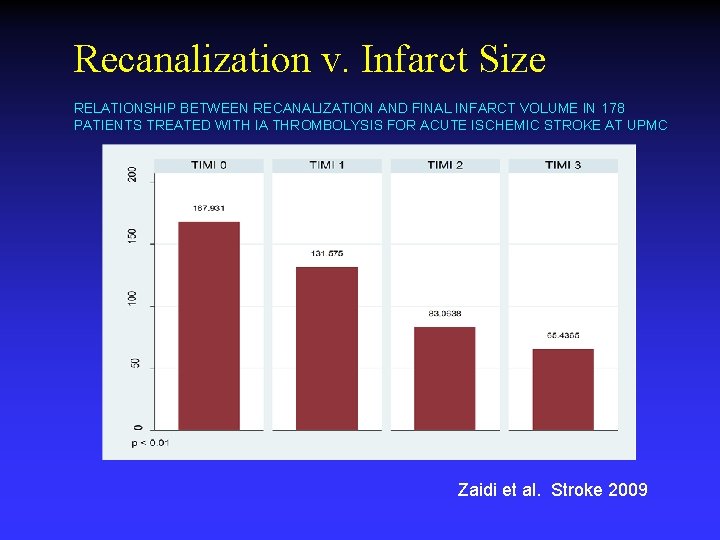
Recanalization v. Infarct Size RELATIONSHIP BETWEEN RECANALIZATION AND FINAL INFARCT VOLUME IN 178 PATIENTS TREATED WITH IA THROMBOLYSIS FOR ACUTE ISCHEMIC STROKE AT UPMC Zaidi et al. Stroke 2009
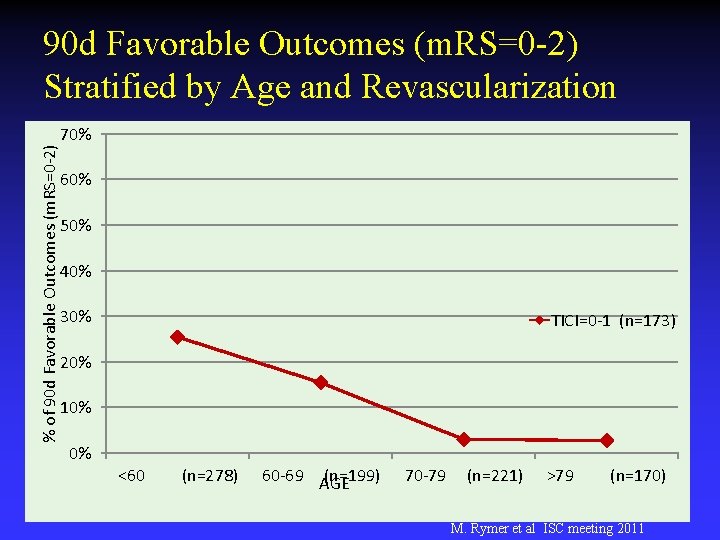
% of 90 d Favorable Outcomes (m. RS=0 -2) Stratified by Age and Revascularization 70% 60% 50% 40% 30% TICI=0 -1 (n=173) 20% 10% 0% <60 (n=278) 60 -69 AGE (n=199) 70 -79 (n=221) >79 (n=170) M. Rymer et al ISC meeting 2011
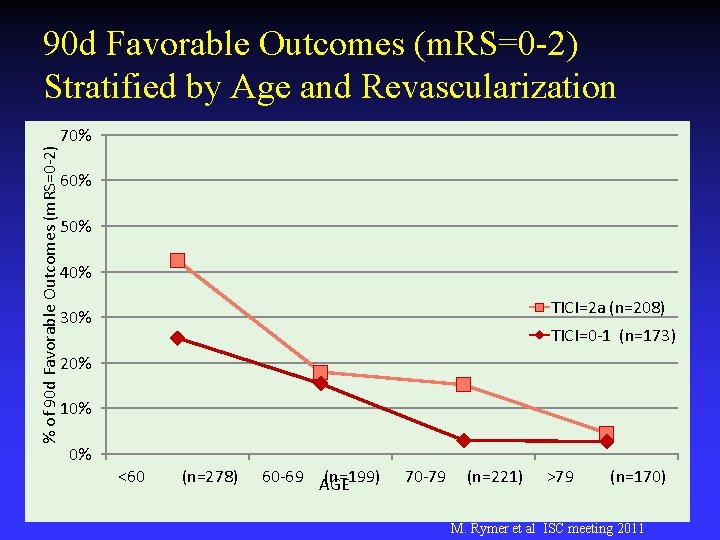
% of 90 d Favorable Outcomes (m. RS=0 -2) Stratified by Age and Revascularization 70% 60% 50% 40% TICI=2 a (n=208) 30% TICI=0 -1 (n=173) 20% 10% 0% <60 (n=278) 60 -69 AGE (n=199) 70 -79 (n=221) >79 (n=170) M. Rymer et al ISC meeting 2011
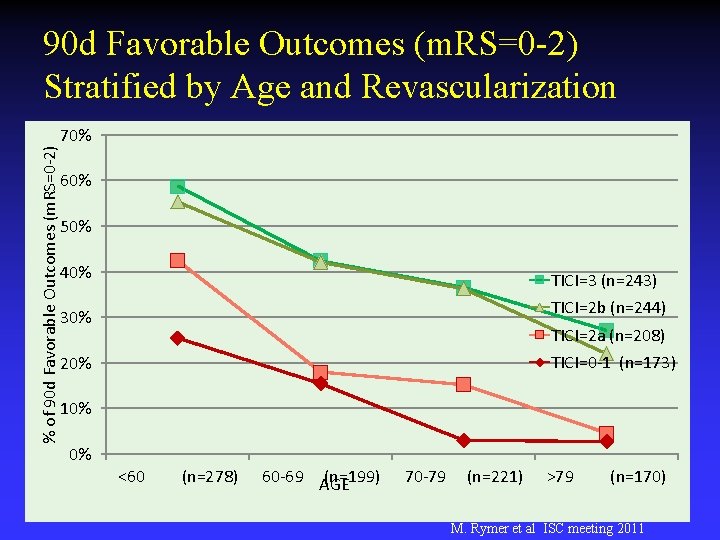
% of 90 d Favorable Outcomes (m. RS=0 -2) Stratified by Age and Revascularization 70% 60% 50% 40% TICI=3 (n=243) TICI=2 b (n=244) 30% TICI=2 a (n=208) TICI=0 -1 (n=173) 20% 10% 0% <60 (n=278) 60 -69 AGE (n=199) 70 -79 (n=221) >79 (n=170) M. Rymer et al ISC meeting 2011
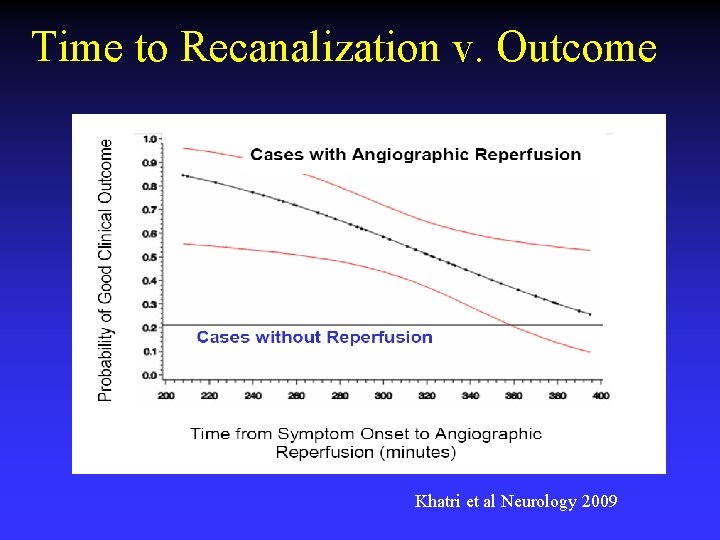
Time to Recanalization v. Outcome Khatri et al Neurology 2009
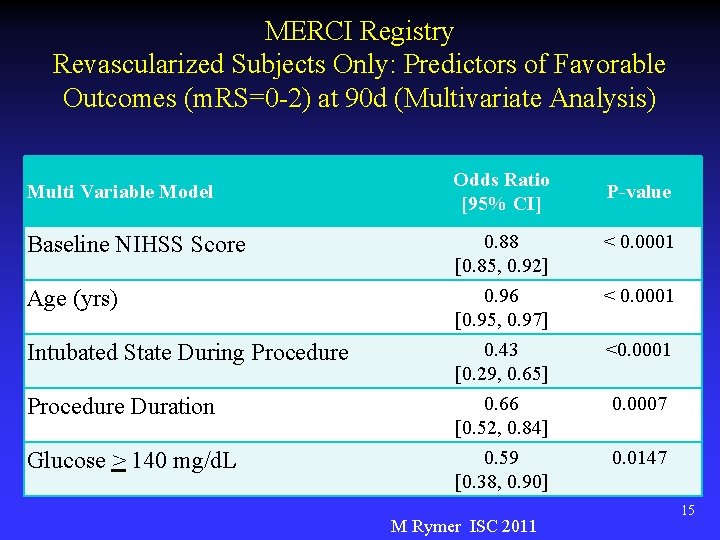
MERCI Registry Revascularized Subjects Only: Predictors of Favorable Outcomes (m. RS=0 -2) at 90 d (Multivariate Analysis) Multi Variable Model Baseline NIHSS Score Age (yrs) Intubated State During Procedure Duration Glucose > 140 mg/d. L Odds Ratio [95% CI] 0. 88 [0. 85, 0. 92] 0. 96 [0. 95, 0. 97] 0. 43 [0. 29, 0. 65] 0. 66 [0. 52, 0. 84] 0. 59 [0. 38, 0. 90] M Rymer ISC 2011 P-value < 0. 0001 <0. 0001 0. 0007 0. 0147 15
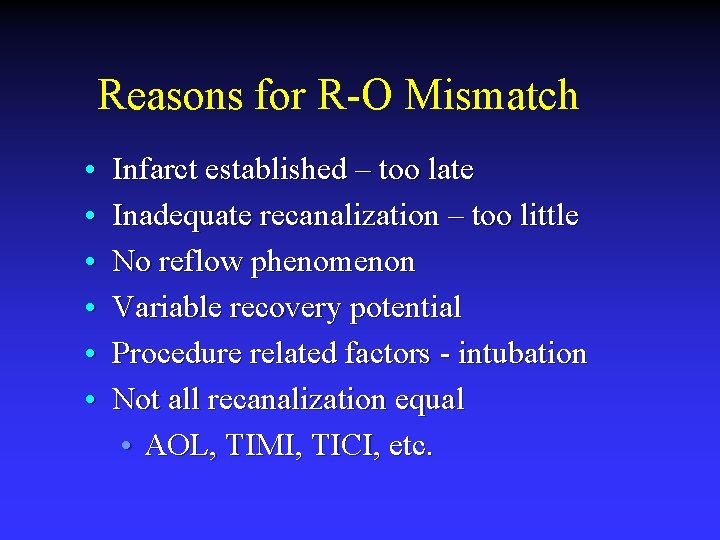
Reasons for R-O Mismatch • • • Infarct established – too late Inadequate recanalization – too little No reflow phenomenon Variable recovery potential Procedure related factors - intubation Not all recanalization equal • AOL, TIMI, TICI, etc.
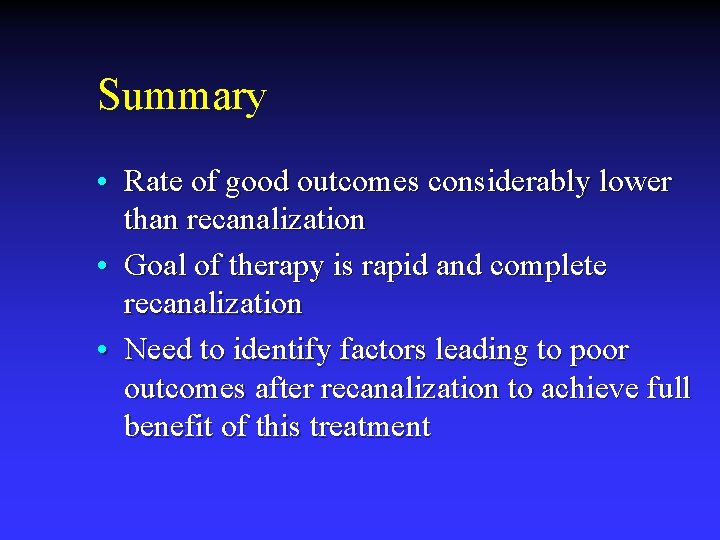
Summary • Rate of good outcomes considerably lower than recanalization • Goal of therapy is rapid and complete recanalization • Need to identify factors leading to poor outcomes after recanalization to achieve full benefit of this treatment