RealTime Sea Ice Detection from Coastal Radars 3


- Slides: 13
Real-Time Sea Ice Detection from Coastal Radars 3 rd Ice Analyst Workshop 14 -18 of June, 2011 Copenhagen, Denmark Tuomas Niskanen Oceanographic Services Finnish Meteorological Institute
Background u Coastal radars are part of an existing VTS network u VTS = Vessel Traffic Service u u Hailuoto 20 to 30 non-military fixed coastal radars along the Finnish coast The radars are designed for observing targets u Tankar u Movements of ice are noise which is normally filtered out With an external device, the filtered signal can be processed in order to get movements of ice out
Background u u u Ship. Sensor. Net project in 2008 u Founded by TEKES (Finnish Funding Agency for Technology and Innovation) u External signal capturing device by Image. Soft Oy u Ice movements can be brought out from processed filtered signal The external device can be installed into radars u Vessels, coastal radar stations, etc. The technology has been in use u RV Aranda u Icebreaker Otso u Hailuoto, Raahe and Tankar
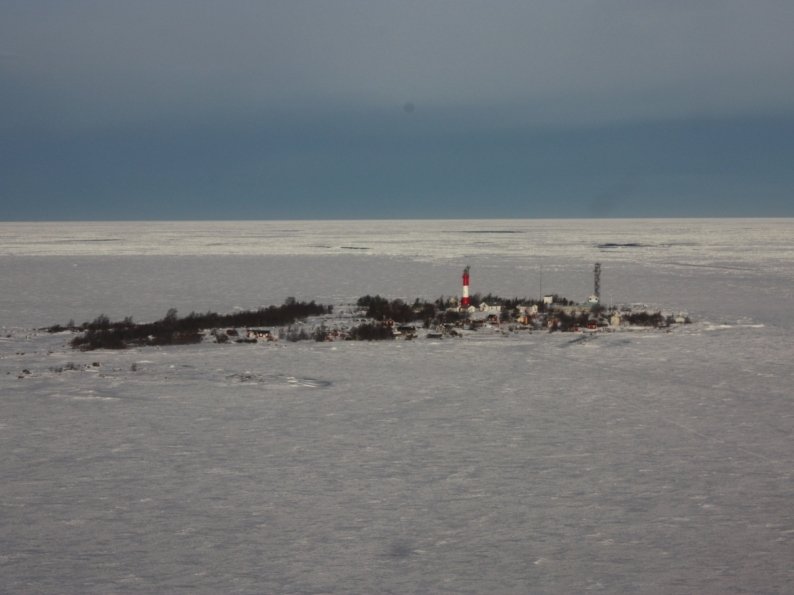
Coastal radars currently used for sea ice monitoring COASTAL RADARS • TERMA 9 Ghz • X-band • Antenna height • Hailuoto: 30. 2 m • Tankar: 37. 8 m 1 HAILUOTO TANKAR BACKGROUND Radar. Sat-2 image on 10 th of Feb 2011
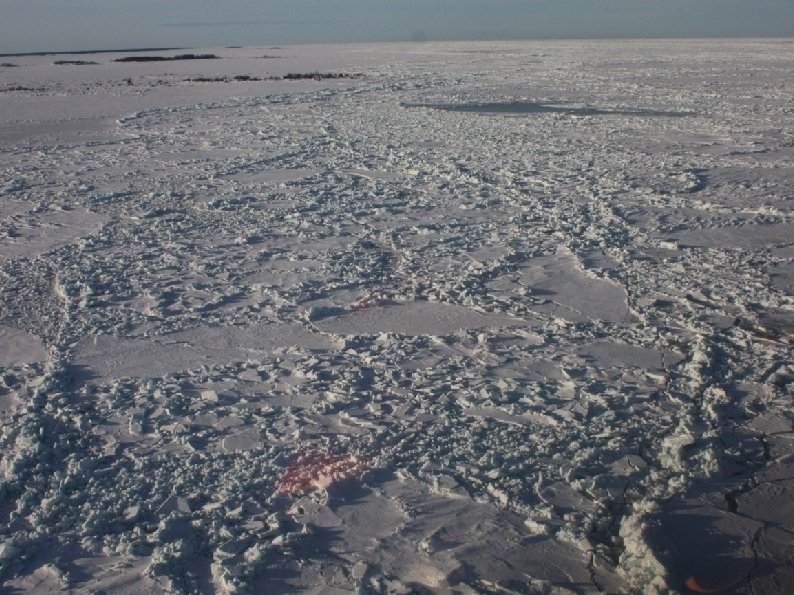
Satellite SAR Image Coastal vs. radar Image
Data flow Ice Service Coastal radar Image capturing device Via 3 G mobile link Image post processing at FMI’s server Scientific database Future customers
Advantages Satellite u Strength: covers large area at one pass u Weakness: passes same area once in 1 -2 days Coastal radar u Strength: covers certain area every 2 seconds u Weakness: maximum coverage approximately 30 km * 30 km Advantage of coastal radar images and animations u Useful tool for ice forecasting and charting when there are no satellite images available
Area coverage Radar. Sat-2 Image Coastal Radar Image
Ice motion, divergence and rotation determined from consecutive images IMAGE INTERVAL 2 sec SIZE 30 km DIVERGENCE red = closing blue = opening ROTATION red = clocwise blue = anticlocwise
Coastal radars in operational use at FMI Today at Finnish Ice Service • Animation is created with 2 minutes interval • Length of animation is 2 days • In daily operational use since Jan 2011 • Several other operational and research options
Coastal radars in operational use at FMI Future plans • More image capturing devices need to be installed • One will be installed to the Quark for winter 2011 -12 • In the future a mosaic of several devices? • Different animations (divergence, rotation)? • Colorization of black-white images? • can bring out more details from ice field