Real World Examples of Innovative Data Practices Two


 •")


 to create polished data visualizations • Mostly done through “drag")


 568 -7474")


, PCMH Level")


 City of")

, export all")


- Slides: 59
Real World Examples of Innovative Data Practices: Two Part B Sites and a Clinical Site
Creating Automated Reports for Ryan White Part B Programs for Ongoing Quarterly Assurance and Monitoring Program Outcomes Kristina Larson, MPH Data Analyst/Louisiana Office of Public Health, STD/HIV Program
Outline • • • Process flow Data sources/What’s included SAS Enterprise Guide overview Tableau overview Running LA ADAP report Future activities
Flow for Creating Reports Print to PDF Run Project Refresh Data Sets Open SAS EG Enter Dates when Prompted Open Tableau Review Data & Modify Narrative
Ryan White Services Fact Sheets • • ADAP Part B CBO Support Services Statewide and 9 public health regions Annual and quarterly
Data Sources for CBO Fact Sheets • • Eligibility from CAREWare Demographics of PLWH from e. HARS Services and details from CAREWare Reported labs from e. HARS
What’s included in the CBO Fact Sheets? • • Client Characteristics Utilization Care Continuums Unmet Need
Data Sources for ADAP Fact Sheets • Eligibility from Pharmacy Benefits Manager (Ramsell) • Drug claims from Pharmacy Benefits Manager (Ramsell) • Health insurance cost shares from CAREWare • Reported labs from e. HARS
What’s included in the ADAP Fact Sheets? • • Overview Enrollment Utilization Care Continuums
SAS Enterprise Guide • • • User interface for SAS Able to point-and-click through common SAS procedures Manual SAS Programing can be utilized to complete more complex tasks Easy to modify simple tasks and reports Limits on what can be done through point-and-click
Tableau • Easy (somewhat) to create polished data visualizations • Mostly done through “drag and drop” • Able to create interactive visualizations • Connects to many data sources • Expensive
Process Flow for ADAP Factsheet
Starting Project
Entering Prompts
What happens next? • • • SAS exports data sets into a secure network folder User opens Tableau points to newly created data sets and refreshes charts and graphs User reviews data and modifies narrative User prints to pdf and distributes
Tableau Dashboard
Tableau Dashboard
Table in Tableau – Care Continuum
Bar Chart in Tableau – Care Continuum
Future Activities • Continue to refine reports • Use current reports as a template for interactive graphs/charts for public facing website
Questions? Kristina Larson kristina. larson@la. gov (504) 568 -7474
Utilizing Capacity Grant to Minimize Gaps in HIV Care Continuum Ron Calangi, Sr. Programmer Analyst Jameela J. Yusuff MD MPH FACP, Medical Director STAR Health Center SUNY Downstate Medical Center, Brooklyn New York
Disclosures Dr. Jameela J. Yusuff and Ron Calangi have no financial interest to disclose. This continuing education activity is managed and accredited by Affinity. CE/Professional Education Services Group in cooperation with HRSA and LRG. PESG, HRSA, LRG and all accrediting organization do not support or endorse any product or service mentioned in this activity. PESG, HRSA, and LRG staff as well as planners and reviewers have no relevant financial or nonfinancial interest to disclose. Commercial Support was not received for this activity.
Learning Objectives At the conclusion of this activity, the participant will be able to: 1. Gain insight into how to develop SRS reporting system 2. How to utilize reports created by the reporting system 3. How to engage staff to view and act on the reports
STAR Health Center, Brooklyn New York Established in 1991, RW Part C funding PCMH Level 3, one-stop shop for all medical/behavioral health needs HIV primary care and prevention (PRe. P/PEP) HCV services including Fibroscan LGBTQ care (HRA), Hormone therapy Women’s health—Colposcopy and Prenatal Integrated MH/SA counselors, trauma informed Care, Seeking Safety Medical CM, clinical pharmacist, outreach, CAG, social media, and nutrition services • Opioid Prevention Program, AETC site, SBIRT trained staff • •
Data Collection Challenges for HRSA-HAB Measures • HRSA, multiple other grants (PHS/SAMHSA), PCMH Level 3, New York AIDS Institute Quality requirements, and Value Based plans • Multiple entities who required data • Time consuming—many indicators was a manual pull—particularly retention • Provider specific results was tedious to complete • Various systems to retrieve data from • Limited support staff to assist with the collection • EMR had canned reports but not relevant for our needs • Staff didn’t have access to data
Data Required • • • Viral load suppression CD 4 <200 Hgb. A 1 c and lipid results Quantiferon results RPR results Retention 1 year, and 2 year Patients lost to follow up Nutrition surveys Psychosocial assessments Substance use screenings Tobacco screenings
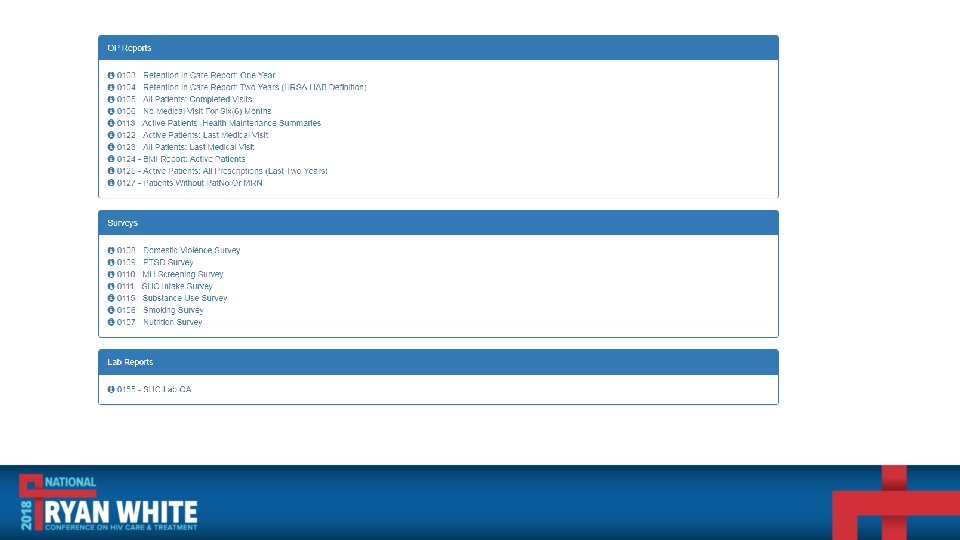
Key Reports Obtained by SRS • Retention Report—both 1 year and 2 year • Patients not seen in 6 months • Survey results • Psychosocial/Substance use/Smoking/Nutrition • Lab QA Report • By Provider • Visit Status • Wide array of lab results: CD 4, VL, Quantiferon, RPR, Lipids,
Data Conversion & Report Access HL 7 Open Engine Hospital Lab System database 1 Hospital Lab System Copy Secure Intranet Web Server Electronic Health Record database 2 Electronic Heath Record Copy Clinic Staff
Select Various Formats to View Data
Opening Report Summary
Patients Sorted By PCP
Spreadhseet example of Patients not seen
Report of Patients Not Seen in 6 months Report is sorted by patient Provider, date of last vist Given, and type of visit included
Example of Psychosocial Assessment
Example of Responses from Survey
Lab QA Report Includes • Patient information • Provider • HIV VL, CD 4 • Hgb. A 1 c • Quantiferon result • RPR • Visit Kept/Not Kept
Who Uses this Reporting System? • In-service given to the Quality leadership team and staff as a whole • Quality team, as we track Hab Measures and other data for regulatory purposes • Front desk/clerical team and medical case management tracks patients not seen in 6 months and retention rates • Nutritionist tracks her numbers and survey results (food security questions) • Behavioral Health team track psychosocial surveys and substance use surveys— in terms of numbers and responses • Medical/Nursing team review smoking survey and Lab QA surveys to see provider specific data and other outcomes
Limitations • • • Pathology is not incorporated (Cervical pap needs to be viewed elsewhere) Lab QA report needs to be downloaded once a month All visits must be closed in order to be captured in the retention report IT resource still needed EHR downtime Manual update of EHR
Conclusion • HRSA’s capacity grant provided resources to merge data from 2 systems in a system that is accessible and user friendly to all staff • Optimized and simplified data collection for the clinic, particularly for HAB related measures • Staff are empowered and can monitor their own productivity and track results of survey • Less dependence on IT to produce reports for staff, which improves IT’s productivity • This reporting system configuration can be transferred into another EMR and yield the same results
Obtaining CME/CE Credit If you would like to receive continuing education credit for this activity, please visit: http: //ryanwhite. cds. pesgce. com
Integration of Michigan’s Ryan White Service Providers into one CAREWare System Carrie Kirkpatrick, MSW Ryan White Quality Assurance Coordinator Michigan Department of Health of Human Services
Outline • • • Project background Process for merging CAREWare Datasets Importing from other data sources Benefits of an integrated system Challenges and lessons learned Next steps
Background Integration Goal: Streamline data collection and allow direct service providers to access comprehensive client care information 2015 Integration began 2016 • Lab import process began • Part A integration completed 2017 • Lab import refinement • Integration delayed due to CW bug 2018 • Addition of final Part C clinic • Integration completed
State of Michigan Ryan White Program and Subrecipients (Part B & D) City of Detroit Ryan White Program and Subrecipients (Part A) Michigan Public Health Institute (Server Host) Direct Ryan White Recipients (Parts C & D) State of Michigan HIV Surveillance Team Pharmacy Benefits Manager and Dental Benefits Manager
Process for Merging CAREWare Datasets
Establish Data and Privacy Agreements Using the Provider Data Export Module (PDE), export all of the client level data that will be transferred Using the Provider Data Import Module (PDI), import the client level data into the blank provider domain created in step 3 Gather requirements on name of organization, user/agency permissions, data set size Using the Provider Data Import Module (PDI), import the metadata file into the blank provider domain created in step 3 Map any fields that require mapping, and process records Create a blank provider domain inside State of Michigan CAREWare database Using the Provider Data Export Module (PDE), export the metadata from the external partner’s CAREWare database Once records have been processed, run data checks to ensure data integrity
Importing From Other Data Sources HIV Surveillance Pharmacy Benefits Manager Dental Benefits Manager • HIV Viral Load Lab Results • CD 4 Count Lab Results • Data to Care client lists • Medical Monitoring Project • ADAP copay, coinsurance, and deductible payments • ADAP Premium payments • Oral health service payments
Benefits of Integrated System • • • Standardized data collection and client services Federal Reporting Reduction of sub-recipient data entry burden Inform statewide program planning with use of service delivery data Run and assess statewide outcome measures
Standardized Data Collection and Client Services üAlthough some slight differences exist between Ryan White Parts, most sub-recipients in Michigan record services and units according to the same standardized sub-unit definitions üSubrecipients and recipients are able to view client services received from other Ryan White providers
Federal Reporting üGathering of data for federal reports is easier to obtain from one centralized client information source üAbility to assist directly funded recipients with completing RSRs and offering general technical assistance
Reduction of Sub-recipient Data Entry Burden Prior to importing Surveillance data, all sub-recipients manually entered clients’ Viral Load and CD 4 Count lab results into CAREWare
Inform Statewide Program Planning with Use of Service Delivery Data • Michigan Regional Group – all members (recipients) compared outcome data • Part B/D Quality Management Committee – regular communication with Part A staff & Quality Steering Committee • Monitor for gaps/needs in service delivery by region of state
Run and Assess Statewide Outcome Measures • By service category • By funding
Run and Assess Statewide Outcome Measures To help identify disparities that may exist, and inform quality improvement approaches
Challenges and Lessons Learned • Impact of external systems’ data process changes • System bugs/glitches • Matching clients between data systems
Next Steps Population §Continue data imports from external systems §Address statewide HIV care service provision gaps §Provide continued CAREWare user support §Identify and address disparities, to inform QI projects Viral Load Suppression Absolute Disparity Odds Ratio Impact MAYBE YES (246) Age: 25 -44 80. 93% = 2623/3241 HIV Risk Factor: Perinatal 75. 21% = 91/121 YES (13) Housing: Non-permanently Housed 66. 67% = 2/3 YES None (1) Housing: Temporary 75. 42% = 178/236 YES (24) Housing: Unstable 66. 20% = 143/216 YES (43) Race: African American 83. 12% = 4310/5185 MAYBE YES (340) Transgender 76. 16% = 115/151 MAYBE YES (14) Minority Men who have Sex with Men 81. 80% = 2985/3649 MAYBE None (183) African American or Latina Women 83. 36% = 1503/1803 None (37) Youth (13 -24) 73. 50% = 391/532 YES (65)
Questions? Carrie Kirkpatrick, MSW Ryan White Part D/MIDAP Quality Assurance Coordinator kirkpatrickc 2@michigan. gov Amber Staudacher, MPH, RPCV Ryan White Part B Quality Management Coordinator staudachera@michigan. gov Cody Wilson HIV Data Analyst wilsonc 26@michigan. gov