Reading Cladograms Reading a cladogram A quick review


- Slides: 10
Reading Cladograms
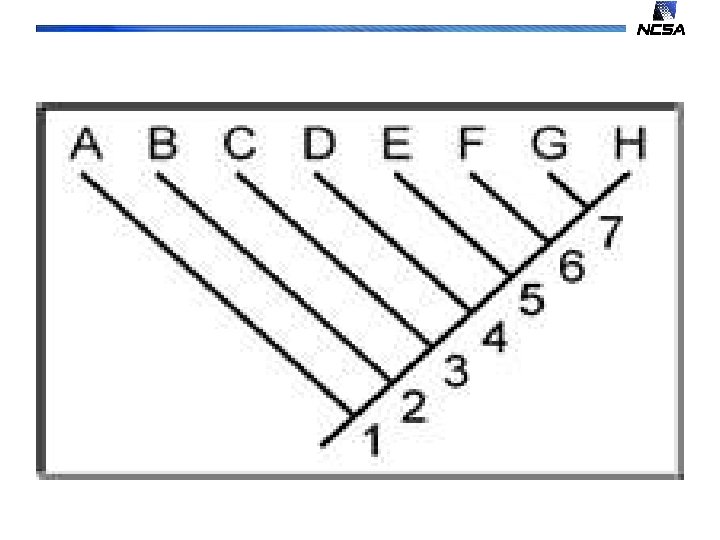
Reading a cladogram : A quick review • A cladogram or evolutionary tree, represents the evolutionary relationships among a set of organisms or groups of organisms, that are believed to have a common ancestor.
Tips, Internal Nodes, Edges • The tips of the cladogram represent groups of descendent taxa (often species) • The internal nodes of the tree represent the common ancestors of those descendents. • The tips are the present and the internal nodes are the past. • The edge lengths in some trees correspond to time estimates – evolutionary time.
Sister Groups and a common ancestor • Two descendents that split from the same node are called sister groups. • In the trees above, species A & B are sister groups — they are each other's closest relatives; which means that: – i) they have a lot of evolutionary history in common and very little evolutionary history that is unique to either one of the two sister species and – ii) that they have a common ancestor that is unique to them.
Equivalent trees • These three cladograms are the same.
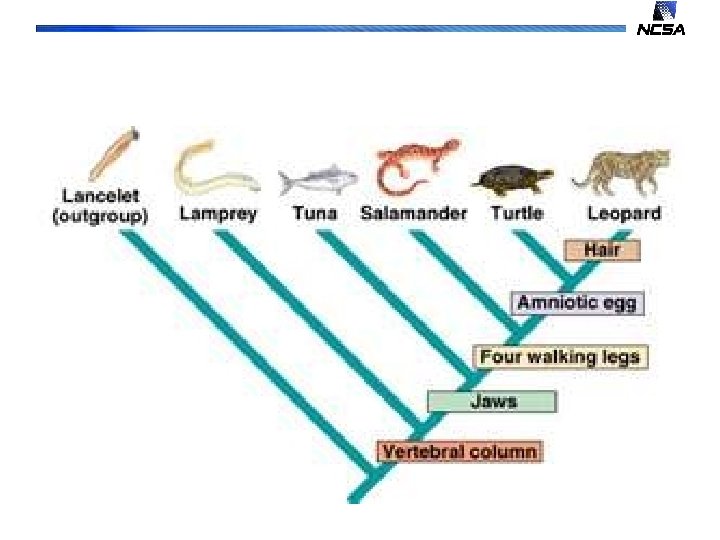
Outgroup • Many cladograms also include an outgroup — a taxon outside the group of interest. • All the members of the group of interest are more closely related to each other than they are to the outgroup. Hence, the outgroup stems from the base of the tree. • An outgroup can give you a sense of where on the bigger tree of life the main group of organisms falls. It is also useful when constructing evolutionary trees.
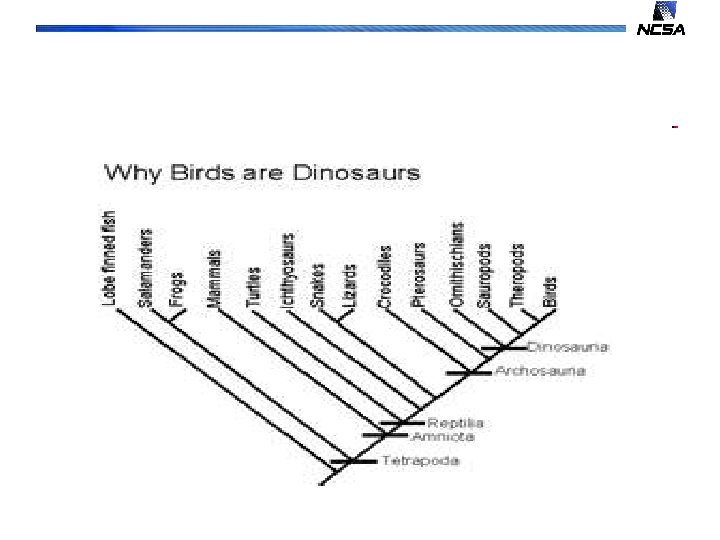
Example of Cladogram