
RCEP Impact on Indian Milk Producers RCEP Business
RCEP: Impact on Indian Milk Producers RCEP Business Stakeholders Consultation Hyderabad Jayen Mehta Senior General Manager GCMMF Ltd. (Amul), Anand July 2017
Points to Ponder Dairy Scenario ◦ ◦ Global V/s India Production Global V/s India Prices India Today - Dairy and Farmers’ Income Dairy : RCEP V/s India ◦ Status ◦ ASEAN ◦ Oceania The Road Ahead
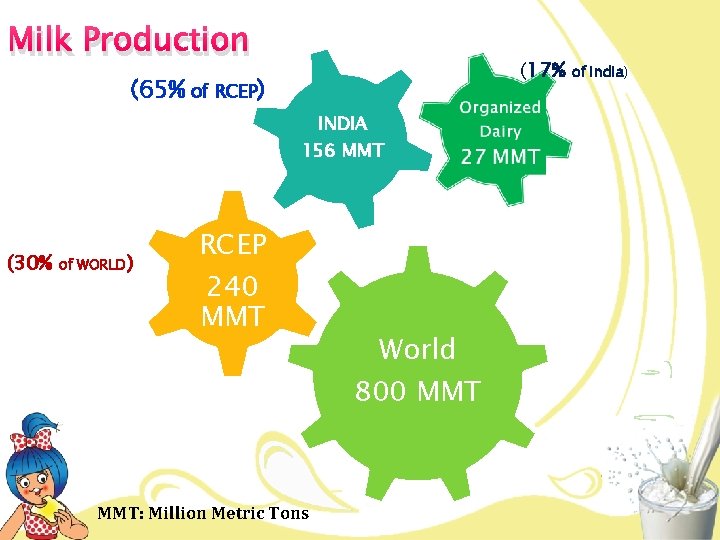
Milk Production (17% (65% of RCEP) INDIA 156 MMT (30% of WORLD) RCEP 240 MMT World 800 MMT: Million Metric Tons of India)
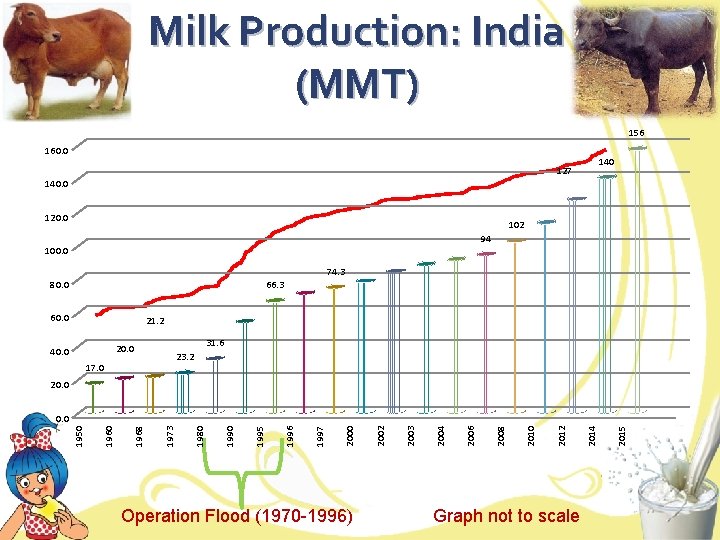
Milk Production: India (MMT) 156 160. 0 140 127 140. 0 120. 0 102 94 100. 0 74. 3 80. 0 66. 3 60. 0 21. 2 31. 6 20. 0 40. 0 23. 2 17. 0 20. 0 Operation Flood (1970 -1996) Graph not to scale 2015 2014 2012 2010 2008 2006 2004 2003 2002 2000 1997 1996 1995 1990 1980 1973 1968 1960 1950 0. 0
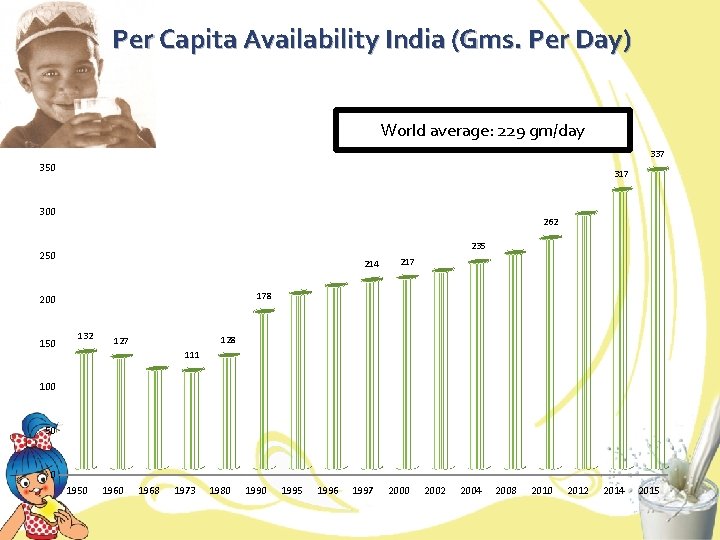
Per Capita Availability India (Gms. Per Day) World average: 229 gm/day 337 350 317 300 262 235 250 214 178 200 150 217 132 128 127 111 100 50 0 1950 1968 1973 1980 1995 1996 1997 2000 2002 2004 2008 2010 2012 2014 2015
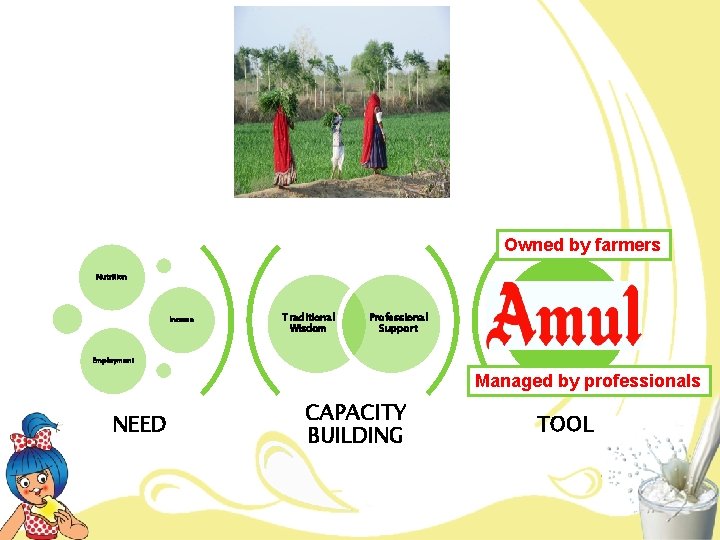
Owned by farmers Nutrition Income Traditional Wisdom Professional Support Creating structure Institution Employment Managed by professionals NEED CAPACITY BUILDING TOOL
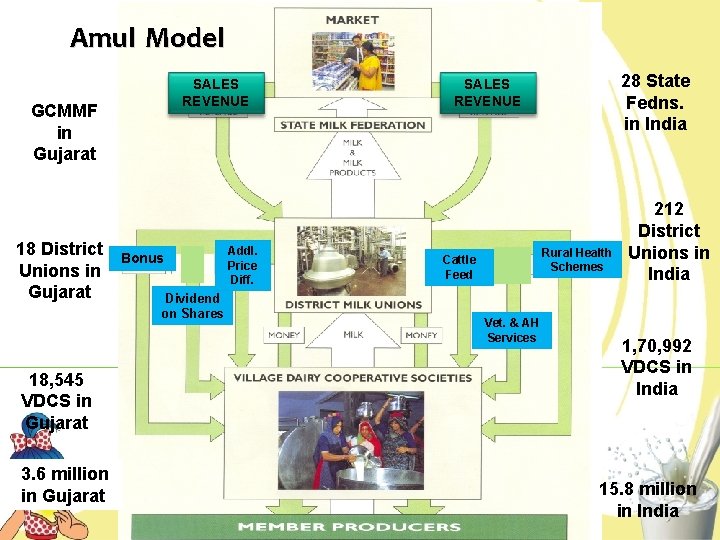
Amul Model SALES REVENUE GCMMF in Gujarat 18 District Unions in Gujarat 18, 545 VDCS in Gujarat 3. 6 million in Gujarat Bonus Dividend on Shares Addl. Price Diff. 28 State Fedns. in India SALES REVENUE Cattle Feed Rural Health Schemes Vet. & AH Services 212 District Unions in India 1, 70, 992 VDCS in India 15. 8 million in India
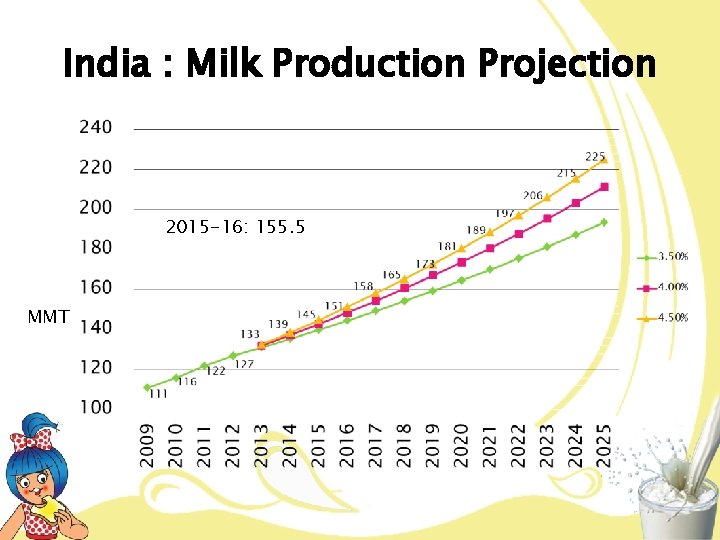
India : Milk Production Projection 2015 -16: 155. 5 MMT
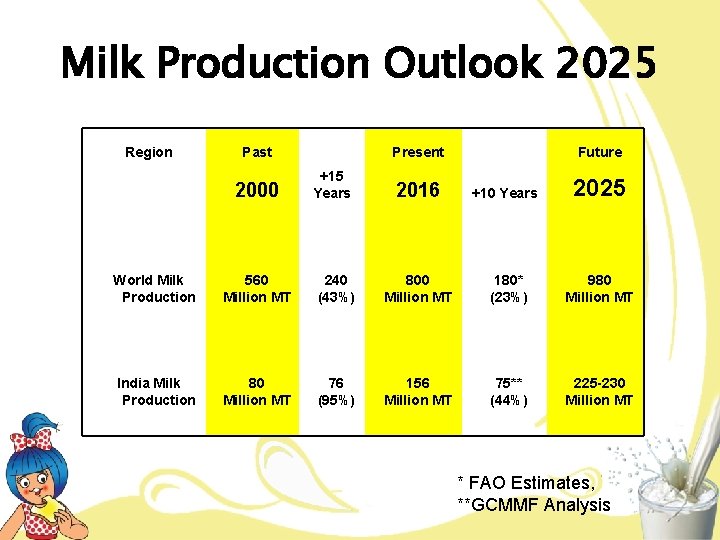
Milk Production Outlook 2025 Region Past 2000 World Milk Production India Milk Production 560 Million MT Present +15 Years 2016 +10 Years 240 (43%) 800 Million MT Future 2025 180* (23%) 980 Million MT 76 (95%) 156 Million MT 75** (44%) 225 -230 Million MT * FAO Estimates, **GCMMF Analysis
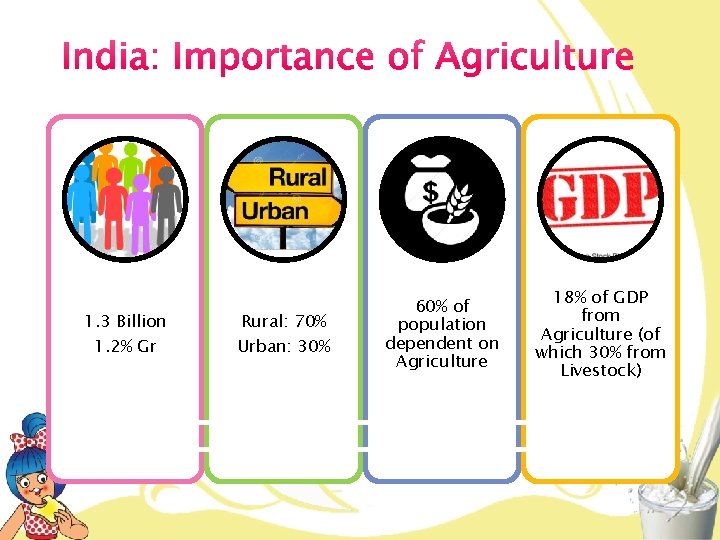
1. 3 Billion 1. 2% Gr Rural: 70% Urban: 30% 60% of population dependent on Agriculture 18% of GDP from Agriculture (of which 30% from Livestock)
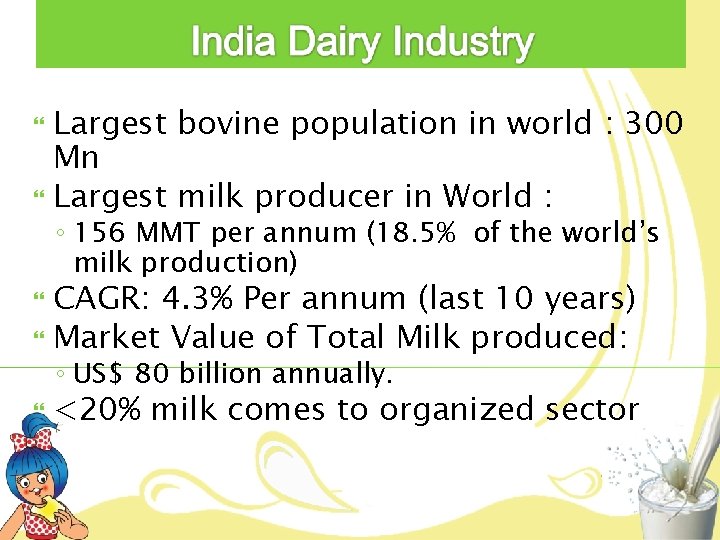
Largest bovine population in world : 300 Mn Largest milk producer in World : ◦ 156 MMT per annum (18. 5% of the world’s milk production) CAGR: 4. 3% Per annum (last 10 years) Market Value of Total Milk produced: ◦ US$ 80 billion annually. <20% milk comes to organized sector
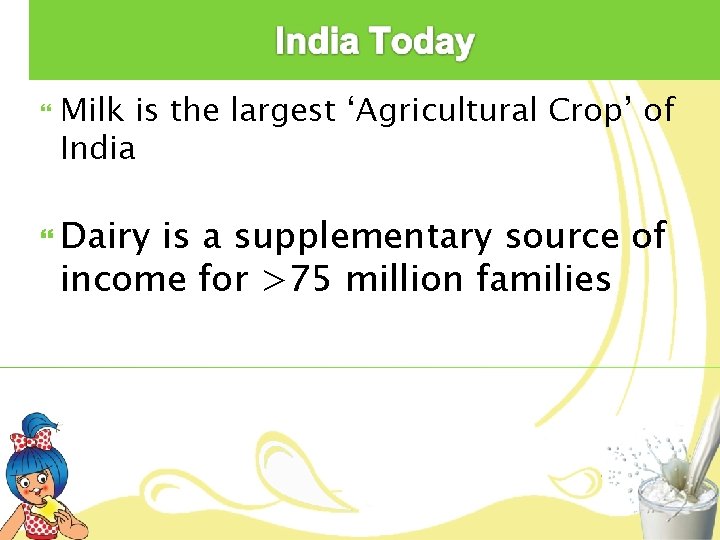
Milk is the largest ‘Agricultural Crop’ of India Dairy is a supplementary source of income for >75 million families
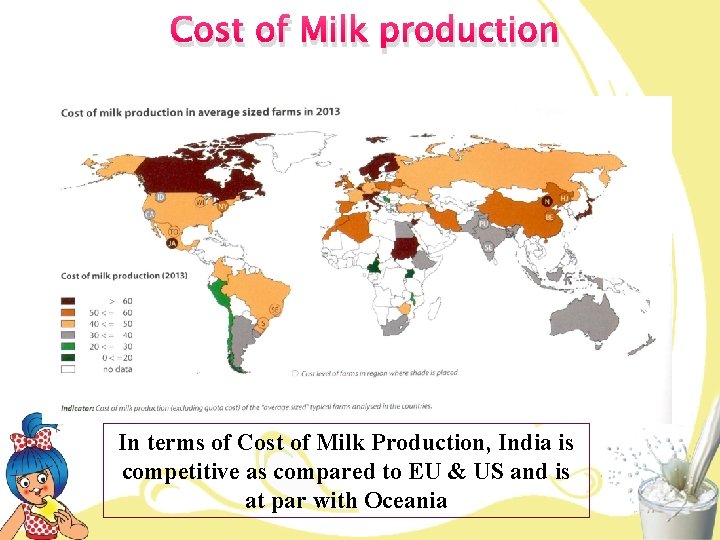
Cost of Milk production In terms of Cost of Milk Production, India is competitive as compared to EU & US and is at par with Oceania
Global Prices Major Dairy trade happens in commodity (SMP, WMP, Butter / Butteroil and Cheese) Dairy commodity prices are much lower than India Difficult to compete in Commodity market for India Australia / NZ controls more than 35% of Global Dairy Trade and more than 50% in RCEP area
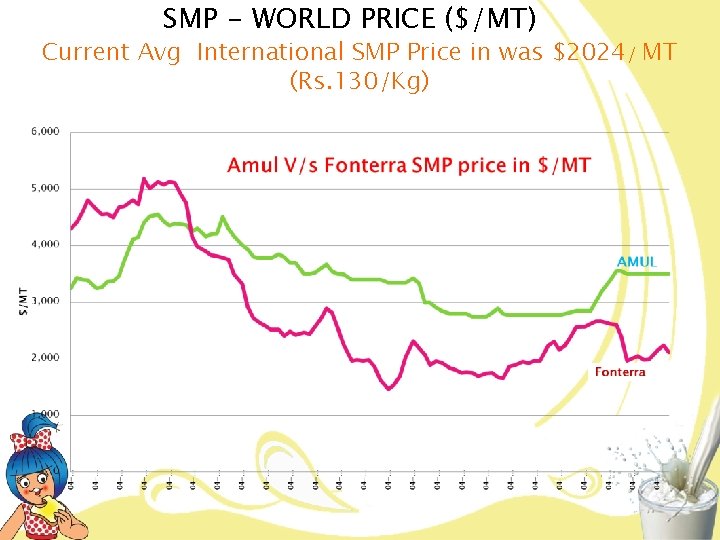
SMP - WORLD PRICE ($/MT) Current Avg International SMP Price in was $2024/ MT (Rs. 130/Kg)
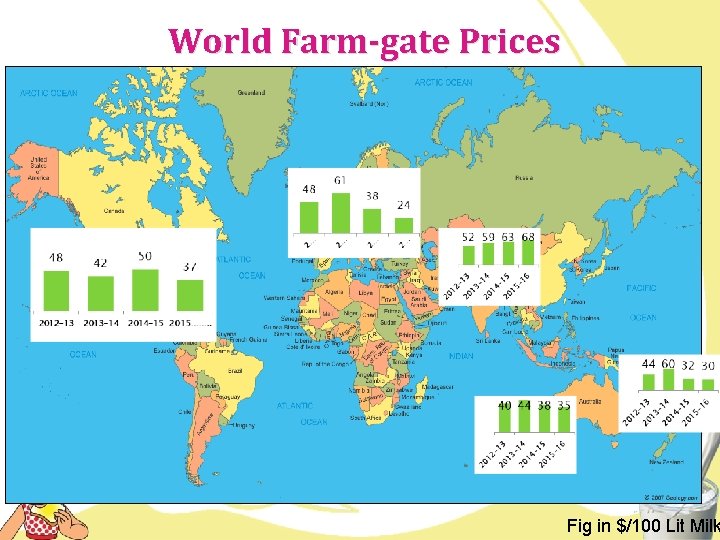
World Farm-gate Prices Fig in $/100 Lit Milk
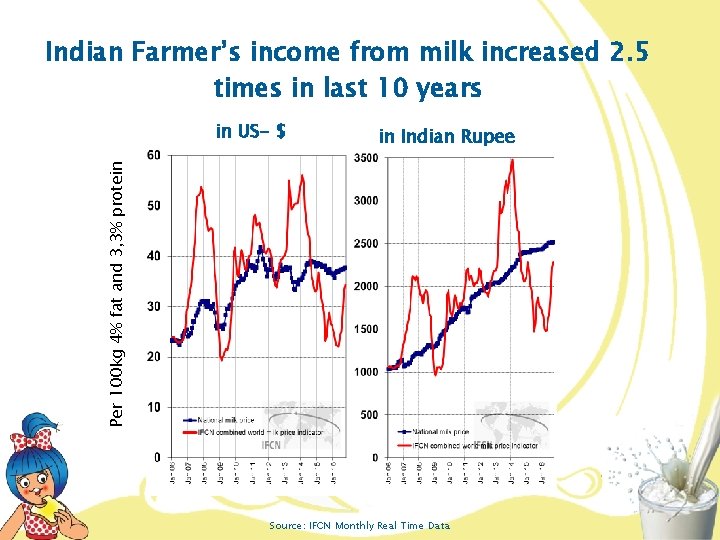
Indian Farmer’s income from milk increased 2. 5 times in last 10 years in Indian Rupee USD/100 kg ECM Per 100 kg 4% fat and 3, 3% protein in US- $ Source: IFCN Monthly Real Time Data
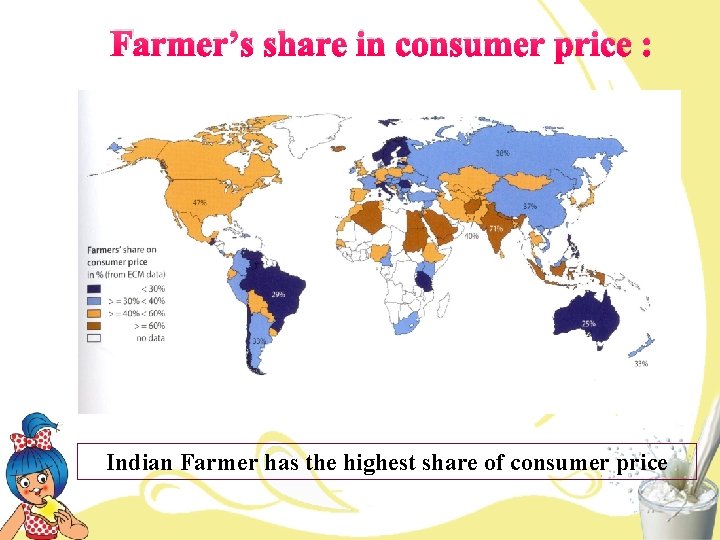
Farmer’s share in consumer price : Indian Farmer has the highest share of consumer price
Milk and farmers Milk: “Make in Rural India” is the surest bet for doubling farmers’ income by 2022. Need to ensure that their income from milk is protected To ensure availability of market for the milk at remunerative prices
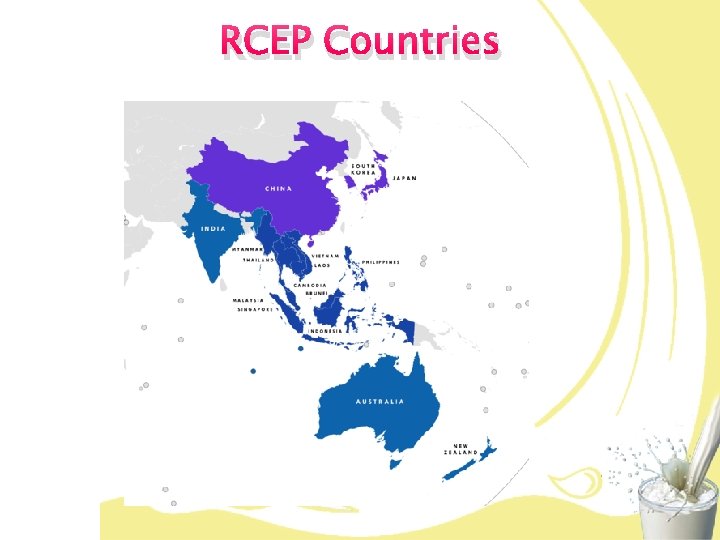
RCEP Countries
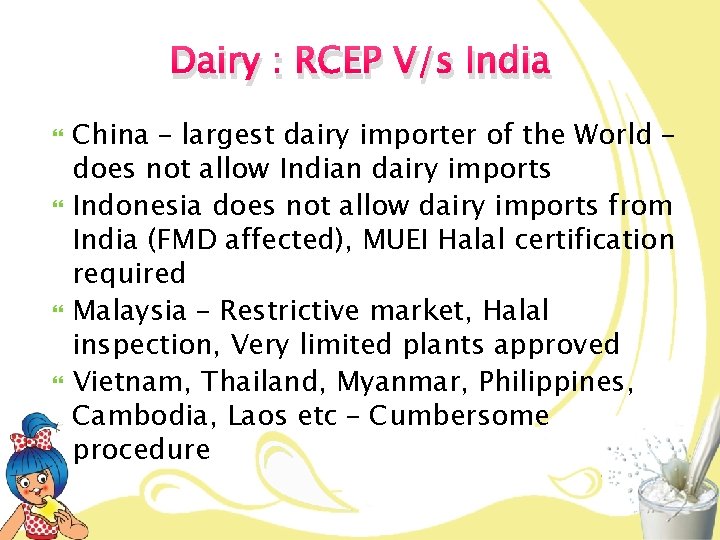
Dairy : RCEP V/s India China – largest dairy importer of the World – does not allow Indian dairy imports Indonesia does not allow dairy imports from India (FMD affected), MUEI Halal certification required Malaysia – Restrictive market, Halal inspection, Very limited plants approved Vietnam, Thailand, Myanmar, Philippines, Cambodia, Laos etc – Cumbersome procedure
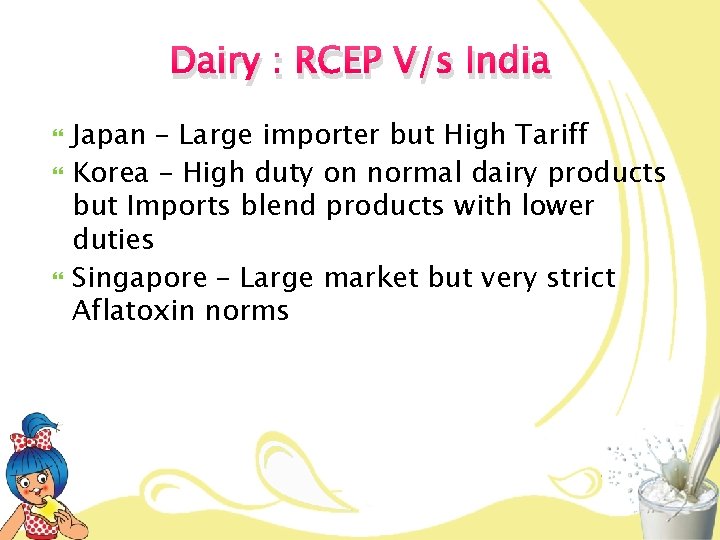
Dairy : RCEP V/s India Japan – Large importer but High Tariff Korea – High duty on normal dairy products but Imports blend products with lower duties Singapore – Large market but very strict Aflatoxin norms
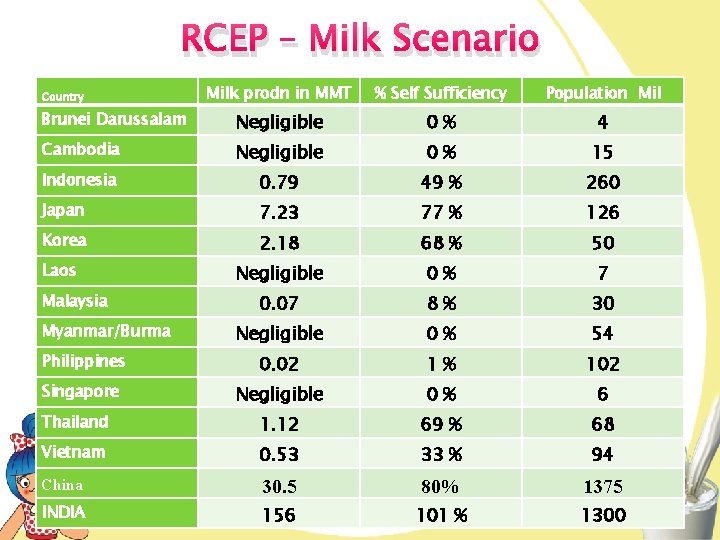
RCEP – Milk Scenario Milk prodn in MMT % Self Sufficiency Population Mil Brunei Darussalam Negligible 0% 4 Cambodia Negligible 0% 15 Indonesia 0. 79 49 % 260 Japan 7. 23 77 % 126 Korea 2. 18 68 % 50 Laos Negligible 0% 7 0. 07 8% 30 Negligible 0% 54 Philippines 0. 02 1% 102 Singapore Negligible 0% 6 Thailand 1. 12 69 % 68 Vietnam 0. 53 33 % 94 China 30. 5 80% 1375 INDIA 156 101 % 1300 Country Malaysia Myanmar/Burma
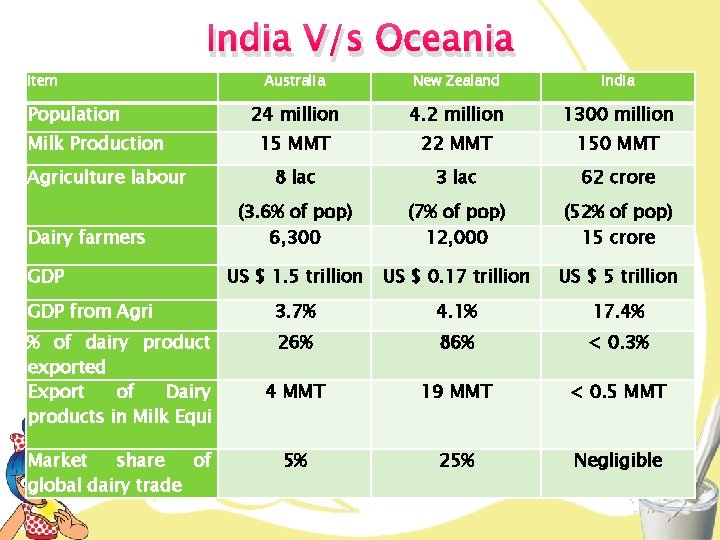
Item India V/s Oceania Australia New Zealand India 24 million 4. 2 million 1300 million 15 MMT 22 MMT 150 MMT 8 lac 3 lac 62 crore (3. 6% of pop) 6, 300 (7% of pop) 12, 000 (52% of pop) 15 crore US $ 1. 5 trillion US $ 0. 17 trillion US $ 5 trillion GDP from Agri 3. 7% 4. 1% 17. 4% % of dairy product exported Export of Dairy products in Milk Equi 26% 86% < 0. 3% 4 MMT 19 MMT < 0. 5 MMT 5% 25% Negligible Population Milk Production Agriculture labour Dairy farmers GDP Market share of global dairy trade
Expectations from our Government India is the largest producer and consumer of milk in the world. Milk is the largest Agricultural Crop with promising returns to farmers consistently since last 70 years India growing at faster pace then global milk production Food security and Livelihood are two most important issues for India. However, need a Cautious approach for FTA and any duty concession for Dairy Imports under Chapter 4 Policy support from Government for import protection
Value-chain control with farmers Maximum percentage of consumer’s rupee to farmers Remunerative prices to farmers Affordable nutrition Employment with dignity Sustainable income Value for money to consumers Role of dairy cooperatives Women Empowerment Technological & Marketing innovations
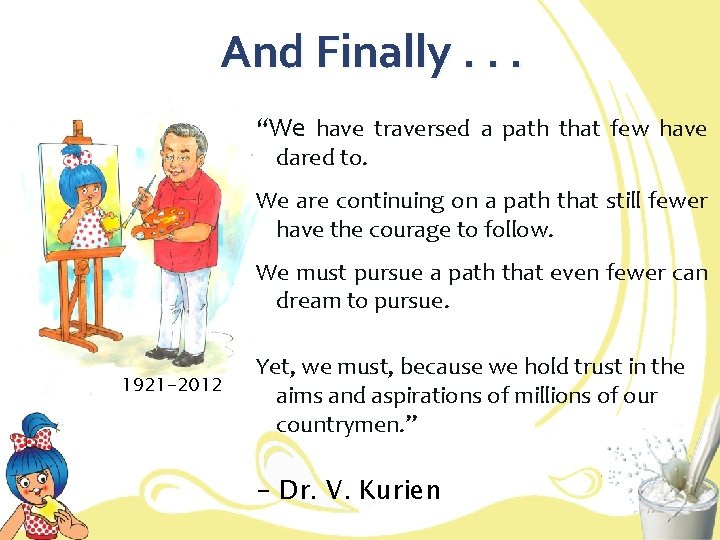
And Finally. . . “We have traversed a path that few have dared to. We are continuing on a path that still fewer have the courage to follow. We must pursue a path that even fewer can dream to pursue. 1921 -2012 Yet, we must, because we hold trust in the aims and aspirations of millions of our countrymen. ” - Dr. V. Kurien
Thank you ***** jayen@amul. coop
- Slides: 28