RC 997 Essentials of Cardiovascular Imaging Cardiac MR


 Perform")
 -balanced FFE® -Tru. FISP® -Fiesta® Fast GRE (16")


 Coronary Delayed Heart Disease, wall motion abnormality Delayed washout (@10 -20")
 1. Lack of contraction, and 2. Lack of recovery of")


 • Initially, there is myocardial necrosis (cell")

 1 st pass image 25")

 MO predicts significantly increased rate of cardiovascular complications after MI (unstable")
 NO MICROVASCULAR OBSTRUCTION Wu KC, et al. Circulation 1998; 97: 765")

 vs. true aneurysm")


 • Tumor • Inflammation – myocarditis")
 • Most common cause of sudden cardiac death <30 yrs old")


 Wu et")
 Fever, Patchy epicardial")


 • MRI is the most important noninvasive imaging")


- Slides: 81
RC 997: Essentials of Cardiovascular Imaging Cardiac MR Imaging: What You Need to Know David A. Bluemke, M. D. , Ph. D. Associate Professor, Clinical Director, MRI Departments of Radiology and Medicine Johns Hopkins University School of Medicine Baltimore, Maryland
Disclosures • Off-label: gadolinium MR of the heart and vessels, adenosine MRI • Research support: Epix Medical • Consultant: Bracco, Berlex • Speaker: Toshiba, GE Healthcare
Essentials of Cardiac MRI • MRI cardiac pulse sequences • Evaluation of myocardial masses • Evaluation of coronary heart disease • Evaluation of the right ventricle
Pulse sequences for cardiac MRI* Purpose Type Sequence morphology Black blood T 1, T 2 function cine double IR FSE/TSE steady state free precession (SSFP) tissue characterization gadolinium IR prepared gradient echo *”all” are gated to the cardiac cycle
“Double IR” black blood FSE Breath-hold high resolution, intracardiac detail • “T 1” weighted, where TR = 1 R-R interval • PD (TR 1000, TE 20), T 2 weighted (TR 2000, TE 80)
“Double IR” FSE: 1 st inversion pulse nonselective 180° inversion pulse
“Double IR” FSE: 2 nd inversion pulse 2 nd selective 180° inversion pulse
“Double IR” FSE: wait for the TI time • The inversion time for blood varies based on heart rate, from 400 -600 msec • If gadolinium present, use TI 200 msec
“Double IR”: null blood TI = 600 msec, inflowing blood now nulled (dark) Perform a gated FSE acquisition
Cine: Steady state free precession (SSFP) -balanced FFE® -Tru. FISP® -Fiesta® Fast GRE (16 sec) ALL THE SAME SSFP (6 sec) Real time SSFP T. Foo
SSFP Cine • fast gradient echo pulse sequence, balanced gradients in x, y, z • Contrast √T 2* / T 1
CINE images Retrospective gating Prospective Trigger continuous trigger on Rimaging wave, through cardiac for arrhythmias cycle
Imaging planes HLA short axis VLA 5 chamber
Essentials of Cardiac MRI • MR cardiac pulse sequences • Evaluation of myocardial mass • Evaluation of coronary heart disease • Evaluation of the right ventricle
Metastatic disease 20 x more common than primary cardiac tumors T 2 Leiomyosarcoma metastasis
Primary benign tumors: 1. Myxoma 41% 2. Lipoma 14% 3. Papillary fibroelastoma 13% 4. Rhabdomyoma 11%
Myxoma T 1 • interatrial septal attachment • 4: 1 left vs. right sided T 2
Myxoma • high T 2 signal
Lipomatous atrial septal hypertrophy T 1 fat sat • echogenic mass on echocardiogram • low association with arrhythmia, obesity
Right atrial lipoma T 1 fat sat • • T 1 High fat T 1 sat signal is diagnostic mass, well defined • • Associations: DDx: clot, proteinaceous obesity, steriod fluid, usemelanoma
T 1 SSFP Crista terminalis • normal RA finding, may be confused with clot or mass
Crista terminalis • Smooth ridge within the right atrium • Related to embryonic development of the right atrium
Primary malignant tumors: 1. Angiosarcoma 31% 2. Rhabodmyosarcoma 20% 3. Other sarcoma 16% 4. Mesothelioma 15% 5. Primary Lymphoma 6%
62 yo female, CHF and abnormal CT
CHF, soft tissue mass by CT Axial T 1 Axial T 2, fat sat
CHF, soft tissue mass by CT: angiosarcoma
Essentials of Cardiac MRI • MR cardiac pulse sequences • Evaluation of myocardial mass • Evaluation of coronary heart disease • Evaluation of the right ventricle
Myocardial Enhancement (MDE) Coronary Delayed Heart Disease, wall motion abnormality Delayed washout (@10 -20 min) of gadolinium in areas of infarction/scar. Gad, T 1
Non viable Myocardium (scar) 1. Lack of contraction, and 2. Lack of recovery of normal function after revascularization (CABG). Gad, T 1
Chronic MI • Images every 1 minute after gadolinium injection M. Friedrich, AHA 2002
Use an inversion pulse to suppress normal myocardium • Optimal TI time depends on clearance of gadolinium from the normal myocardium • Typical range: 175 -250 msec • Lower TI time when more gad is present: - decreased renal function - CHF
“TI Scout” Single breath-hold, 50 phases, 20 msec temporal resolution
“TI Scout” Images every 20 msec
Phase Sensitive Inversion Recovery Magnitude Reconstruction TI 100 150 200 250 Phase Sensitive Reconstruction TI 100 150 Arai, AHA 2002
Key factor: transmurality of the gadolinium enhancement 25 -50% 50 -75% 100% Kim et al. NEJM 2001: 343
MRI is higher resolution than SPECT TTC MRI SPECT Canine model Wagner A. et al. , Lancet. 2003 Feb 1; 361(9355): 374 -9
MRI is more sensitive than SPECT TTC MRI SPECT Wagner A. et al. , Lancet. 2003 Feb 1; 361(9355): 374 -9
MR Viability imaging aids in pre-surgical planning SSFP short axis Gad- delayed
Left ventricular remodeling after MI reduces effectiveness of contraction
Hibernating myocardium: MR Viability imaging aids in bypass surgery or stent pre-surgical planning Gadolinium viability images
Coronary Heart Disease 1. No delayed enhancement = no myocardial scar/ fibrosis. 2. Transmural delayed enhancement = no functional recovery even after treatment by bypass or stent.
Coronary Heart Disease: Acute coronary blockage (infarct) • Initially, there is myocardial necrosis (cell death) than enhances with gadolinium. • If the blockage is not rapidly opened and the patient survives, the capillary blood supply may also be damaged.
Q-Wave Acute MI • Images every 1 minute after gadolinium injection • Capillary blockage is termed “microvascular obstruction” images every 1 minute after gadolinium M. Friedrich, AHA 2002
Acute infarct with microvascular obstruction (at the infarct core) 1 st pass image 25 sec Filling in Infarct 40 sec 10 min
Acute LAD infarction 1 st pass delay
Microvascular Obstruction (MO) MO predicts significantly increased rate of cardiovascular complications after MI (unstable angina, reinfarction, CHF, embolic stroke, death). Wu KC, et al. Circulation 1998; 97: 765 -772
Microvascular Obstruction (MO) NO MICROVASCULAR OBSTRUCTION Wu KC, et al. Circulation 1998; 97: 765 -772
Examples: Coronary Heart Disease
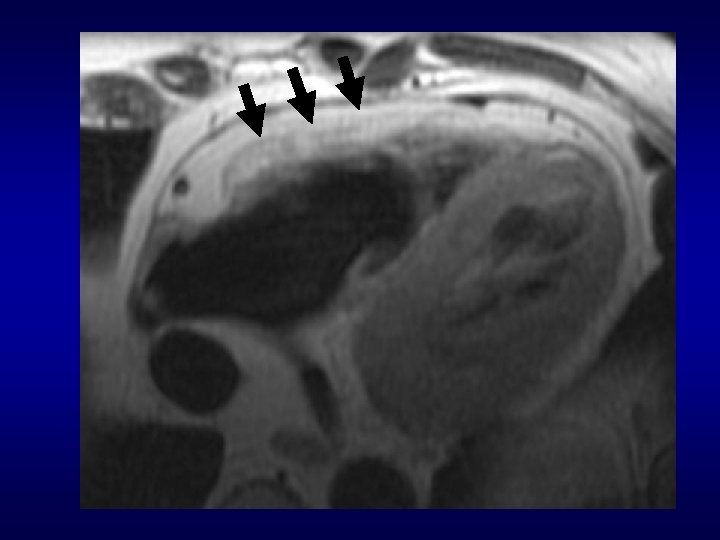
New onset CHF pseudoaneurym (rupture) vs. true aneurysm
True LV aneurysm + clot due to old infarct
EF LV 9% aneurysm/ and clot LVinfarct volume 820 ml
Hibernating Myocardium 16%EF
Delayed Enhancement is nonspecific • Fibrosis (MI, hypertrophy) • Tumor • Inflammation – myocarditis • Amyloid • Chagas disease (fibrosis) • Sarcoid
Hypertrophic Cardiomyopathy (HOCM) • Most common cause of sudden cardiac death <30 yrs old • Obstruction of outflow tract • Genetic abnormality: sarcometric contractile proteins • Autosomal dominant
HOCM - pathophysiology © Mayo Clinic Systolic anterior motion of the mitral valve, resulting in aortic outflow obstruction
HOCM: MRI shows collagen deposition associated with “myocardial disarray” Cine Delayed contrast
2 mths Post Treatment Pre Treatment HOCM: minimally invasive Rx (Et. OH) Wu et al. , Johns Hopkins
Acute Onset Ventricular Tachycardia, Acute Myocarditis (courtesy, Malaise J. Freeby, MD) Fever, Patchy epicardial enhancement, noncoronary distribution
Prior Myocarditis with midwall 25 yo, acute chest pain 2 mosscar ago
Cardiac Sarcoidosis Patchy myocardial enhancement, especially septal/ basal/ epicardial regions Acute Sarcoidosis: Hunold, J. Barkhausen, AJR 2005; 184
Progressive RV failure Giant Cell Myocarditis
Essentials of Cardiac MRI • MR cardiac pulse sequences • Evaluation of myocardial masses • Evaluation of coronary heart disease • Evaluation of the right ventricle
Arrhythmogenic right ventricular dysplasia/ cardiomyopathy (ARVD/C) • MRI is the most important noninvasive imaging test for diagnosis. • 71% of cases referred for 2 nd opinion were overdiagnosed by MRI* (? high sensitivity, low specificity) *Bomma et al, J Cardiovasc Electrophysiol 2004; 15
Arrhythmogenic RV Dysplasia • Fibrofatty infiltration of RV resulting in ventricular tachycardia • Palpitations, syncope, sudden death • Age 33 ± 14 yrs. • 30 -50% cases are familial. MRI used to screen family members.
“Mc. Kenna” Criteria: 2 major, 1 major+2 minor, 4 minor* Br Heart J 1994: 71
ARVD MRI Diagnostic Findings 1. Abnormal RV morphology 2. Abnormal RV function 3. Abnormal signal intensity (fat) 4. Enhancement in the RV wall (fibrosis)
Bluemke et al. , Cardiology, 2003: 99; 153
ARVD: findings on axial images Aortic valve level Mid ventricular level 38 yo F, athlete with ventricular tachycardia
RV enlargement: differential diagnosis in the setting of suspected ARVD 1. Normal variant (young age) 2. Pulmonary Hypertension 3. PAPVR 4. Intracardiac shunt or valve dysfunction
RV and Pulmonary outflow tract enlarged, poor function
Right ventricular aneurysm Typical ARVD
37% of normal volunteers
Tissue Characterization: RV fat
Right ventricle fat
Fat alone is insufficient for ARVD/C diagnosis: not arrhythmogenic LV EF 68. 5% RV EF 71% EDV 120 ml EDV 124 ml
Detection of RV fibrosis in ARVD • Delayed enhancement due to fibrosis present in 60% of ARVD patients. • All patients had other RV abnormalities (wall motion, morphology). Tandri, JACC 2005; 45
RV delayed enhancement *ICD, investigational
RV delayed enhancement
Essentials of Cardiac MRI • MR cardiac pulse sequences • Evaluation of myocardial mass • Evaluation of coronary heart disease • Evaluation of the right ventricle www. heart. MRI. com
Acknowledgments • João Lima, MD • Matthias Friedrich, MD • Dara Kraitchman, Ph. D • Andrew Arai, MD • Tom Foo, Ph. D • Carlos Rochitte, MD • Kathy Wu, MD