RBA ResultsBased Accountability The Fiscal Policy Studies Institute

RBA Results-Based Accountability The Fiscal Policy Studies Institute raguide. org & resultsaccountability. com SCORECARD Book & DVD Orders amazon. com clearimpact. com

RBA in a Nutshell 2– 3 -7 2 - kinds of accountability plus language discipline Results & Indicators Population Performance accountability measures Performance kinds of performance measures. accountability How much did we do? 3 - How well did we do it? Is anyone better off? 7 - questions from ends to means in less than Baselines & Turning the Curve an hour.

Results-Based Accountability is made up of two parts: Population Accountability is about the well-being of WHOLE POPULATIONS for Communities – Counties – States Nations Performance Accountability is about the well-being of CUSTOMER POPULATIONS for Programs – Agencies – Service Systems

Population Accountability

CARDIFF, WALES Community Outcomes 1. People in Cardiff are healthy 2. Cardiff has a clean attractive and sustainable environment 3. People in Cardiff are safe and feel safe 4. Cardiff has a thriving and prosperous economy 5. People in Cardiff achieve their full potential. 6. Cardiff is a great place to live, work and play. 7. Cardiff has a fair, just and inclusive society.


Getting from Talk to Action
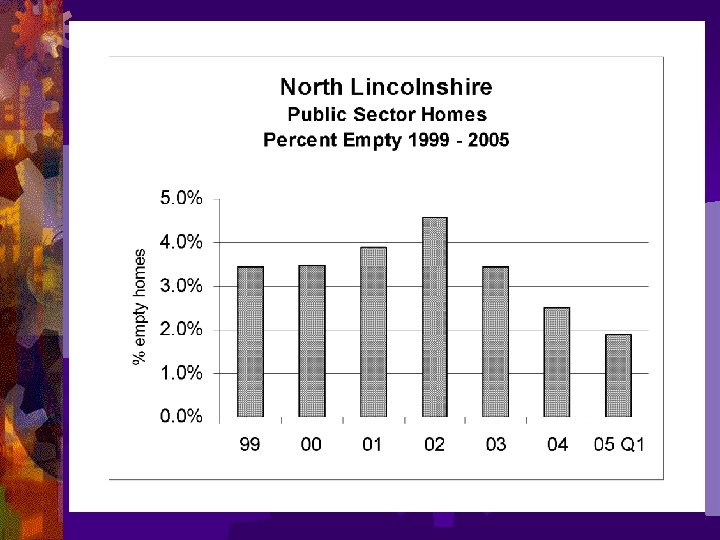
 Experience Cm of Water BASELINE Measure Not")
Leaking Roof (Results thinking in everyday life) Experience Cm of Water BASELINE Measure Not OK ? Fixed Turning the Curve Story behind the baseline (causes) Partners What Works Action Plan # 2

Results / Outcomes Experience Indicators Baseline & Story Information & Research Agenda CAUSES Information & Research Agenda SOLUTIONS

75 people per day 45 people per day MADD 28 people per day 2010

Reboun d

Newcastle, UK Nov 08 – Jan 09 8. 5

Performance Accountability
 did")
Performance Measures Quantity Quality How Muc h How Well did we do? (#) did we do it? (%)

Performance Measures Effort How hard did we try? Effect Is anyone better off?

Performance Measures Effort How Well Muc h Effect

Output Effect Input Effort Performance Measures Quantity Quality How much service did we deliver? How well did we deliver it? How much change / effect did we produce? What quality of change / effect did we produce?

Effect Effort Performance Measures Quantity Quality How much did we do? How well did we do it? Is anyone better off? # %

Effort Education Quantity Quality How much did we do? How well did we do it? Number of students Studentteacher ratio Effect Is anyone better off? Number of high school graduates Percent of high school graduates

Effort Drug/Alcohol Treatment Program Quantity Quality How much did we do? How well did we do it? Number of persons treated Percent of staff with training/ certification Effect Is anyone better off? Number of clients off of alcohol & drugs - at exit - 12 months after exit Percent of clients off of alcohol & drugs - at exit - 12 months after exit

Primary v. Secondary Direct v. Indirect Internal v. External LR UR Baseline & Story Information & Research Agenda CAUSES Information & Research Agenda SOLUTIONS
")
Northside Achievement Zone NAZ 2019 Results Report (Sondra Samuels Director)

Putting Population and Performance Accountability TOGETHER

THE LINKAGE Between POPULATION and PERFORMANCE POPULATION ACCOUNTABILITY POPULATION RESULTS Strong and Stable Families Percent of parents earning a living wage PERFORMANCE ACCOUNTABILITY Job Training Program # persons receiving training Unit cost person trained # who get living wage jobs % who get living wage jobs Contribution relationship CUSTOMER RESULTS
 DEMONSTRATING the CONTRIBUTION of complex change efforts… requires 3")
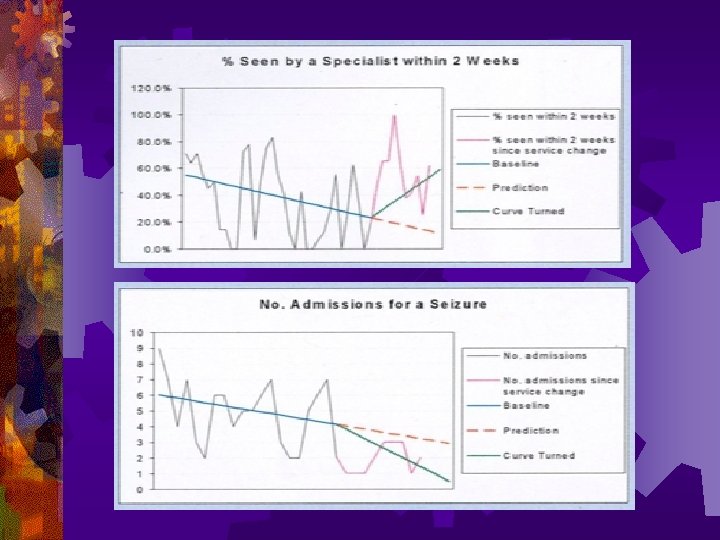
Curve Turn Evaluation Methodology (CTEM) DEMONSTRATING the CONTRIBUTION of complex change efforts… requires 3 A Curve to Turn 4 Bonus: a background elements: trend stayed the same or got worse. 2 …and it had a timely relationship to…. 3 …. a turn in the curve. 1 We tried a bunch of stuff that had a credible chance of making a difference … c FPSI

Reboun d

Maryland Foster Care Paid Cases and State Fund Expenditure FY 1972 to FY 1986 Family Preservation Program implemented here 16 25 $24. 2 Million Saved 14 12 Cost Millions Cases Thousands TREND ACTUAL 20 CASES 10 TREND 11, 400 child years in Foster Care saved 8 15 COST ACTUAL 6 72 4 73 74 75 76 77 78 79 80 81 82 83 Source: Maryland Department of Human Resources Research and design by Mark Friedman and Joan Peterson 84 85 86 10

RBA in a Nutshell 2– 3 -7 2 - kinds of accountability plus language discipline Results & Indicators Population Performance accountability measures Performance kinds of performance measures. accountability How much did we do? 3 - How well did we do it? Is anyone better off? 7 - questions from ends to means in less than Baselines & Turning the Curve an hour.

Never be afraid to try something new. Remember that a lone amateur built the Ark. A large group of professionals built the Titanic. - Dave Barry

THANK YOU ! SCORECARD Book & DVD Orders amazon. com clearimpact. com
- Slides: 33