RBA ResultsBased Accountability The Fiscal Policy Studies Institute

RBA Results-Based Accountability The Fiscal Policy Studies Institute raguide. org & resultsaccountability. com SCORECARD Book & DVD Orders amazon. com clearimpact. com

SIMPLE COMMON SENSE PLAIN LANGUAGE MINIMUM PAPER USEFUL

Results-Based Accountability is made up of two parts: 1. Population Accountability is about the well-being of WHOLE POPULATIONS for Communities – Counties – States - Nations 2. Performance Accountability is about the well-being of CUSTOMER POPULATIONS for Programs – Agencies – Service Systems CA/CN

Results-Based Accountability COMMON LANGUAGE COMMON SENSE COMMON GROUND

Common Language

THE LANGUAGE TRAP Too many terms. Too few definitions. Too little discipline Benchmark Outcome Result Modifiers Indicator Measurable Core Urgent Qualitative Priority Programmatic Targeted Performance Incremental Strategic Systemic Measure Goal Objective Target Lewis Carroll Center for Language Disorders Core qualitative strategic Make up your own jargon. Measurable urgent systemic

DEFINITIONS RESULT or OUTCOME 3. A condition of well-being for Population children, adults, families or communities. Children born healthy, Children ready for school Safe communities, communities Sustainable environment, environment Prosperous Economy INDICATOR or BENCHMARK 4. A measure which helps quantify the achievement of a result. Performance Rate of low-birthweight babies, Percent ready at K entry, rate air quality index, index unemployment rate crime rate, PERFORMANCE MEASURE 5. A measure of how well a program, agency or service system is working. 6. How much did we do? Three types: 7. How well did we do it? 8. Is anyone better off? = Customer Results

Population From Ends to Means From Talk to From to Action RESULT ENDS Performance INDICATOR PERFORMANCE MEASURE Customer result = Ends Service delivery = Means MEAN S

IS IT A RESULT, INDICATOR OR PERFORMANCE MEASURE? RESULT 1. Safe Community INDICATO 2. Crime rate R PERF. 3. Average police response time MEASURE RESULT 4. Healthy People INDICATO 5. % of youth overweight or obese R RESULT 6. People have living wage jobs and income INDICATO R 7. % of people with living wage jobs and PERF. MEASURE income |
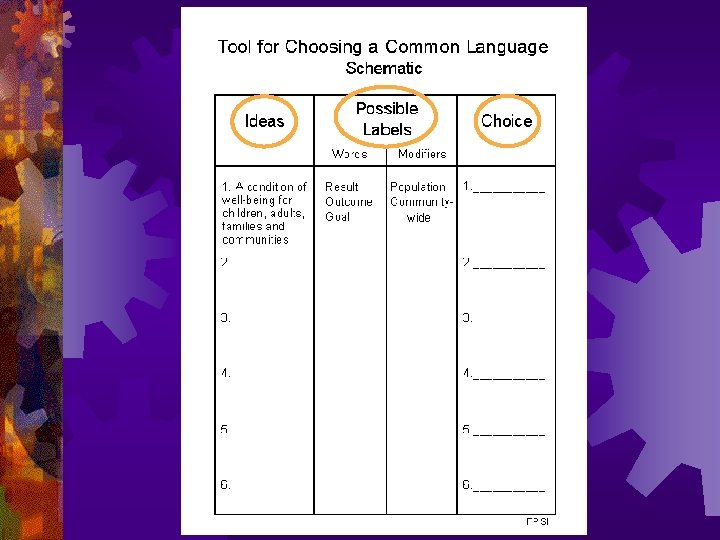

Translation Guide/Rosetta Stone Not the Language Police Ideas Group 1 Group 2 1. A condition of well-being for children, adults, families & communities RESULT OUTCOME 2. 3. etc. TRANSLATION Back to the Idea Group 3 e tc. GOAL

Results – Indicators – Performance Measures in Amharic, Cambodian, Laotian, Somali, Spanish, Tigrigna, Vietnamese

The Three L’s of Success in any serious change effort 1. Leadership 2. Language Searching for the 3 rd L Leverage Latitude Levity Lithium Luggage

Population Accountability

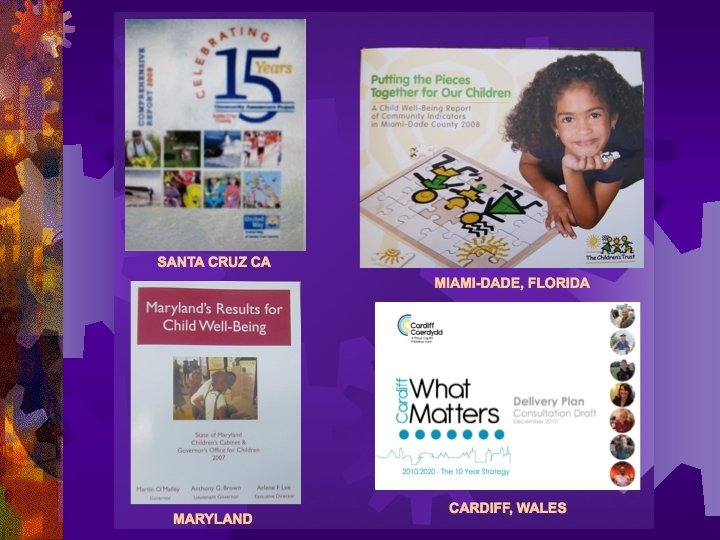
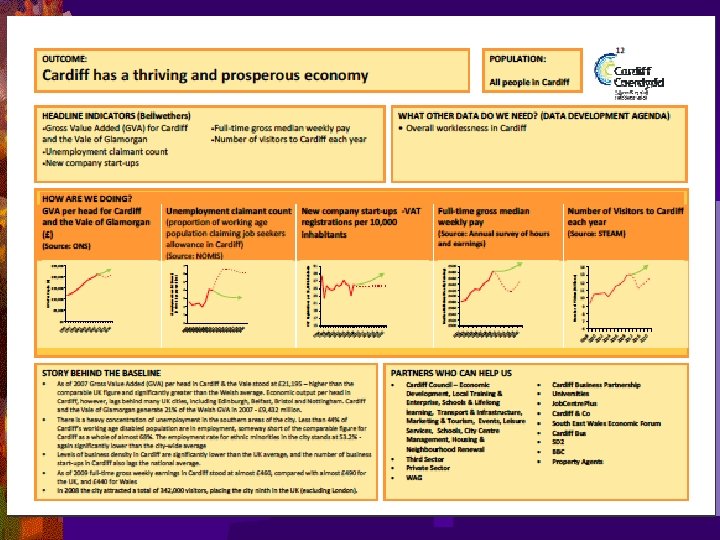
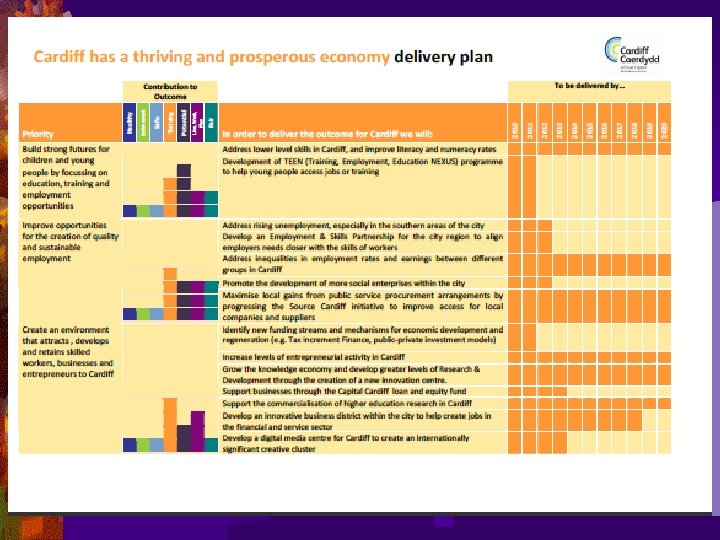
CARDIFF, WALES Community Outcomes 1. People in Cardiff are healthy 2. Cardiff has a clean attractive and sustainable environment 3. People in Cardiff are safe and feel safe 4. Cardiff has a thriving and prosperous economy 5. People in Cardiff achieve their full potential. 6. Cardiff is a great place to live, work and play. 7. Cardiff has a fair, just and inclusive society.
 1. Vermont has a prosperous economy. 2. Vermonters are")
VERMONT Population Outcomes (Act 186) 1. Vermont has a prosperous economy. 2. Vermonters are healthy. 3. Vermont’s environment is clean and sustainable. 4. Vermont’s communities are safe and supportive. 5. Vermont’s families are safe, nurturing, stable, and supported. 6. Vermont’s children and young people achieve their potential. 7. Vermont’s elders and people with disabilities and people with mental conditions live with dignity and independence in settings they prefer. 8. Vermont has open, effective, and inclusive government at the State and local levels.
 1. Vermont has a prosperous economy. 2. Vermonters are")
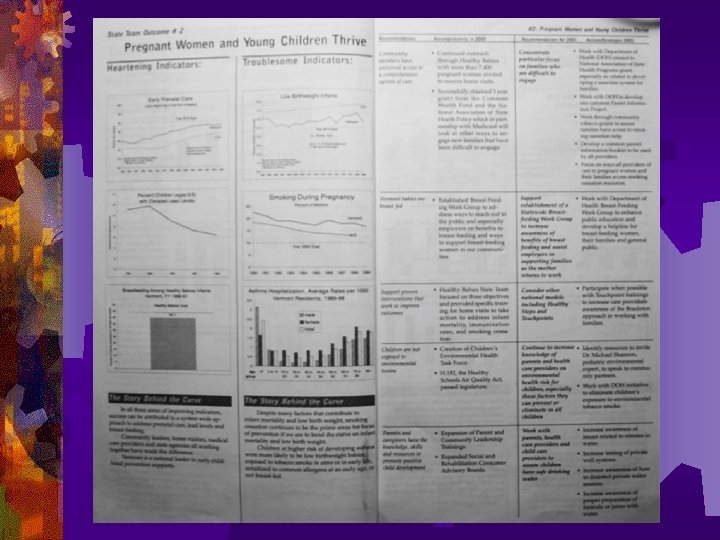
VERMONT Population Outcomes (Act 186) 1. Vermont has a prosperous economy. 2. Vermonters are healthy. 3. Vermont’s environment is clean and sustainable. 4. Vermont’s communities are safe and supportive. 5. Vermont’s families are safe, nurturing, stable, and supported. 6. Vermont’s children and young people achieve their potential. (A) Pregnant women and young people thrive. (B) Children are ready for school. (C) Children succeed in school. (D) Youth choose healthy behaviors. (E) Youth successfully transition to adulthood. 7. Vermont’s elders and people with disabilities and people with mental conditions live with dignity and independence in settings they prefer. 8. Vermont has open, effective, and inclusive government at the State and local levels.


Getting from Talk to Action
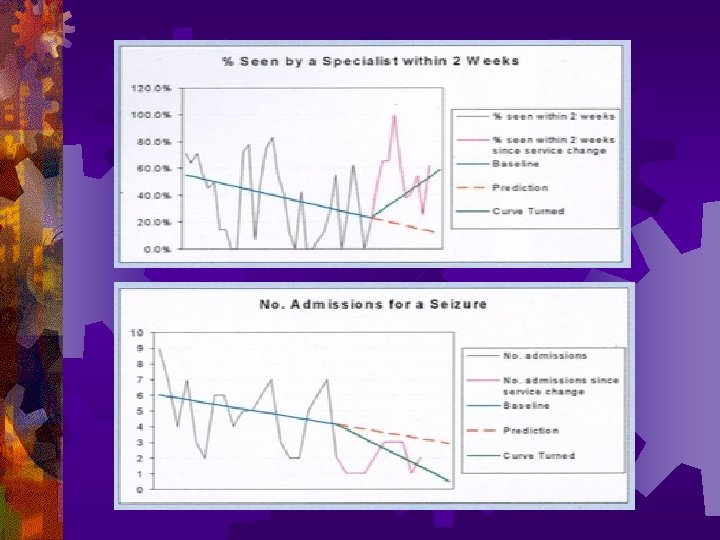
 Experience Cm of Water 9. BASELINE Measure")
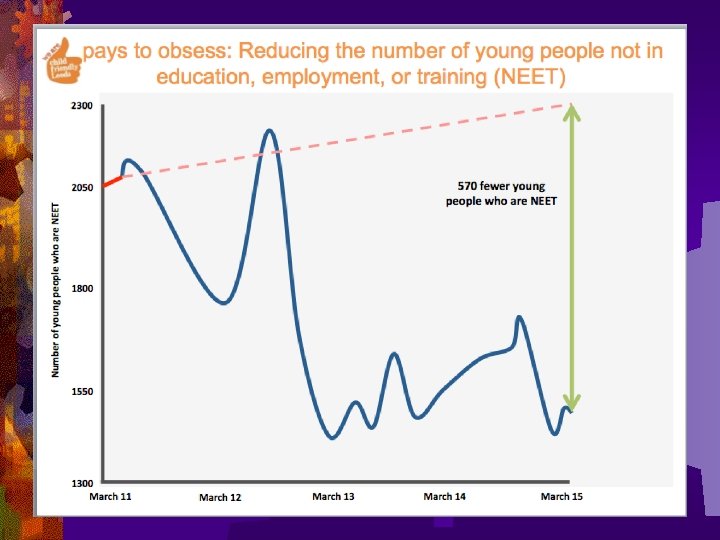
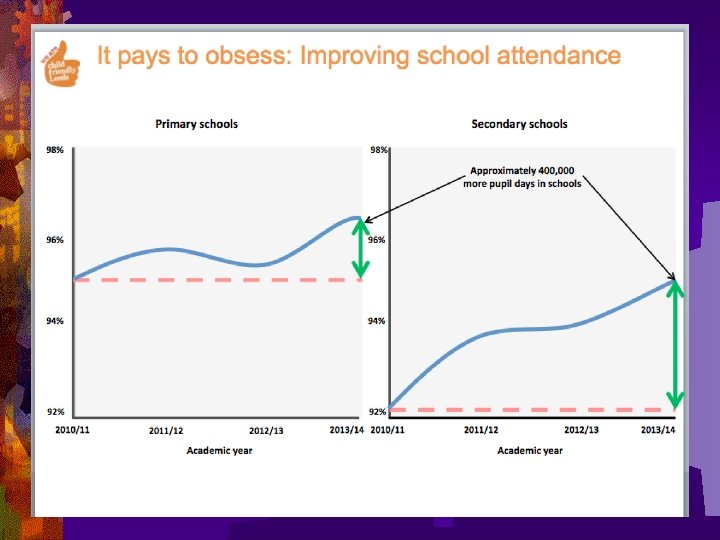
Leaking Roof (Results thinking in everyday life) Experience Cm of Water 9. BASELINE Measure Not OK ? Fixed 10. Turning the Curve Story behind the baseline (causes) Partners What Works Action Plan # 2 Action Plan

Results / Outcomes Experience Indicators Baseline & Story

Criteria for Choosing Indicators as Primary vs. Secondary Measures Communication Power Does the indicator communicate to a broad range of audiences? Proxy Power Does the indicator say something of central importance about the result? Does the indicator bring along the data HERD? Data Power Quality data available on a timely basis.

Choosing Indicators Worksheet Safe Outcome or Result____________ Community Candidate Indicators Measure 1 Measure 2 Measure 3 Measure 4 Measure 5 Measure 6 Proxy Power Data Power H M L H H L Communicat ion Power H H H Measure 7 Data Developme Measure 8 nt Agenda

Three Part Indicator List for each Result Part 1: Primary Indicators ● 3 to 5 “Headline” Indicators ● What this result “means” to the community ● Meets the Public Square Test Part 2: Secondary Indicators ● Everything else that’s any good (Nothing is wasted. ) ● Used later in the Story behind the Curve Part 3: Data Development ● New data Agenda ● Data in need of repair (quality, timeliness etc. )

The Matter of Baselines H M OK? L Point to Point Histor y Forecas t Turning the Curve Baselines have two parts: history and forecast

75 people per day 45 people per day MADD 28 people per day 2010

Reboun d

Newcastle, UK Nov 08 – Jan 09 8. 5

Hull, UK "Woundings"

“If I include you, you will be my partner. If I exclude you, you will be my judge. ” - Rosell

Performance Accountability

“All performance measures that have ever existed for any program in the history of the universe involve answering two sets of interlocking questions. ”

Performance Measures Quantity Quality How Muc h How Well did we do? ( # ) did we do it? ( % )

Performance Measures Effort How hard did we try? Effect Is anyone better off?

Performance Measures Effort How Well Muc h Effect

Output Input Effect Effort Performance Measures Quantity Quality How much service did we deliver? How well did we deliver it? How much What quality change / effect of change / did we effect produce? did we produce?

Performance Measures Effect Effort Quantity How much did we do? Quality How well did we do it? Is anyone better off? # %

Effect Effort Education Quantity Quality How much did we do? How well did we do it? Number of students Studentteacher ratio Is anyone better off? Number of high school graduates Percent of high school graduates

Effect Effort Education Quantity Quality How much did we do? How well did we do it? Number of students Studentteacher ratio Is anyone better off? Number of 9 th graders who graduate on time and enter college or employment after graduation Percent of 9 th graders who graduate on time and enter college or employment after graduation

Effect Effort Pediatric Practice Quantity Quality How much did we do? How well did we do it? Number of children treated Percent of patients waiting less than 30 min in the waiting room Is anyone better off? # children fully immunized % children fully immunized (in the practice)

Effect Effort Drug/Alcohol Treatment Program Quantity Quality How much did we do? How well did we do it? Number of persons treated Percent of staff with training/ certification Is anyone better off? Number of clients off of alcohol & drugs - at exit - 12 months after exit Percent of clients off of alcohol & drugs - at exit - 12 months after exit

Effect Effort Fire Department Quantity Quality How much did we do? How well did we do it? Number of responses Response Time Is anyone better off? # of fires % of fires kept to room of origin

Effect Effort General Motors Quantity Quality How much did we do? How well did we do it? # of production hrs Employees per vehicle produced # tons of steel Is anyone better off? # of cars sold $ Amount of Profit $ Car value after 2 years Source: USA Today % Market share Profit per share % Car value after

Effect Effort Not All Performance Measures Are Created Equal Quality Quantity How much did we do? How well did we do it? Least Also Very Important Is anyone better off? Most Important

Effect Effort The Matter of Control Quantity Quality How much did we do? How well did we do it? Most Control Is anyone better off? Least Control PARTNERSH
 Total")
RBA Categories Account for All Performance Measures (in the history of the universe) Total Quality Mgmt (TQM) Cost (quality service delivery & customer benefit) Effect Proces s Inpu t Product Output Imp act Quality Effort Quantit y Benefit value Efficienc Admin overhead, Unit Efficiency, Admin overhead, Unit cost y cost Staffing ratios, Staff turnover Staff morale, Access, Waiting time, Waiting lists, Worker safety Customer Satisfaction Cost / Benefit ratio Return on investment Client results or client outcomes Effectivene ss Value added Productivit
 Total")
RBA Categories Account for All Performance Measures (in the history of the universe) Total Quality Mgmt (TQM) Cost (quality service delivery & customer benefit) Effect Proces s Inpu t Product Output Imp act Quality Effort Quantit y Benefit value Efficiency, Admin overhead, Unit cost Staffing ratios, Staff turnover Staff morale, Access, Waiting time, Waiting lists, Worker safety Customer Satisfaction Cost / Benefit ratio Return on investment Client results or client outcomes Effectivene ss Value added Productivit
 Total")
RBA Categories Account for All Performance Measures (in the history of the universe) Total Quality Mgmt (TQM) Cost (quality service delivery & customer benefit) Effect Proces s Inpu t Product Output Imp act Quality Effort Quantit y Benefit value Efficiency, Admin overhead, Unit cost Staffing ratios, Staff turnover Staff morale, Access, Waiting time, Waiting lists, Worker safety 1. Did we * Customer treat you Satisfaction well? Cost / Benefit ratio 2. Did we help you Return on investmentwith your problems? Client results or client outcomes Effectivene ss Value added Productivit * World’s simplest complete customer satisfaction survey
 Total")
OBA Categories Account for All Performance Measures (in the history of the universe) Total Quality Mgmt (TQM) Cost (quality service delivery & customer benefit) Effect Proces s Inpu t Product Output Imp act Quality Effort Quantit y Benefit value Efficiency, Admin overhead, Unit cost Staffing ratios, Staff turnover Staff morale, Access, Waiting time, Waiting lists, Worker safety Customer Satisfaction Cost / Benefit ratio Return on investment Client results or client outcomes Effectivene ss Value added Productivit

The Matter of Use 1. The first purpose of performance measurement is to IMPROVE PERFORMANCE. 2. Avoid the performance measurement equals punishment trap. ● Create a healthy organizational environment. ● Start small.

CHARTS on the WALL

Advanced Baseline Display Create targets only when they are: FAIR & USEFUL Aspiration NOT Punishment Goal (line) Target or Standard Avoid publicly declaring targets by year if possible. ● x Your Baseline Comparison Baseline Instead: Count anything better than baseline as progress.

Performance Accountability Types of Measures found in each Quadrant How much did we How well did we do it? do? # Clients/custome rs # Activities (by served type of activity) # # fully trained, % clients seen in their own language, worker safety, unit cost % Activity-specific measures e. g. % timely, % clients completing activity, % correct and complete, % meeting standard Is anyone better off? % Skills / # # % Common e. g. client staff ratio, workload ratio, staff measures turnover rate, staff morale, % staff Point in Time vs. 2 Point Comparison # Knowledge % Attitude / (e. g. parenting skills) Opinion % Behavior (e. g. toward drugs) % (e. g. school attendance) % Circumstance (e. g. working, in stable housing)

Performance Accountability Types of Measures found in each Quadrant How much did we How well did we do it? do? # Clients/custome rs # Activities (by served type of activity) # # % Common e. g. client staff ratio, workload ratio, staff measures turnover rate, staff morale, % staff fully trained, % clients seen in their own language, worker safety, unit cost % Activity-specific measures e. g. % timely, % clients completing activity, % correct and complete, % meeting standard Is anyone better off? % Skills / Point in Time vs. 2 Point Comparison Knowledge % Attitude / (e. g. parenting skills) Opinion % Behavior (e. g. toward drugs) (e. g. school attendance) % Circumstance (e. g. working, in stable housing)

Service: School Hospital Job Training Fire Department _________________ How much did we How well did we do it? do? Primary persons patients students # customers trained Primary activity hours of diagnostic alarms # job courses instruction tests responded to Unit cost Workload ratio % of ___x___ that happen on time Is anyone better If your service works really well, off? how are your customer's better off? # students who persons who patients who % fires kept to graduate get jobs fully recover room of origin

Effect Effort Choosing Headline Measures and the Data Development Agenda Quantity Quality How much did we do? How well did we do it? # Measure 1 -------------- % Measure 8 -------------- # Measure 2 -------------- % Measure 9 -------------- # Measure 3 -------------- % Measure 10 ------------- # Measure 4 -------------- % Measure 11 ------------- # Measure 5 -------------- % Measure 12 ------------- Is anyone better off? # Measure 6 ------------% Measure 13 --------------# Measure 15 -----------% Measure 15 ----------# Measure 7 ------------% Measure 14 --------------------# Measure 16 -----------% Measure 16 ----------------# Measure 17 -------------- % Measure 17 -------------- # Measure 18 -------------- % Measure 18 -------------- # Measure 19 -------------- % Measure 19 -------------- # Measure 20 ----------- % Measure 20 ----------- #3 DDA #2 Headline #2 DDA #3 Headline #1 DDA

Primary v. Secondary Direct v. Indirect Internal v. External LR UR Baseline & Story


Select 3 to 5 Performance Measures ACROSS THE BOTTOM OF THE ORG CHART 3 - 5 3 - 5 3 - 5 20 – 60 – 20 Rule 3 - 5

Putting Population and Performance Accountability TOGETHER

THE LINKAGE Between POPULATION and PERFORMANCE POPULATION ACCOUNTABILITY POPULATION Healthy Births RESULTS Rate of low birth-weight babies Safe & Stable Families Rate of child abuse and neglect Children Ready for School Percent fully ready per K-entry assessment PERFORMANCE ACCOUNTABILITY Child Protective Services # of investigatio ns completed % initiated within 24 hrs of report # repeat Abuse/Negle ct % repeat Abuse/Negle ct CUSTOMER RESULTS Contributio n relationship Alignment of measures Appropriate responsibili ty

Performance measure Population Indicator

Population Accountability Result: to which you contribute to most directly. Indicators: Every time you present your program, Use a two-part approach. Story: Partners: What would it take? : Your Role: as part of a larger strategy. Your Role Performance Accountability Program: Performance measures: Story: Partners: Action plan to get better:

Population Accountability Result: to which you contribute to most directly. Indicators: Every time you present your program, Use a two-part approach. Story: Partners: What would it take? : Your Role: within the larger strategy. Your Role Performance Accountability Program: Performance measures: Story: Partners: Action plan to get better:

Population Accountability Result: to which you contribute to most directly. Indicators: Every time you present your program, Use a two-part approach. Shortcu Story: t Partners: What would it take? : Your Role: as part of a larger strategy. Your Role Performance Accountability Program: Performance measures: Story: Partners: Action plan to get better:

Different Kinds of Progress 1. Data a. Population indicators Actual turned curves: movement for the better away from the b. Program performance measures: baseline. customer progress and better service: How much did we do? How well did we do it? Is anyone better off? 2. Accomplishments: Positive activities, not included above. 3. Stories behind the statistics that show individuals are better off.

Board of Directors Meeting AGENDA 1. New data 2. New story behind the curves 3. New partners 4. New information on what works. 5. New information on financing 6. Changes to action plan and budget 7. Adjourn

SUMMARY

RBA in a Nutshell 2 – 3 - 7 2 - kinds of plus language accountability discipline Population Results & Indicators Performance accountability measures Performance kinds of performance measures. accountability How much did we do? 3 - How well did we do it? Is anyone better off? 7 - questions from ends to means in less than Baselines & Turning the Curve an hour.

THANK YOU ! SCORECARD Book - DVD Orders amazon. com resultsleadership. org

“Data is the unblinking eye of reform. ” Barbary Curley, Area Director, Hyde Park Office, Boston

EXERCISES

Next Generation CONTRACTING

Next Generation Contracting Contract Provisions Provision 1. Specify the 3 to 5 most important performance measures (from the How well did we do it? and Is anyone better off? categories). Provision 2. Specify that the contractor will use a continuous improvement process (the RBA 7 Questions). Provision 3. Specify how the funder and contractor will work in partnership to maximize LR customer results (quarterly meetings using the 7 questions as the agenda). Provision 4. Specify that the funder will work with the funding community to simplify and standardize contracting and performance reporting.

Next Generation Contracting Contract Provisions Provision 5: : Clear articulation of role in population/community well-being using the language of contribution not attribution. Provision 6: 10% for quality management and administration. Provision 7: Multi-year funding using 3 year rolling contracts Provision 8: Use of targets that are fair and useful. Provision 9: Fund flexibility and virtual funding pool: transfer of up to 10% across line items and program lines.

EXERCISES

Indianapolis Selected Indicator Baselines April 4, 2017

Kids Count Data Center

Kids Count Data Center

2016 2018 Kids Count Data Center

2019 2020 Kids Count Data Center

Kids Count Data Center

Creating a Working Baseline from Group Knowledge Indicator or Performance Measure 65% ng Forecasti ng Backcasti Now Not OK?

Turn the Curve Exercise: Population Well-being 5 min: Starting Points - timekeeper and reporter - geographic area - two hats (yours plus partner’s) 10 min: Baseline - pick a result and a curve to turn - forecast (to 2018) – OK or not OK? 15 min: Story behind the baseline - causes/forces at work - information & research agenda part 1 - causes Two pointers 15 min: What works? (What would it take? ) to action - what could work to do better? - each partners contribution - no-cost / low-cost ideas - information & research agenda part 2 – what works 10 min: Report convert notes to one page

4. ----- Off the Wall ONE PAGE Turn the Curve Report: Population Result: ________ Indicator Baseline Indicator (Lay Definition) Story behind the baseline --------------------------- (List as many as needed) Partners --------------------------- (List as many as needed) Three Best Ideas – What Works 1. ------------- 2. -------------- Sharp Edges 3. -----No-cost / low-cost 4. ----- Off the Wall

Turn the Curve Exercise – Lessons Talk to Action in an hour 1. How was this different from other processes? What worked and what didn’t work? 2. Why did we ask for: a. Results before indicators? b. Forecast? c. Story? d. No cost / low cost? e. Two hats? f. Crazy idea? g. Only 3 best ideas? 3. Do you think a lay audience could understand the reports? 4. How many think you could lead this exercise with a small group? (2+ curves at the same time)

Next Steps What’s one thing I can personally do with what I learned today?

Resources raguide. org resultsaccountability. com clearimpact. com RBA Facebook Group SCORECARD Book & DVD Orders amazon. com clearimpact. com

EVALUATION

THANK YOU ! SCORECARD Book - DVD Orders amazon. com resultsleadership. org


Compliment to Traditional Evaluation Methods: DEMONSTRATING the CONTRIBUTION of complex change efforts… requires 3 A Curve to Turn elements: 4 Bonus: a background trend stayed the same or got worse. 2 …and it had a timely relationship to…. 3 …. a turn in the curve. 1 We tried a bunch of stuff that had a credible chance of making a difference … c FPSI

Reboun d

Turn the Curve Exercise: Program Performance 5 min: Starting Points - timekeeper and reporter - identify a program to work on - two hats (yours plus partner’s) 10 min: Performance measure baseline - choose 1 measure to work on – from the lower right quadrant 15 min: - forecast (to 2017) – OK or not OK? Story behind the baseline - causes/forces at work - information & research agenda part 1 - causes Two pointers 15 min: What works? (What would it take? ) to action - what could work to do better? - each partners contribution - no-cost / low-cost ideas - information & research agenda part 2 – what works 10 min: Report convert notes to one page

4. ----- Off the Wall ONE PAGE Turn the Curve Report: Performance Program: ________ Performance Measure (Lay definition) Performan ce Measure Baseline Story behind the baseline --------------------------- (List as many as needed) Partners --------------------------- (List as many as needed) Three Best Ideas – What Works 1. ------------- 2. -------------- Sharp Edges 3. -----No-cost / low-cost 4. ----- Off the Wall

RESULTS BASED BUDGETING Do we need it? POPULATION ACCOUNTABILITY Is it working? PERFORMANCE ACCOUNTABILITY

20 Minute Exercise Population & 1 result 1 indicator Discuss how we’re doing 2 partners 2 what works ideas (1 nc/lc) Discuss how to implement 1. What population are we concerned about? (e. g. U. S. population) 2. What condition(s) do we want for this population? (Americans are free of cancer. ) 3. How could we measure these conditions? ( (e. g. cancer rates) 4. How are we doing on the most important of these measures? (baseline history) 5. Who are the partners with a role to play in doing better? 6. What works – what would it take – to do better? (What is our role? ) 7. What do we propose to do?

20 Minute Exercise 1 population 1 result 1 indicator Discuss how we’re doing 2 partners 2 what works ideas (1 nc/lc) Discuss how to POPULATION ACCOUNTABILITY 1. What population are we concerned about? (e. g. U. S. population) 2. What condition(s) do we want for this population? (Americans are free of cancer. ) 3. How could we measure these conditions? ( (e. g. cancer rates) 4. How are we doing on the most important of these measures? (baseline history) 5. Who are the partners with a role to play in doing better? 6. What works – what would it take – to do better? (What is our role? ) 7. What do we propose to do?
- Slides: 111