Rates of Change Higher GCSE Questions These questions


")

 Time")

 26")


- Slides: 11
Rates of Change – Higher – GCSE Questions These questions are the same format as previous GCSE exams. COPY means they use the exact same numbers as the original GCSE question. Otherwise, they are clone questions using different numbers. The worksheets are provided in a variety of sizes.
Printing To print handouts from slides Select the slide from the left. Then click: File > Print > ‘Print Current Slide’ To print multiple slides Click on a section title to highlight all those slides, or press ‘Ctrl’ at the same time as selecting slides to highlight more than one. Then click: File > Print > ‘Print Selection’ To print double-sided handouts Highlight both slides before using ‘Print Selection’. Choose ‘Print on Both Sides’ and ‘Flip on Short Edge’.
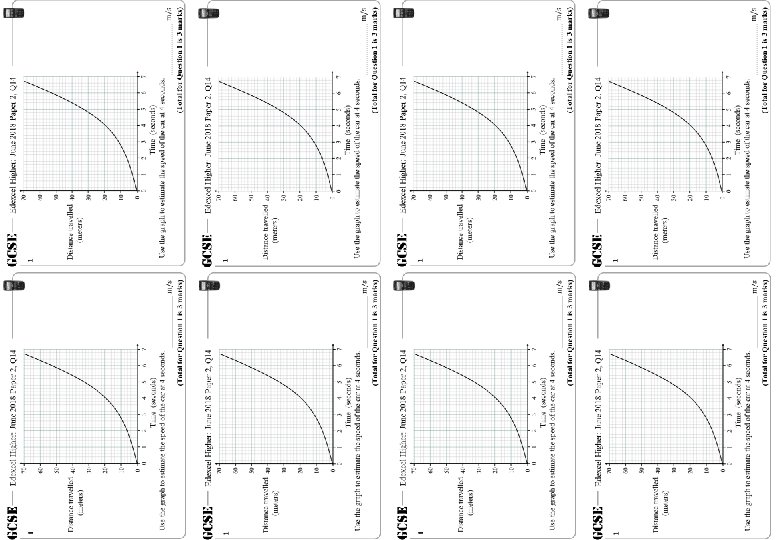
GCSE Edexcel Higher: June 2018 Paper 2, Q 14 1 1 Distance travelled (meters) Time (seconds) Use the graph to estimate the speed of the car at 4 seconds. GCSE Edexcel Higher: June 2018 Paper 2, Q 14 (Total for Question 1 is 3 marks) Edexcel Higher: June 2018 Paper 2, Q 14 1 1 Distance travelled (meters) Time (seconds) Use the graph to estimate the speed of the car at 4 seconds. (Total for Question 1 is 3 marks)
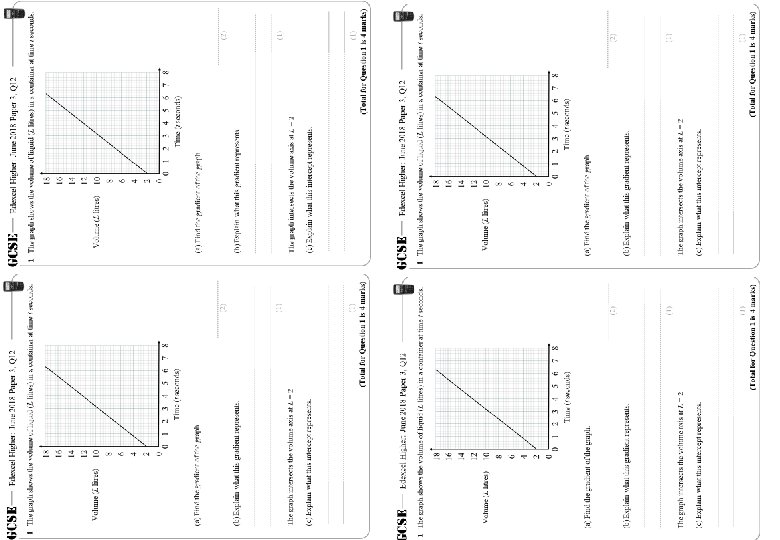
GCSE Edexcel Higher: June 2018 Paper 3, Q 12 1 The graph shows the volume of liquid (L litres) in a container at time t seconds. Volume (L litres) Time (t seconds) (a) Find the gradient of the graph. (2) (b) Explain what this gradient represents. (1) The graph intersects the volume axis at L = 2 (c) Explain what this intercept represents. (1) (Total for Question 1 is 4 marks)
GCSE Edexcel Higher: June 2018 Paper 2, Q 14 1 Distance travelled (meters) Time (seconds) Use the graph to estimate the speed of the car at 4 seconds. (Total for Question 1 is 3 marks)
GCSE Edexcel Higher: June 2018 Paper 3, Q 12 1 The graph shows the volume of liquid (L litres) in a container at time t seconds. Volume (L litres) Time (t seconds) (a) Find the gradient of the graph. (2) (b) Explain what this gradient represents. (1) The graph intersects the volume axis at L = 2 (c) Explain what this intercept represents. (1) (Total for Question 1 is 4 marks)
GCSE Edexcel Higher: June 2018 Paper 2, Q 14 1 Distance travelled (meters) 26 3 Time (seconds) Use the graph to estimate the speed of the car at 4 seconds. 8. 7 (Total for Question 1 is 3 marks)
GCSE Edexcel Higher: June 2018 Paper 3, Q 12 1 The graph shows the volume of liquid (L litres) in a container at time t seconds. Volume (L litres) 10 4 Time (t seconds) (a) Find the gradient of the graph. (2) (b) Explain what this gradient represents. The rate at which the container fills. (1) The graph intersects the volume axis at L = 2 (c) Explain what this intercept represents. Amount of liquid in the container (1) to begin with. (Total for Question 1 is 4 marks)
Questions? Comments? Suggestions? …or have you found a mistake!? Any feedback would be appreciated . Please feel free to email: tom@goteachmaths. co. uk