RasterMap AlgebraHydrology Cell size of raster data Raster

Raster/Map Algebra/Hydrology

Cell size of raster data

Raster Generalization Largest share rule Central point rule

Map Algebra/Raster Calculation Example Cell by cell evaluation of mathematical functions 5 6 7 6 3 2 3 4 = 2 5 3 2 Precipitation Losses (Evaporation, Infiltration) = Runoff

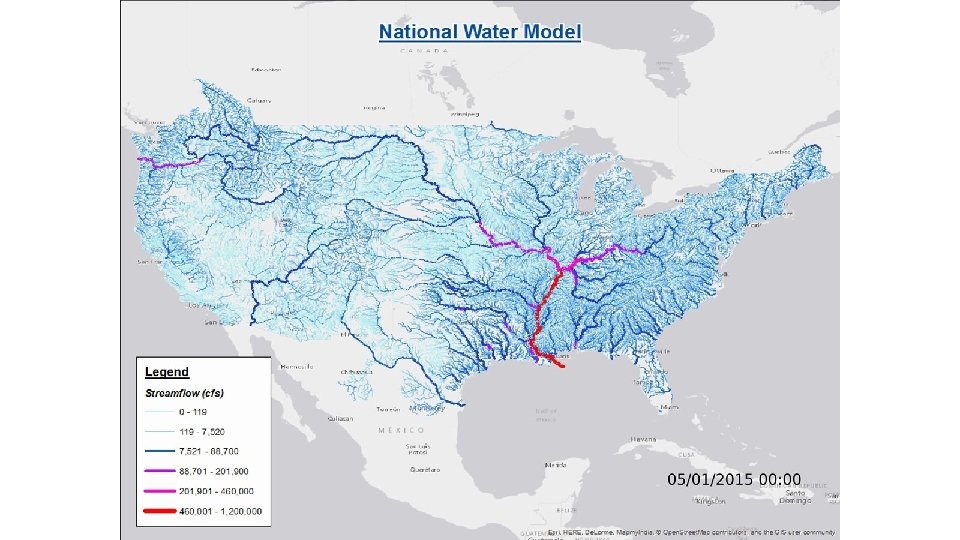
Cell based discharge mapping by accumulation of generated runoff Radar Precipitation grid Soil and land use grid Runoff grid from raster calculator operations implementing runoff generation formula’s Accumulation of runoff within watersheds

Calculation with consistent 100 m cell size grid “precip 100” - “infiltration” 1. 8 2 2 1. 75 1. 775 1. 6 1. 55 1. 3 • Outputs are on 100 m grid as desired. • How were values obtained ?

100 m cell size raster calculation 4 3. 55 3. 1 5 4. 275 3. 55 4 – 2. 2 = 1. 8 6 5– 3 =2 5 6– 4=2 3. 55 – 1. 8 = 1. 75 4 4. 275 – 2. 5 = 1. 775 100 m 5 – 3. 5 = 1. 5 1. 8 2 2 1. 75 1. 775 1. 6 1. 55 1. 3 3. 1 – 1. 5 = 1. 6 2. 2 3 4 3. 55 – 2 = 1. 55 4 – 2. 7 = 1. 3 1. 8 2. 5 3. 5 1. 5 2 2. 7
 3 -D detail")
Analysis of topographic surfaces represented by a Digital Elevation Model (DEM) 3 -D detail of the Tongue river at the WY/Mont border from LIDAR.
 resolution 1980’s DMA 90 m 102")
The challenge of increasing Digital Elevation Model (DEM) resolution 1980’s DMA 90 m 102 cells/km 2 1990’s USGS DEM 30 m 103 cells/km 2 2000’s NED 10 -30 m 104 cells/km 2 2010’s LIDAR ~1 m 106 cells/km 2

Data Conversion Tool

Topographic Slope
 - Direction of Steepest Descent 30 Slope: 30 80")
Hydrologic Slope (Flow Direction Tool) - Direction of Steepest Descent 30 Slope: 30 80 74 63 69 67 56 60 52 48

Eight Direction Pour Point Model 32 64 16 8 128 1 4 2 ESRI Direction encoding

Map Algebra Tool

Hydrology / Flow Direction Tool

Hydrology / Flow Accumulation Tool
- Slides: 17