
Rare event statistics Lifshitz tails and modular invariance
- Slides: 33
Rare event statistics, Lifshitz tails and modular invariance Sergei Nechaev Center Poncelet (CNRS, Moscow), Lebedev Physical Institute (Moscow)
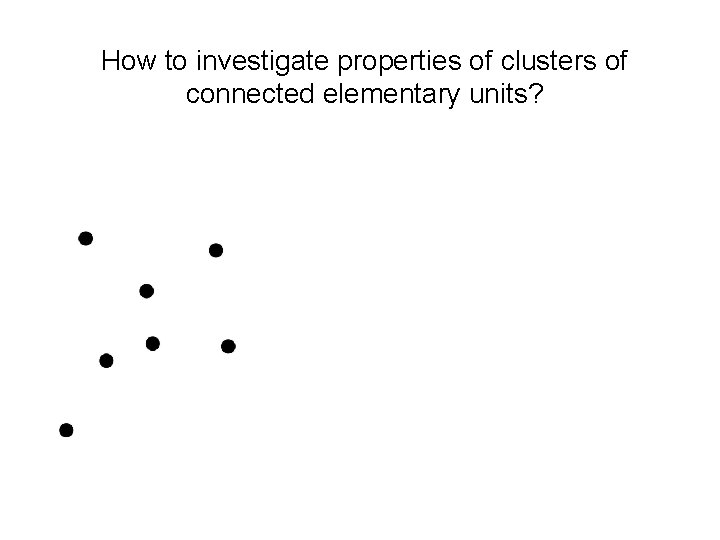
How to investigate properties of clusters of connected elementary units?
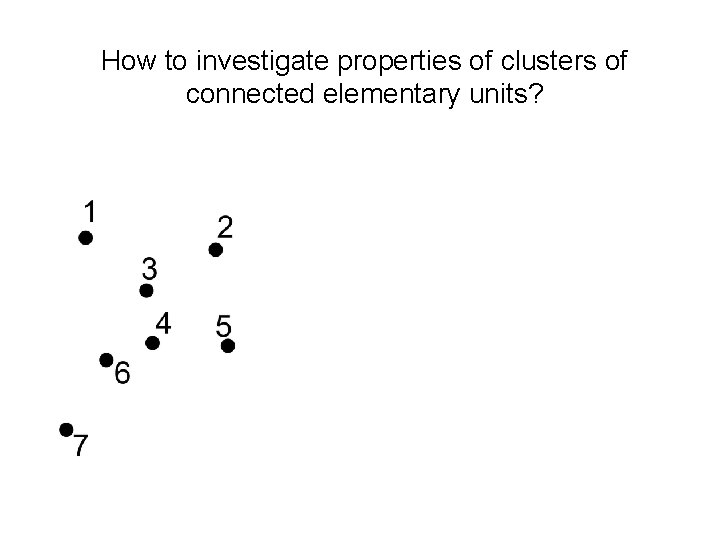
How to investigate properties of clusters of connected elementary units?
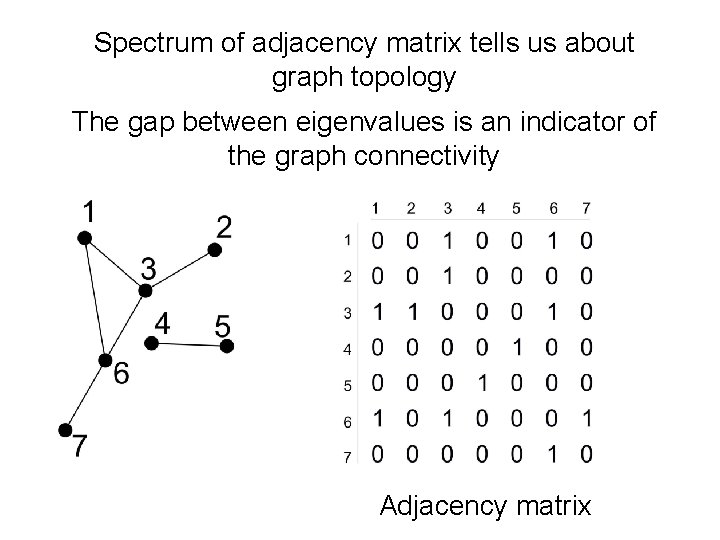
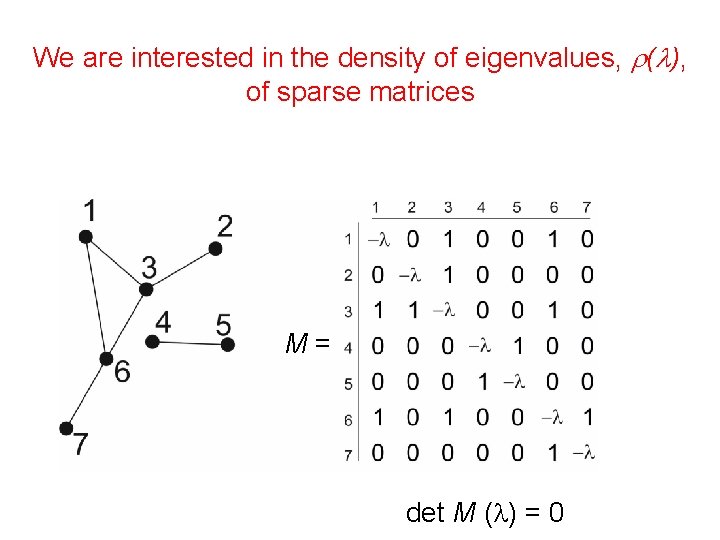
Spectrum of adjacency matrix tells us about graph topology The gap between eigenvalues is an indicator of the graph connectivity Adjacency matrix
We are interested in the density of eigenvalues, r(l), of sparse matrices M= det M (l) = 0
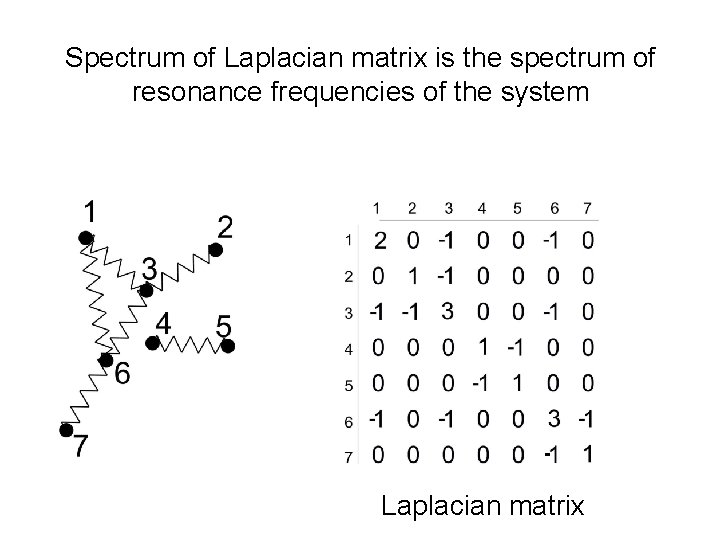
Spectrum of Laplacian matrix is the spectrum of resonance frequencies of the system - Laplacian matrix
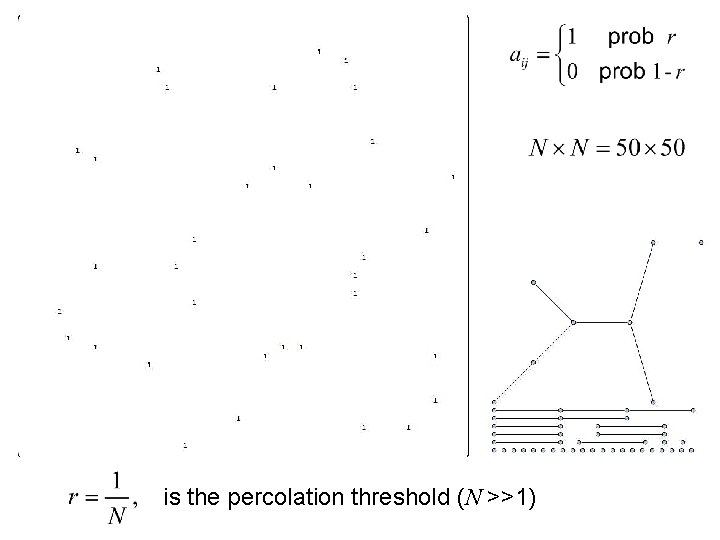
is the percolation threshold (N >>1)
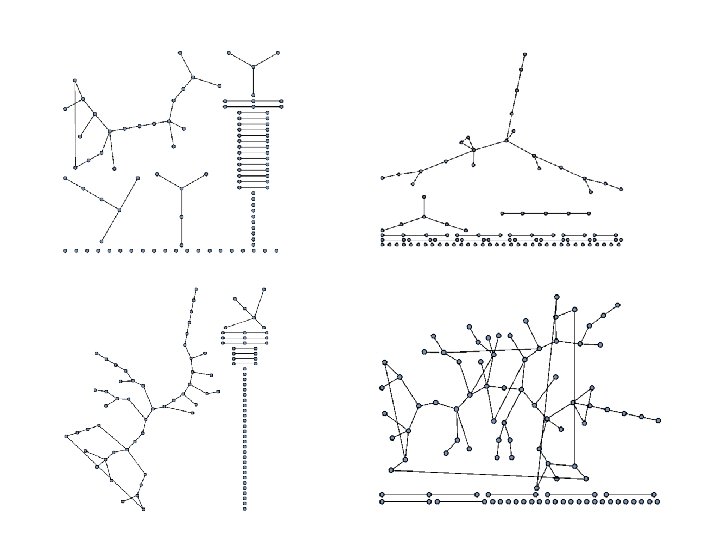
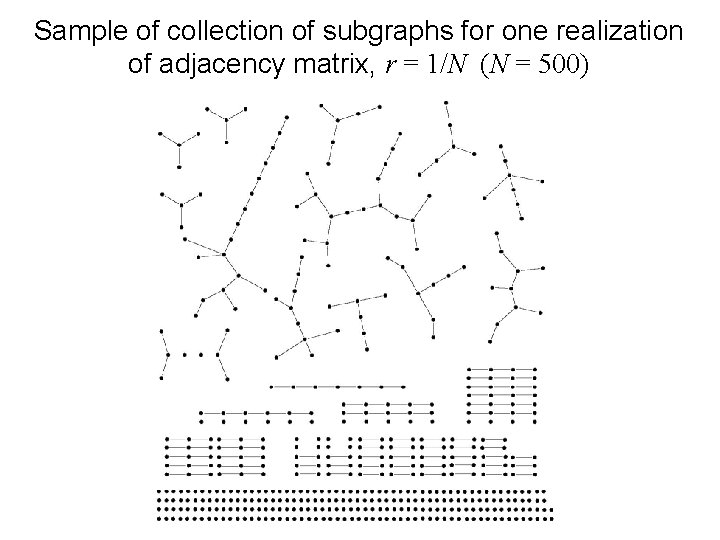
Sample of collection of subgraphs for one realization of adjacency matrix, r = 1/N (N = 500)
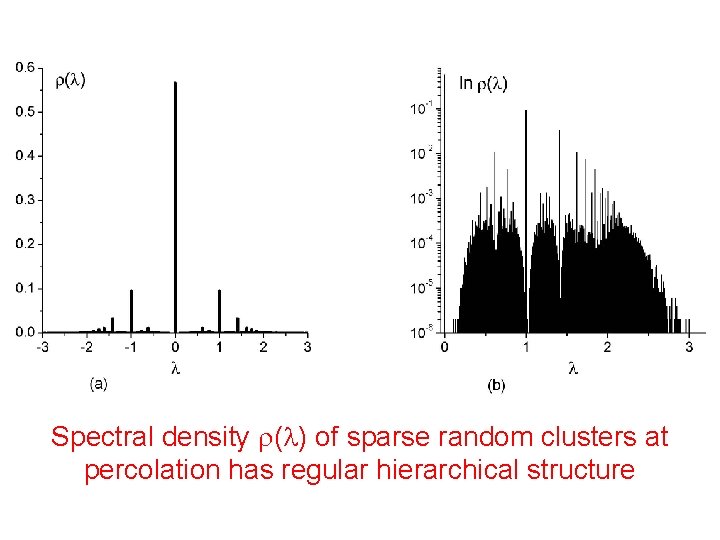
Spectral density r(l) of sparse random clusters at percolation has regular hierarchical structure
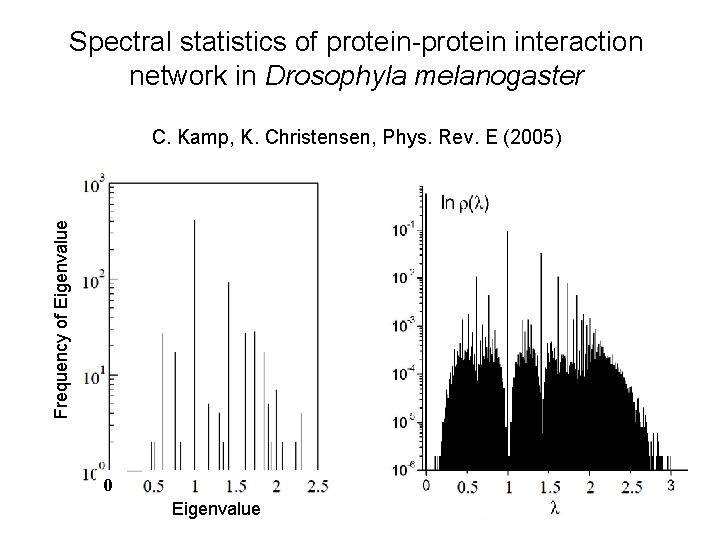
Spectral statistics of protein-protein interaction network in Drosophyla melanogaster Frequency of Eigenvalue C. Kamp, K. Christensen, Phys. Rev. E (2005) 0 Eigenvalue
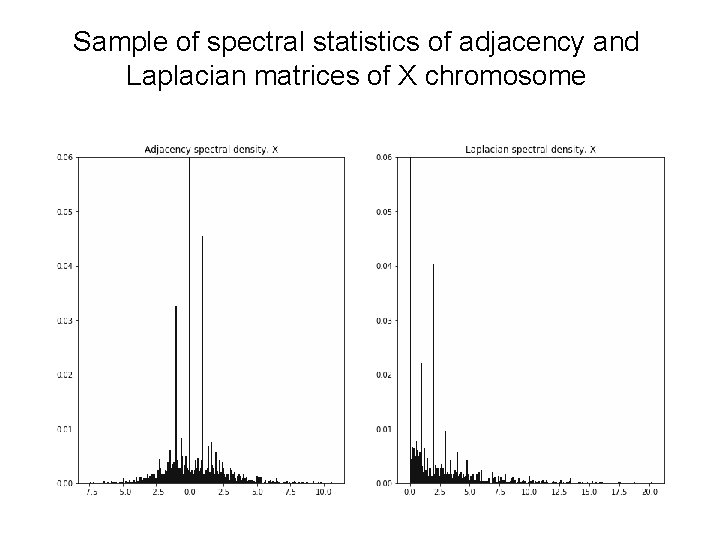
Sample of spectral statistics of adjacency and Laplacian matrices of X chromosome
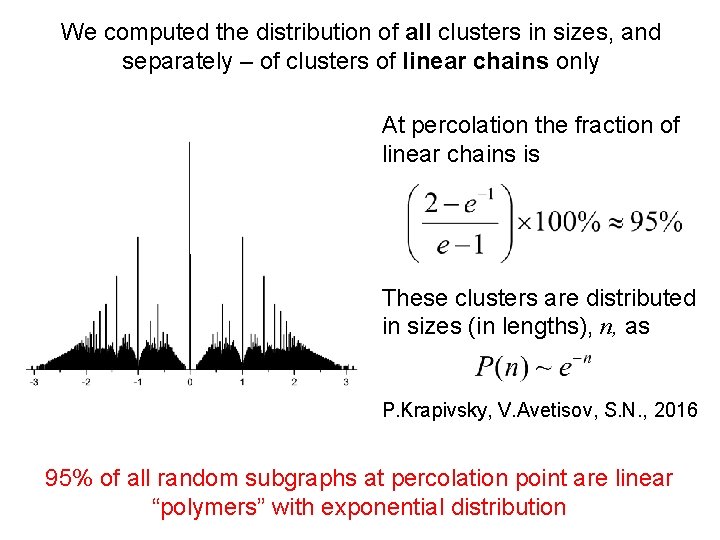
We computed the distribution of all clusters in sizes, and separately – of clusters of linear chains only At percolation the fraction of linear chains is These clusters are distributed in sizes (in lengths), n, as P. Krapivsky, V. Avetisov, S. N. , 2016 95% of all random subgraphs at percolation point are linear “polymers” with exponential distribution
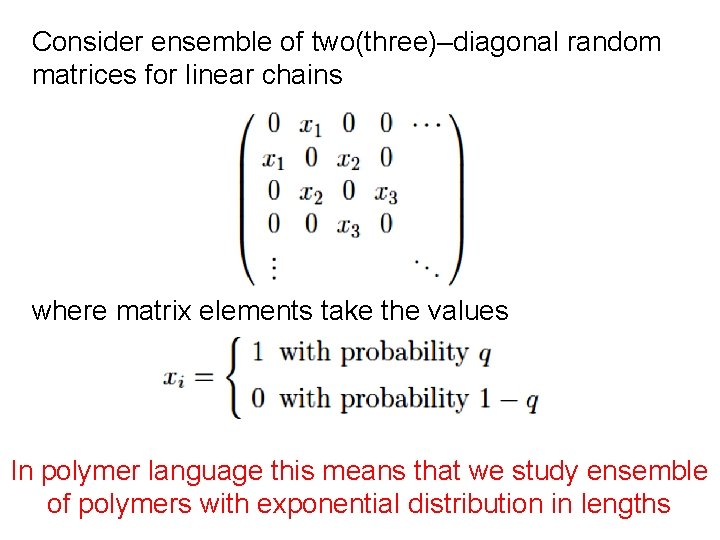
Consider ensemble of two(three)–diagonal random matrices for linear chains where matrix elements take the values In polymer language this means that we study ensemble of polymers with exponential distribution in lengths
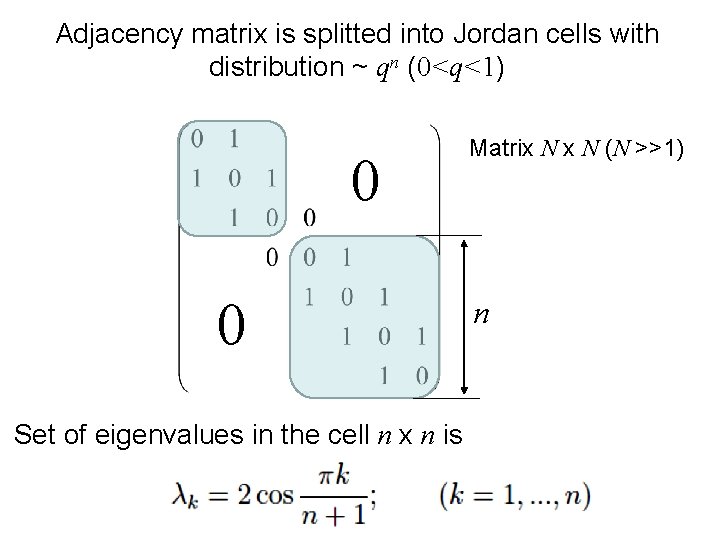
Adjacency matrix is splitted into Jordan cells with distribution ~ qn (0<q<1) 0 0 Set of eigenvalues in the cell n x n is Matrix N (N >>1) n
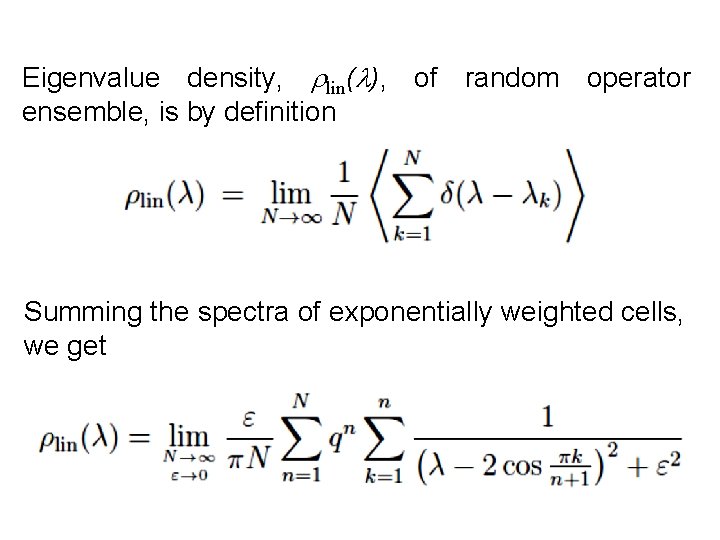
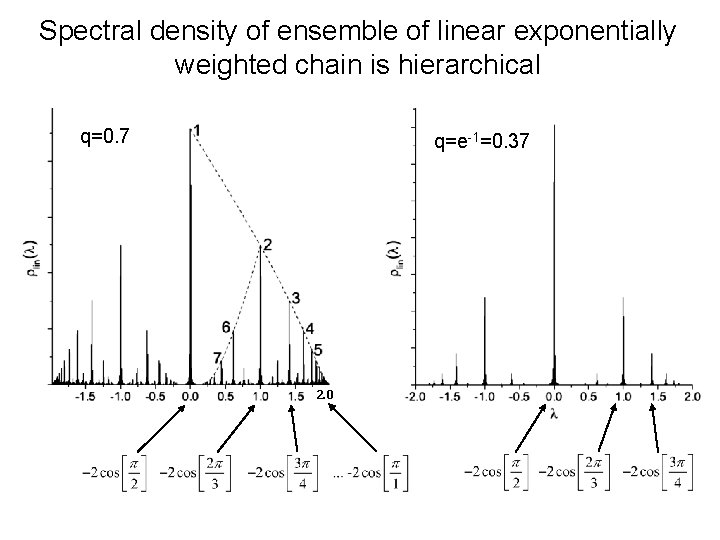
Eigenvalue density, rlin(l), of random operator ensemble, is by definition Summing the spectra of exponentially weighted cells, we get
Spectral density of ensemble of linear exponentially weighted chain is hierarchical q=0. 7 q=e-1=0. 37 2. 0
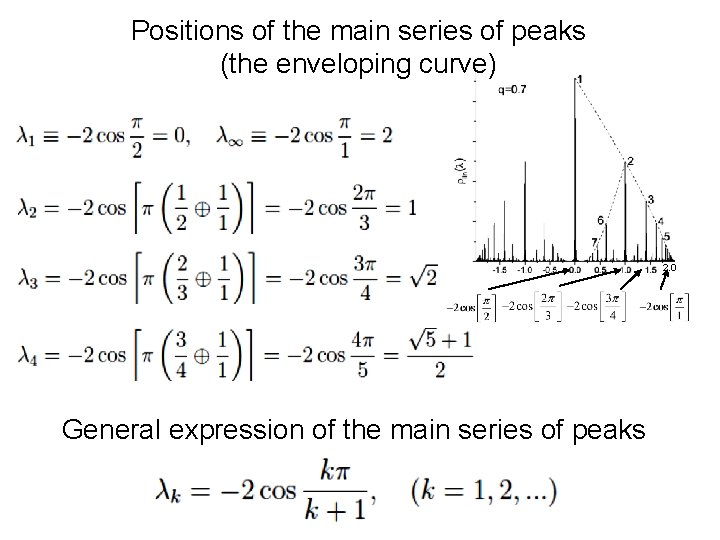
Positions of the main series of peaks (the enveloping curve) 2. 0 General expression of the main series of peaks
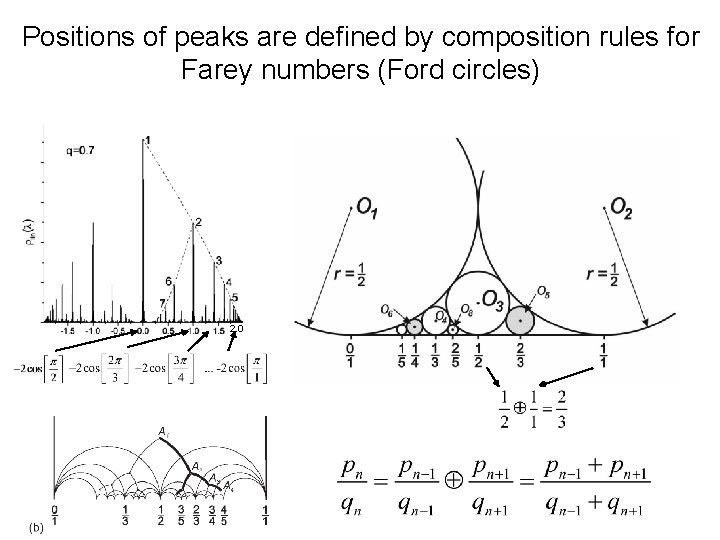
Positions of peaks are defined by composition rules for Farey numbers (Ford circles) 2. 0
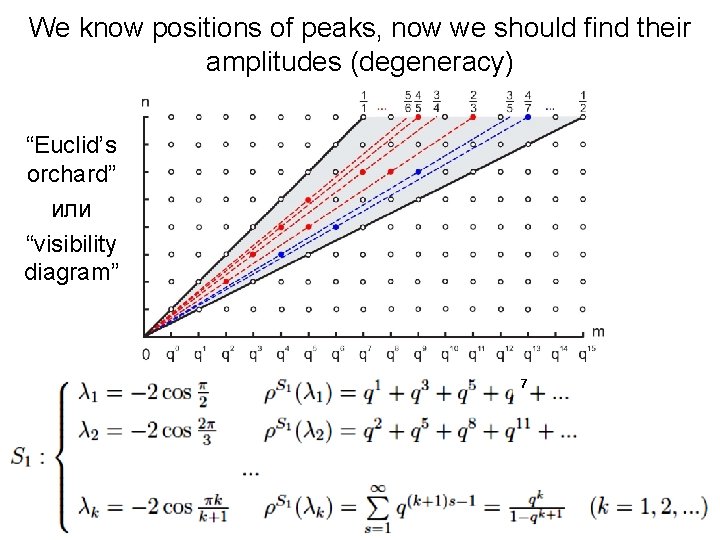
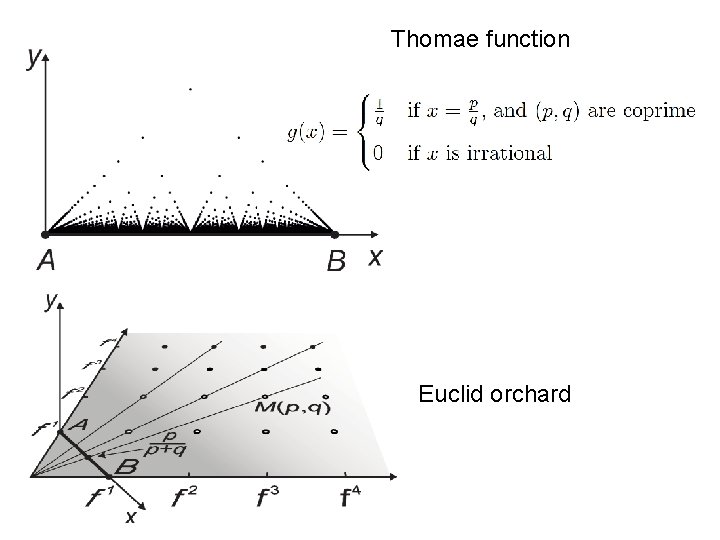
We know positions of peaks, now we should find their amplitudes (degeneracy) “Euclid’s orchard” или “visibility diagram” 7
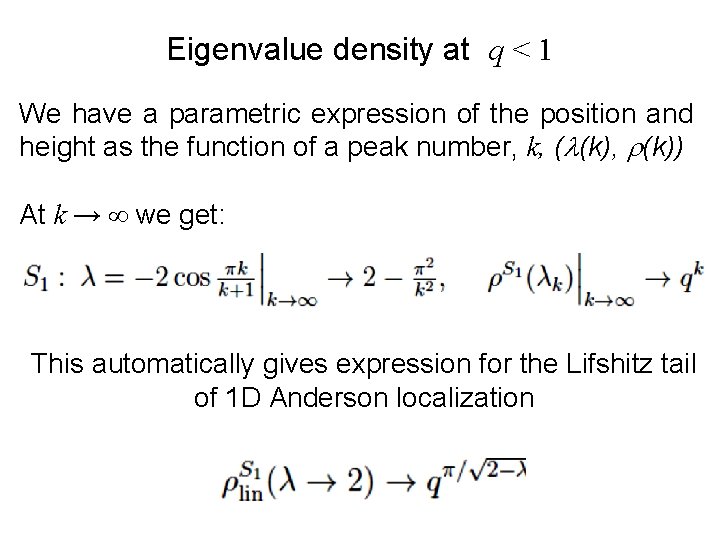
Eigenvalue density at q < 1 We have a parametric expression of the position and height as the function of a peak number, k, (l(k), r(k)) At k → ∞ we get: This automatically gives expression for the Lifshitz tail of 1 D Anderson localization
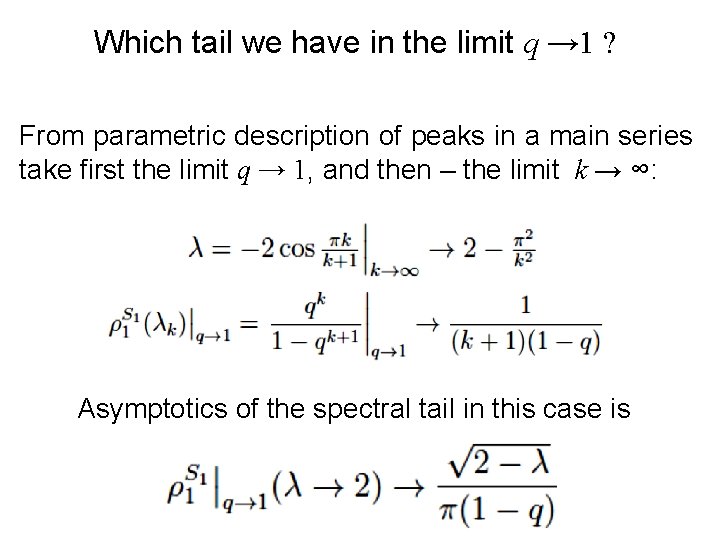
Which tail we have in the limit q → 1 ? From parametric description of peaks in a main series take first the limit q → 1, and then – the limit k → ∞: Asymptotics of the spectral tail in this case is
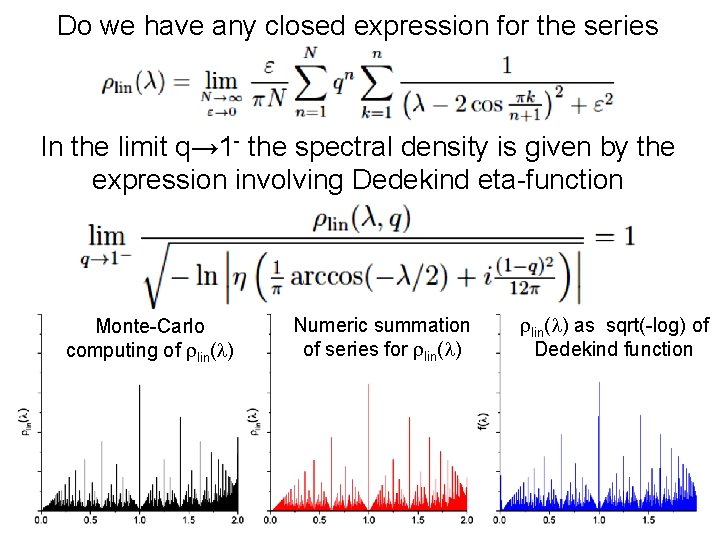
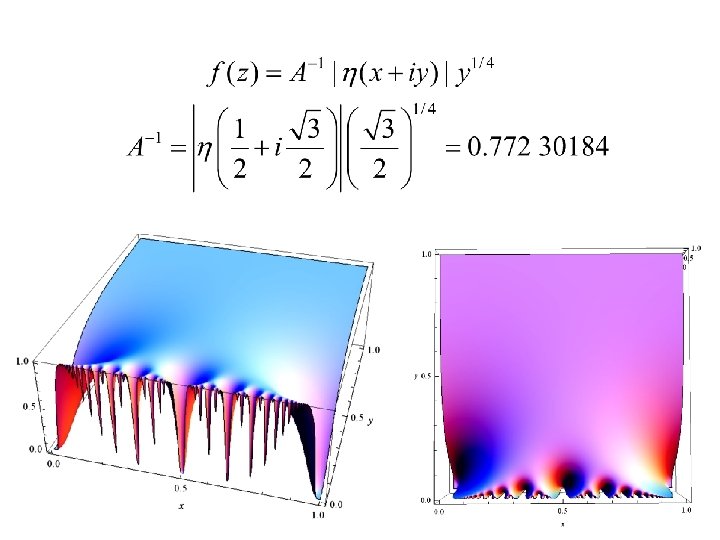
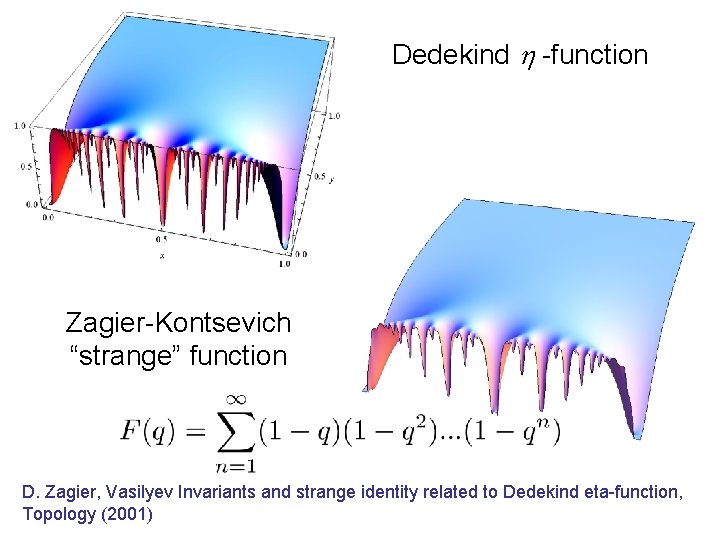
Do we have any closed expression for the series In the limit q→ 1 - the spectral density is given by the expression involving Dedekind eta-function Monte-Carlo computing of rlin(l) Numeric summation of series for rlin(l) as sqrt(-log) of Dedekind function
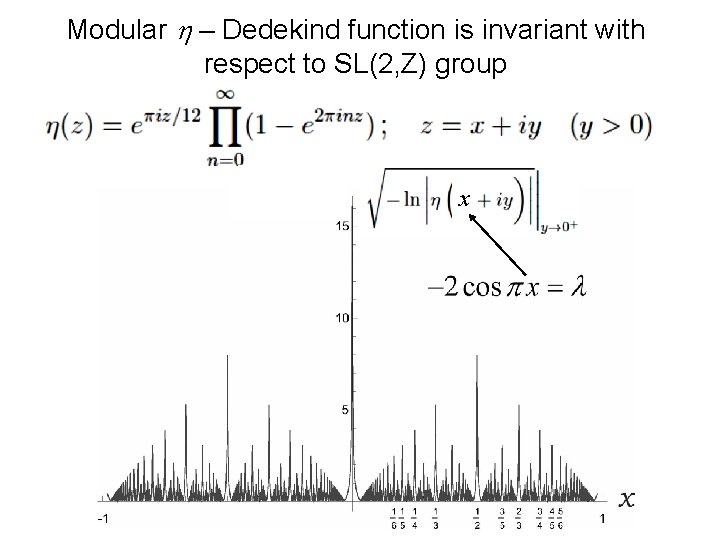
Modular h – Dedekind function is invariant with respect to SL(2, Z) group x
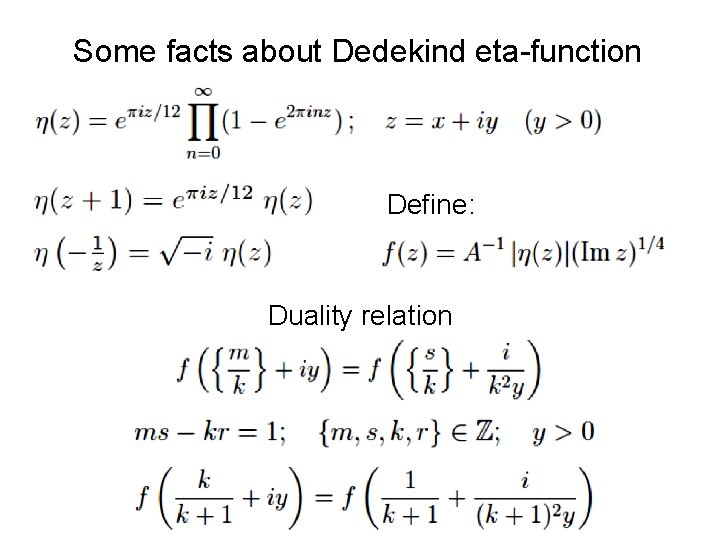
Some facts about Dedekind eta-function Define: Duality relation
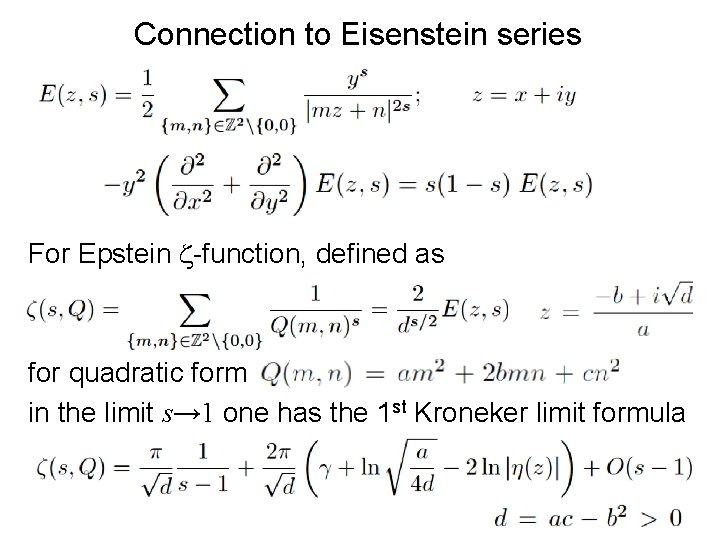
Connection to Eisenstein series For Epstein z-function, defined as for quadratic form in the limit s→ 1 one has the 1 st Kroneker limit formula
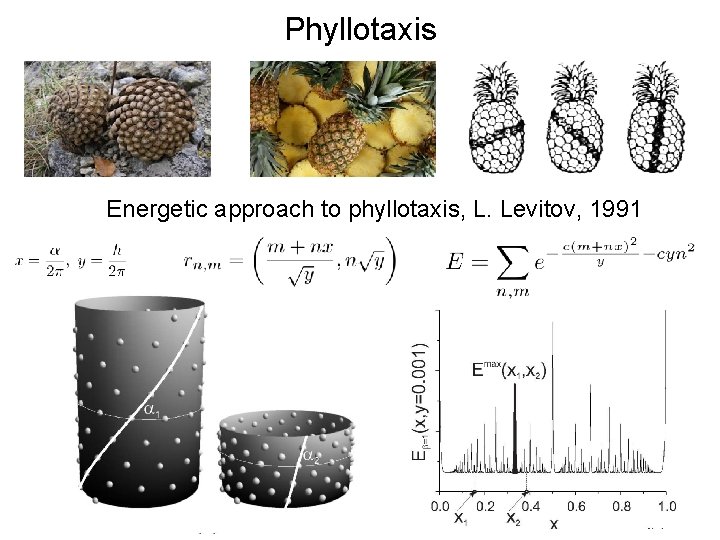
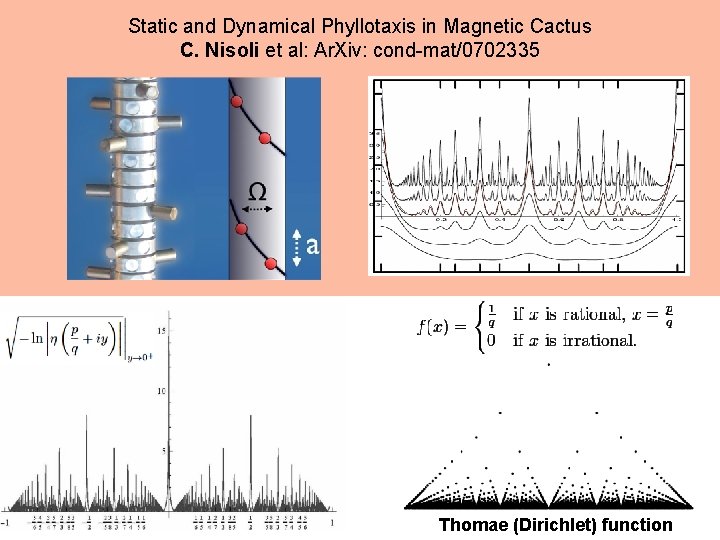
Phyllotaxis Energetic approach to phyllotaxis, L. Levitov, 1991
Static and Dynamical Phyllotaxis in Magnetic Cactus C. Nisoli et al: Ar. Xiv: cond-mat/0702335 Thomae (Dirichlet) function
Thomae function Euclid orchard
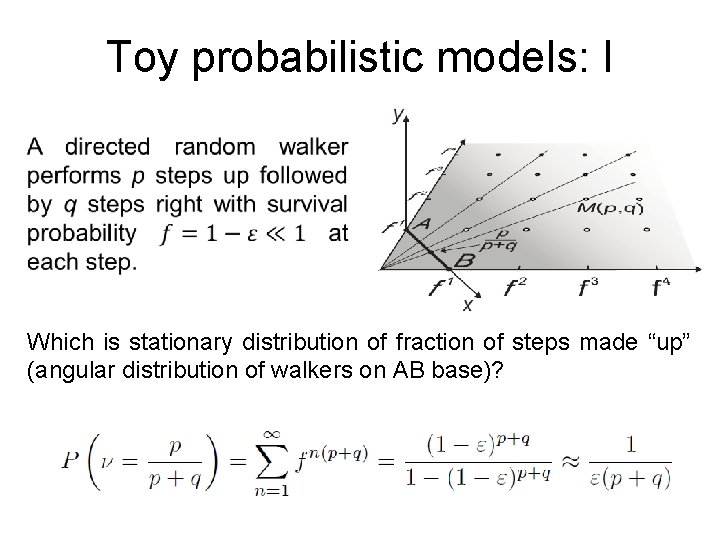
Toy probabilistic models: I Which is stationary distribution of fraction of steps made “up” (angular distribution of walkers on AB base)?
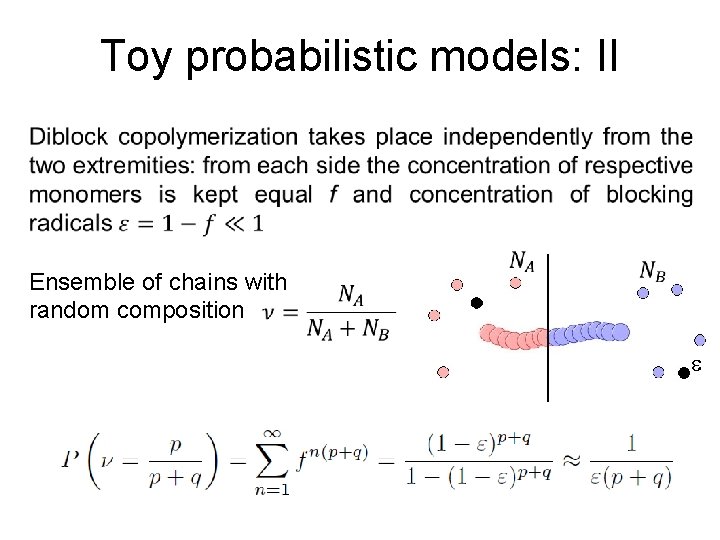
Toy probabilistic models: II Ensemble of chains with random composition e
Dedekind h -function Zagier-Kontsevich “strange” function D. Zagier, Vasilyev Invariants and strange identity related to Dedekind eta-function, Topology (2001)