Rangeland Health Assessment and Monitoring Framework for Ecological
")
 (1) National")
? • Complements plant community composition and cover")


.")


 Qualitative indicators of")
 (1) National")
 National rangeland condition assessment of long-term (every 5 years) status and changes")
 National rangeland condition assessment of long-term (every 5 years) status and changes")
 National rangeland condition assessment of long-term (every 5 years) status and changes")
 National rangeland condition assessment of long-term (every 5 years) status and changes")
 National rangeland condition assessment of long-term (every 5 years) status and changes")
 National rangeland condition assessment of long-term (every 5 years) status and changes")
 National rangeland condition assessment of long-term (every 5 years) status and changes")
 Regional assessments of short-term (every 2 -4 weeks) forage availability and carrying")
 System that herders and local officials can use to decide when")
 System that herders and local land managers can use to decide")
 Relationship between 3 elements Standard reference (potential based on ecological sites); shared sampling")
 Relationship between 3 elements Standard reference (potential based on ecological sites); shared sampling")
 Relationship between 3 elements Standard reference (potential based on ecological sites); shared sampling")
 Relationship between 3 elements Standard reference (potential based on ecological sites); shared sampling")
 Relationship between 3 elements Standard reference (potential based on ecological sites); shared sampling")
 Relationship between 3 elements Standard reference (potential based on ecological sites); shared sampling")
 Relationship between 3 elements Standard reference (potential based on ecological sites); shared sampling")

- Slides: 33
Rangeland Health Assessment and Monitoring (Framework for Ecological Site-Based Assessment and Monitoring in Mongolia) 7 July 2007 Ulan Bator, Mongolia Jeff Herrick and Brandon Bestelmeyer USDA-ARS Jornada Experimental Range and the Jornada LTER Las Cruces, New Mexico USA
Our understanding of Mongolia’s current needs for assessment and monitoring (3 elements) (1) National rangeland condition assessment of longterm (every 5 years) status and changes in rangeland health (2) Regional assessments of short-term (every 2 -4 weeks) forage availability and carrying capacity (3) System that herders and local officials can use to decide: (a) When to move livestock (b) Which areas need to be rested from grazing for one or more years ALSO Relate 3 elements to each other
Why rangeland health (quantitative and qualitative indicators)? • Complements plant community composition and cover information (Traditional methods) • Reflects changes in land degradation (for example, increased runoff and erosion) • Reflects changes in the resilience of the land • Uses the long-term potential of the land (based on soils and climate) as the reference (instead of the current plant community).
Rangeland health reflects changes in land degradation and resilience. Because it uses the ecological potential as a reference, it can also be used to plan and prioritize restoration projects.
Rangeland health publications and databases
Socio-economic drivers Atypically high grazing pressure Global climate change Regional increases in temperature and aridity Reduction in cover and change in composition of perennial vegetation* and soil surface disturbance and compaction Meristem limitation/ reduced NPP Reduced reproduction, delayed recovery Increased albedo/ aridification Reduced water capture, Reduced NPP Increasing erosion, plant mortality Soil degradation, plant mortality *Especially key forage species; native and exotic invasive species can also contribute to degradation but may not result in a reduction in cover.
Why ecological sites? • Ecological sites reflect the long-term potential of the land (based on soils and climate) as the reference (instead of the current plant community). This helps herders and government officials focus management and restoration efforts on areas with high potential.
Different degradation processes in different ecological sites different indicators are necessary Example: Caragana forms dunes form in sandy soils, but not in loamy soils (same species, different patterns and processes)
Different soils often have different potential and different response to grazing (different ecological sites). There are probably between 50 and 200 ecological sites in Mongolia. 500 m Sandy clay loam 0 -25 cm (1 ecological site) Sandy loam 0 -7 cm Sandy clay loam 7 -25 cm (a different ecological site)
Why rangeland health assessments? • To help understand what processes are important • To help decide what quantitative indicators should be used for repeated assessments (for example, the Mongolian National Rangeland Condition Assessment) • To describe processes and properties (for example, runoff) that are difficult to evaluate with quantitative indicators • To help interpret quantitative indicators
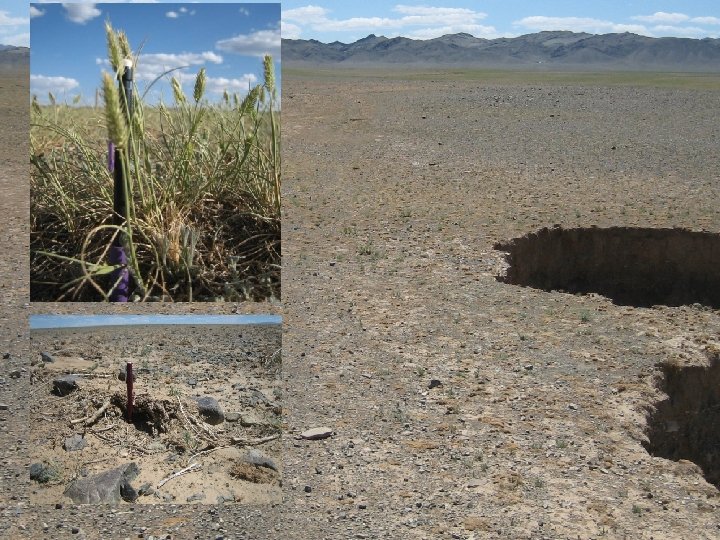
Pedestals, terracettes and water flow patterns are important indicators of degradation but are almost impossible to quantify. They can be used to help interpret quantitative indicators (such as plant basal cover). In other words, we often don’t know how much basal or plant cover is necessary to limit runoff and erosion; qualitative indicators can help us identify these threshold values.
Soil erosion and deposition patterns are important indicators of degradation by wind erosion but are very expensive to quantify. They can be used to help interpret quantitative indicators (such as plant canopy cover). In other words, we often don’t know what distribution of plant cover is necessary to limit wind erosion; qualitative indicators can help us identify these threshold values.
Qualitative indicator of compaction – soil structure Road #1(58 m wide) Qualitative indicators of soil compaction are used to determine when it is necessary to monitor soil compaction. Cars and trucks cause soil compaction. This is important in some ecological sites, but not in others. Also, the reference (control) is different in different ecological sites. Penetration resistance (quantitative - # of strikes) Road Control Site #1 silty clay loam (10 tests) 31 9 Site #2 loamy sand (3 tests) 76 20
Our understanding of Mongolia’s current needs for assessment and monitoring (3 elements) (1) National rangeland condition assessment of longterm (every 5 years) status and changes in rangeland health (2) Regional assessments of short-term (every 2 -4 weeks) forage availability and carrying capacity (3) System that herders and local officials can use to decide: (a) When to move livestock (b) Which areas need to be rested from grazing for one or more years ALSO relate 3 elements to each other
(Element 1) National rangeland condition assessment of long-term (every 5 years) status and changes in rangeland health. 2008 Preliminary landscape stratification/classification (based on GIS analysis + expert knowledge of soil/vegetation/climate patterns) 2009 (Assess at sampling locations to create statistical map) Rangeland Condition Assessment Method (Traditional) 2009 National Assessment 1 There are specific methods that are used to do this for regional and national assessments and monitoring. To the extent possible, use existing monitoring points (for example, Gobi Forage). Based on analysis of 2009 data, other 2014 existing data, and new studies by Academy of Science and other scientists. 2 Contact: USDA-ARS Jornada Experimental Range and Jornada LTER, Las Cruces, New Mexico, USA. Brandon Bestelmeyer (bbestelm@nmsu. edu), Kris Havstad (khavstad@nmsu. edu) and Jeff Herrick (jherrick@nmsu. edu). Describe (measure where possible) 17 Rangeland Health Indicators Describe soils (texture, depth, gravel, Ca. CO 3) Develop ecological site system & refine landscape stratification 2 Select key indicators for groups of similar ecological sites 2 Measure key indicators (for example, basal cover) 2014 National Assessment Element 3 (local assessment and monitoring) Research support (Research Institutes and others) Randomly select field sampling points within strata 1
(Element 1) National rangeland condition assessment of long-term (every 5 years) status and changes in rangeland health. 2008 Preliminary landscape stratification/classification (based on GIS analysis + expert knowledge of soil/vegetation/climate patterns) 2009 (Assess at sampling locations to create statistical map) Rangeland Condition Assessment Method (Traditional) 2009 National Assessment 1 There are specific methods that are used to do this for regional and national assessments and monitoring. To the extent possible, use existing monitoring points (for example, Gobi Forage). Based on analysis of 2009 data, other 2014 existing data, and new studies by Academy of Science and other scientists. 2 Contact: USDA-ARS Jornada Experimental Range and Jornada LTER, Las Cruces, New Mexico, USA. Brandon Bestelmeyer (bbestelm@nmsu. edu), Kris Havstad (khavstad@nmsu. edu) and Jeff Herrick (jherrick@nmsu. edu). Describe (measure where possible) 17 Rangeland Health Indicators Describe soils (texture, depth, gravel, Ca. CO 3) Develop ecological site system & refine landscape stratification 2 Select key indicators for groups of similar ecological sites 2 Measure key indicators (for example, basal cover) 2014 National Assessment Element 3 (local assessment and monitoring) Research support (Research Institutes and others) Randomly select field sampling points within strata 1
(Element 1) National rangeland condition assessment of long-term (every 5 years) status and changes in rangeland health. 2008 Preliminary landscape stratification/classification (based on GIS analysis + expert knowledge of soil/vegetation/climate patterns) 2009 (Assess at sampling locations to create statistical map) Rangeland Condition Assessment Method (Traditional) 2009 National Assessment 1 There are specific methods that are used to do this for regional and national assessments and monitoring. To the extent possible, use existing monitoring points (for example, Gobi Forage). Based on analysis of 2009 data, other 2014 existing data, and new studies by Academy of Science and other scientists. 2 Contact: USDA-ARS Jornada Experimental Range and Jornada LTER, Las Cruces, New Mexico, USA. Brandon Bestelmeyer (bbestelm@nmsu. edu), Kris Havstad (khavstad@nmsu. edu) and Jeff Herrick (jherrick@nmsu. edu). Describe (measure where possible) 17 Rangeland Health Indicators Describe soils (texture, depth, gravel, Ca. CO 3) Develop ecological site system & refine landscape stratification 2 Select key indicators for groups of similar ecological sites 2 Measure key indicators (for example, basal cover) 2014 National Assessment Element 3 (local assessment and monitoring) Research support (Research Institutes and others) Randomly select field sampling points within strata 1
(Element 1) National rangeland condition assessment of long-term (every 5 years) status and changes in rangeland health. 2008 Preliminary landscape stratification/classification (based on GIS analysis + expert knowledge of soil/vegetation/climate patterns) 2009 (Assess at sampling locations to create statistical map) Rangeland Condition Assessment Method (Traditional) 2009 National Assessment 1 There are specific methods that are used to do this for regional and national assessments and monitoring. To the extent possible, use existing monitoring points (for example, Gobi Forage). Based on analysis of 2009 data, other 2014 existing data, and new studies by Academy of Science and other scientists. 2 Contact: USDA-ARS Jornada Experimental Range and Jornada LTER, Las Cruces, New Mexico, USA. Brandon Bestelmeyer (bbestelm@nmsu. edu), Kris Havstad (khavstad@nmsu. edu) and Jeff Herrick (jherrick@nmsu. edu). Describe (measure where possible) 17 Rangeland Health Indicators Describe soils (texture, depth, gravel, Ca. CO 3) Develop ecological site system & refine landscape stratification 2 Select key indicators for groups of similar ecological sites 2 Measure key indicators (for example, basal cover) 2014 National Assessment Element 3 (local assessment and monitoring) Research support (Research Institutes and others) Randomly select field sampling points within strata 1
(Element 1) National rangeland condition assessment of long-term (every 5 years) status and changes in rangeland health. 2008 Preliminary landscape stratification/classification (based on GIS analysis + expert knowledge of soil/vegetation/climate patterns) 2009 (Assess at sampling locations to create statistical map) Rangeland Condition Assessment Method (Traditional) 2009 National Assessment 1 There are specific methods that are used to do this for regional and national assessments and monitoring. To the extent possible, use existing monitoring points (for example, Gobi Forage). Based on analysis of 2009 data, other 2014 existing data, and new studies by Academy of Science and other scientists. 2 Contact: USDA-ARS Jornada Experimental Range and Jornada LTER, Las Cruces, New Mexico, USA. Brandon Bestelmeyer (bbestelm@nmsu. edu), Kris Havstad (khavstad@nmsu. edu) and Jeff Herrick (jherrick@nmsu. edu). Describe (measure where possible) 17 Rangeland Health Indicators Describe soils (texture, depth, gravel, Ca. CO 3) Develop ecological site system & refine landscape stratification 2 Select key indicators for groups of similar ecological sites 2 Measure key indicators (for example, basal cover) 2014 National Assessment Element 3 (local assessment and monitoring) Research support (Research Institutes and others) Randomly select field sampling points within strata 1
(Element 1) National rangeland condition assessment of long-term (every 5 years) status and changes in rangeland health. 2008 Preliminary landscape stratification/classification (based on GIS analysis + expert knowledge of soil/vegetation/climate patterns) 2009 (Assess at sampling locations to create statistical map) Rangeland Condition Assessment Method (Traditional) 2009 National Assessment 1 There are specific methods that are used to do this for regional and national assessments and monitoring. To the extent possible, use existing monitoring points (for example, Gobi Forage). Based on analysis of 2009 data, other 2014 existing data, and new studies by Academy of Science and other scientists. 2 Contact: USDA-ARS Jornada Experimental Range and Jornada LTER, Las Cruces, New Mexico, USA. Brandon Bestelmeyer (bbestelm@nmsu. edu), Kris Havstad (khavstad@nmsu. edu) and Jeff Herrick (jherrick@nmsu. edu). Describe (measure where possible) 17 Rangeland Health Indicators Describe soils (texture, depth, gravel, Ca. CO 3) Develop ecological site system & refine landscape stratification 2 Select key indicators for groups of similar ecological sites 2 Measure key indicators (for example, basal cover) 2014 National Assessment Element 3 (local assessment and monitoring) Research support (Research Institutes and others) Randomly select field sampling points within strata 1
(Element 1) National rangeland condition assessment of long-term (every 5 years) status and changes in rangeland health. 2008 Preliminary landscape stratification/classification (based on GIS analysis + expert knowledge of soil/vegetation/climate patterns) 2009 (Assess at sampling locations to create statistical map) Rangeland Condition Assessment Method (Traditional) 2009 National Assessment 1 There are specific methods that are used to do this for regional and national assessments and monitoring. To the extent possible, use existing monitoring points (for example, Gobi Forage). Based on analysis of 2009 data, other 2014 existing data, and new studies by Academy of Science and other scientists. 2 Contact: USDA-ARS Jornada Experimental Range and Jornada LTER, Las Cruces, New Mexico, USA. Brandon Bestelmeyer (bbestelm@nmsu. edu), Kris Havstad (khavstad@nmsu. edu) and Jeff Herrick (jherrick@nmsu. edu). Describe (measure where possible) 17 Rangeland Health Indicators Describe soils (texture, depth, gravel, Ca. CO 3) Develop ecological site system & refine landscape stratification 2 Select key indicators for groups of similar ecological sites 2 Measure key indicators (for example, basal cover) 2014 National Assessment Element 3 (local assessment and monitoring) Research support (Research Institutes and others) Randomly select field sampling points within strata 1
(Element 2) Regional assessments of short-term (every 2 -4 weeks) forage availability and carrying capacity • Mercy Corps/Gobi Forage Project • Other initiatives
(Element 3 a) System that herders and local officials can use to decide when to move livestock - Utilization Plant height Plant cover Biomass Etc…
(Element 3 b) System that herders and local land managers can use to decide which areas need to be rested from grazing for more than one year - Few, very simple degradation indicators - Different indicators for different regions - Areas with too much wind erosion (wind erosion site) - Areas with too much runoff (gully site) - Areas where palatable species lost - Qualitative AND quantitative indicators can be used - These indicators are related to National Assessment indicators
(4) Relationship between 3 elements Standard reference (potential based on ecological sites); shared sampling locations Long-term patterns help separate precipitation from grazing effects on long-term indicators Element 1: National Condition Assessment/ Monitoring (every 5 years) Element 2: Regional forage availability (every 2 -4 weeks) Early warning/ general Element 3 a: patterns Local forage availability (when move livestock) Identify relevant local indicators for groups of ecological sites *Some local indicators also developed together with herders. Element 3 b: Local degradation (when need long-term rest)* Calibrate/ validate
(4) Relationship between 3 elements Standard reference (potential based on ecological sites); shared sampling locations Long-term patterns help separate precipitation from grazing effects on long-term indicators Element 1: National Condition Assessment/ Monitoring (every 5 years) Element 2: Regional forage availability (every 2 -4 weeks) Early warning/ general Element 3 a: patterns Local forage availability (when move livestock) Identify relevant local indicators for groups of ecological sites *Some local indicators also developed together with herders. Element 3 b: Local degradation (when need long-term rest)* Calibrate/ validate
(4) Relationship between 3 elements Standard reference (potential based on ecological sites); shared sampling locations Long-term patterns help separate precipitation from grazing effects on long-term indicators Element 1: National Condition Assessment/ Monitoring (every 5 years) Element 2: Regional forage availability (every 2 -4 weeks) Early warning/ general Element 3 a: patterns Local forage availability (when move livestock) Identify relevant local indicators for groups of ecological sites *Some local indicators also developed together with herders. Element 3 b: Local degradation (when need long-term rest)* Calibrate/ validate
(4) Relationship between 3 elements Standard reference (potential based on ecological sites); shared sampling locations Long-term patterns help separate precipitation from grazing effects on long-term indicators Element 1: National Condition Assessment/ Monitoring (every 5 years) Element 2: Regional forage availability (every 2 -4 weeks) Early warning/ general Element 3 a: patterns Local forage availability (when move livestock) Identify relevant local indicators for groups of ecological sites *Some local indicators also developed together with herders. Element 3 b: Local degradation (when need long-term rest)* Calibrate/ validate
(4) Relationship between 3 elements Standard reference (potential based on ecological sites); shared sampling locations Long-term patterns help separate precipitation from grazing effects on long-term indicators Element 1: National Condition Assessment/ Monitoring (every 5 years) Element 2: Regional forage availability (every 2 -4 weeks) Early warning/ general Element 3 a: patterns Local forage availability (when move livestock) Identify relevant local indicators for groups of ecological sites *Some local indicators also developed together with herders. Element 3 b: Local degradation (when need long-term rest)* Calibrate/ validate
(4) Relationship between 3 elements Standard reference (potential based on ecological sites); shared sampling locations Long-term patterns help separate precipitation from grazing effects on long-term indicators Element 1: National Condition Assessment/ Monitoring (every 5 years) Element 2: Regional forage availability (every 2 -4 weeks) Early warning/ general Element 3 a: patterns Local forage availability (when move livestock) Identify relevant local indicators for groups of ecological sites *Some local indicators also developed together with herders. Element 3 b: Local degradation (when need long-term rest)* Calibrate/ validate
(4) Relationship between 3 elements Standard reference (potential based on ecological sites); shared sampling locations Long-term patterns help separate precipitation from grazing effects on long-term indicators Element 1: National Condition Assessment/ Monitoring (every 5 years) Element 2: Regional forage availability (every 2 -4 weeks) Early warning/ general Element 3 a: patterns Local forage availability (when move livestock) Identify relevant local indicators for groups of ecological sites *Some local indicators also developed together with herders. Element 3 b: Local degradation (when need long-term rest)* Calibrate/ validate
Contact information USDA-ARS Jornada Experimental Range Las Cruces, New Mexico, USA http: //usda-ars. nmsu. edu Brandon Bestelmeyer (bbestelm@nmsu. edu) Kris Havstad (khavstad@nmsu. edu) Jeff Herrick (jherrick@nmsu. edu)