RANDOMIZED CONTROLLED TRIAL Instructor Fabrizio DAscenzo fabrizio dascenzogmail

RANDOMIZED CONTROLLED TRIAL Instructor: Fabrizio D’Ascenzo fabrizio. dascenzo@gmail. com www. emounito. org www. metcardio. org Role MD

CONFLICT OF INTEREST None

AIM OF THE COURSE A critical appraisal - Theorical - Practical of RCT

SOME HISTORY - 600 B. C. : Daniel of Judah compared the health effects of the vegetarian diet with those of a royal Babylonian diet over a 10 -day period. (Book of Daniel 1: 1– 21) -1952 The Medical Research Council trials on streptomycin for pulmonary tuberculosis are rightly regarded as a landmark that ushered in a new era of medicine. (Hill AB. The clinical trial. N Engl J Med 1952; 247: 113– 119)

RANDOMIZED ü It prevents selection bias and insures against accidental bias. ü It produces comparable groups, and eliminates the source of bias in treatment assignments.

RANDOMIZATION ü It permits the use of probability theory to express the likelihood of chance as a source for the difference between outcomes. ü It facilitates blinding (masking) of the identity of treatments from investigators, participants, and assessors, including the possible use of a placebo

RANDOMIZATION ü � Produces groups that are not systematically different with regard to known and unknown prognostic factors ü� Permits a valid analysis ü Permutation test is justified by randomization ü Standard analyses are valid approximations of the correct permutation test

CRUCIAL CONCEPTS q. PHASE q. STRUCTURE q. SUPERIORITY AND INFERIORITY q. RANDOMIZATION q. BLINDING q. SAMPLE SIZE q. AD INTERIM ANALYSIS q. ITT VS AT q. SUBGROUP ANALYSIS

PHASE

PHASE Phase I trials Objective to determine a safe drug dose Design usually dose escalation/de-escalation Subjects healthy volunteers or patients with disease Phase II trials Objective to determine a safe drug dose Design often single arm Subjects patients with disease Phase III trials Objective to compare efficacy of the new treatment with the standard regimen Design usually randomized control Subjects patients with disease

STRUCTURE

STRUCTURE ü Parallel group ü Cluster randomized ü Crossover ü Factorial

PARALLEL Most randomized controlled trials have parallel designs in which each group of participants is exposed to only one of the study interventions.

CLUSTER RANDOMIZED A cluster randomized trial is a trial in which individuals are randomized in groups (i. e. the group is randomized, not the individual).

CLUSTER RANDOMIZED

CROSSOVER This design, obviously, is appropriate only for chronic conditions that are fairly stable over time and for interventions that last a short time within the patient and that do not interfere with one another.

CROSSOVER

CROSSOVER Removing patient variation in this way makes crossover trials potentially more efficient than similar sized, parallel group trials in which each subject is exposed to only one treatment In theory treatment effects can be estimated with greater precision given the same number of subjects.

that the effects CROSSOVER of one treatment may “carry over” and alter the response to subsequent treatments. The usual approach to preventing this is to introduce a washout (no treatment) period between consecutive treatments which is long enough to allow the effects of a treatment to wear off.

FACTORIAL DESIGN two or more experimental interventions are not only evaluated separately but also in combination and against a control

FACTORIAL DESIGN It allows evaluation of the interaction that may exist between two treatments.

FACTORIAL DESIGN two or more experimental interventions are not only evaluated separately but also in combination and against a control

SUPERIORITY AND INFERIORITY

SUPERIORITY AND INFERIORITY • FDA’s regulations on adequate and wellcontrolled studies (21 CFR 314. 126) describe four kinds of concurrently controlled trials that provide evidence of effectiveness. • Three are superiority controlled trials: q placebo q no treatment q dose-response controlled trials

SUPERIORITY
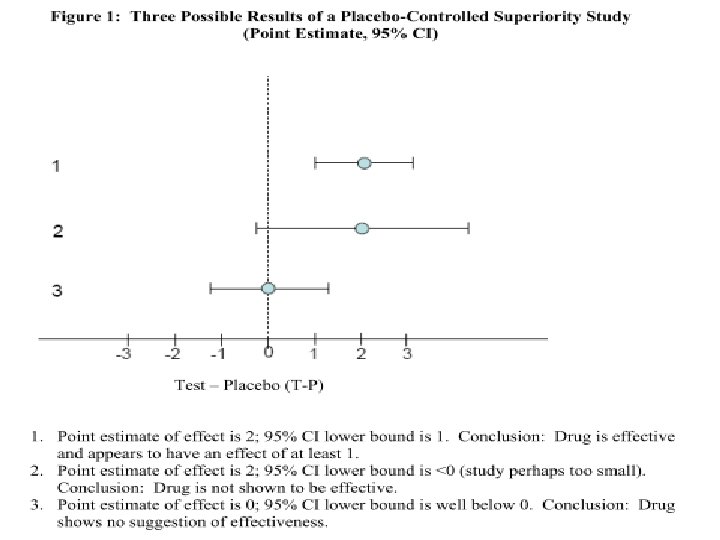

SUPERIORITY A properly designed and conducted superiority trial, is entirely interpretable without further assumptions (other than lack of bias or poor study conduct)

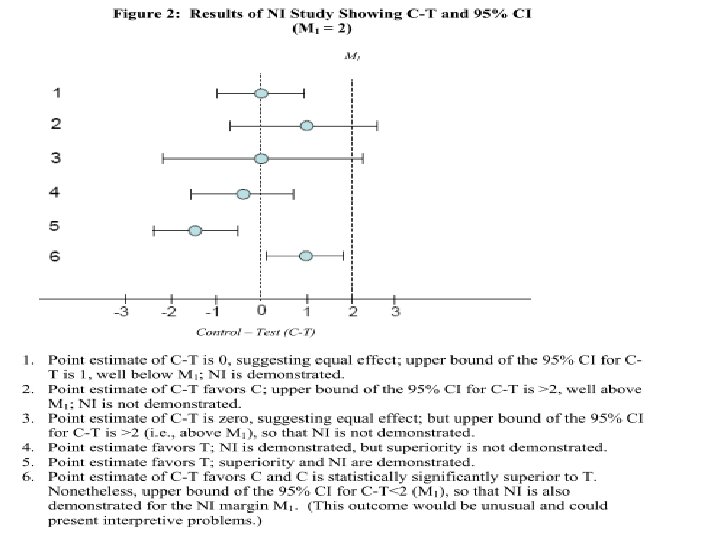
INFERIORITY The difference between the new and active control treatment is enough to support the conclusion that the new test drug is also effective
 of")
INFERIORITY LIMIT M 1 = the largest clinically acceptable difference (degree of inferiority) of the test drug compared to the active control

INFERIORITY LIMIT ü The critical problem, and the major focus of this guidance, is determining M 1 , which is not measured in the NI study (there is no concurrent placebo group). ü It must be estimated (really assumed) based on the past performance of the active control and by comparison of prior test conditions to the current test environment

INFERIORITY LIMIT q. One approach is to specify the equivalence margin on the basis of a clinical notion of a minimally important effect. BUT clearly subjective q. The equivalence margin is often chosen with reference to the effect of the active control in historical placebo-controlled trials.

INFERIORITY LIMIT Someones claims that a positive noninferiority trial implies that the new treatment is superior to placebo. However, this claim requires an assumption that the effect of the active control in the current trial is similar to its effect in the historical trials.

INFERIORITY LIMIT Differences with respect to design features or by an inconsistency in the effect of the active controls among the historical placebo-controlled trials (beyond that expected by random chance) > is often based on the lower bound of a confidence interval for that effect(accounting for within-trial and trial-to-trial variability)

LIMIT OF INFERIORITY • Non-inferiority studies are not conservative in nature since limits in the design and conduct of the study will tend to bias the results towards a conclusion of similarity. • Poor compliance with the study medication, poor diagnostic criteria, excessive variability of measurements, and biased end-point assessment.

RANDOMIZATION

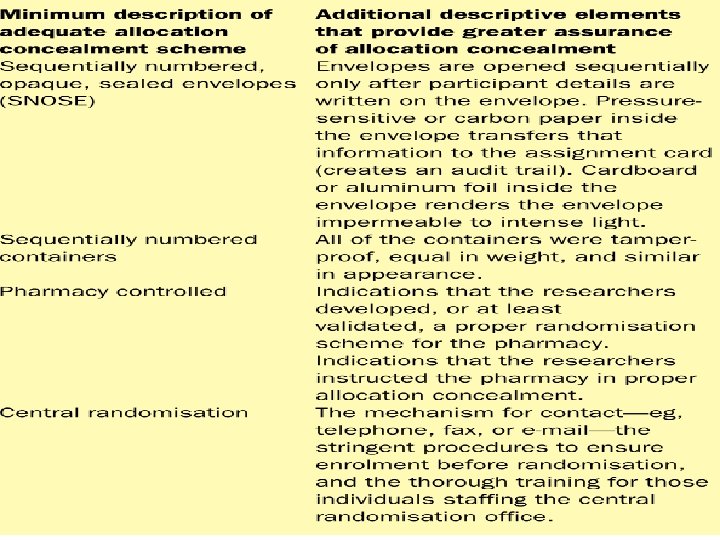
RANDOMIZATION 1 - To conceal 2 - To generate

TO CONCEAL Allocation concealment prevents investigators from influencing which participants are assigned to a given intervention group > Increasing risk of selection bias

Evidence shows that reports of trials reporting inadequate allocation concealment are associated with exaggerated treatment effects

TO GENERATE Use of computer or random number table http: //www. randomization. com/
 and incorporating")
TO GENERATE Balanced randomisation involves selecting certain baseline covariates (called balancing variables) and incorporating them into the randomisation scheme in a way
 RANDOMISATION No other allocation generation approach, irrespective of its complexity and sophistication,")
SIMPLE (UNRESTRICTED) RANDOMISATION No other allocation generation approach, irrespective of its complexity and sophistication, surpasses the unpredictability and bias prevention of simple randomisation.
 RANDOMIZATION With small sample sizes, simple randomisation (one-to-one allocation ratio) can yield")
SIMPLE (UNRESTRICTED) RANDOMIZATION With small sample sizes, simple randomisation (one-to-one allocation ratio) can yield highly disparate sample sizes in the groups by chance, although becoming negligible with trial sizes greater than 200. BUT However, interim analyses with sample sizes of less than 200 might result in disparate group sizes.

RESTRICTED RANDOMISATION It controls the probability of obtaining an allocation sequence with an undesirable sample size imbalance in the intervention groups

BLOCKING METHODS Blocks may be fixed or variable If the block size is fixed, especially if small (six participants or less), the block size could be deciphered in a not double-blinded trial. Longer block sizes—eg, ten or 20—rather than smaller block sizes—four or six—and random variation of block sizes help preserve unpredictability.

RANDOM ALLOCATION RULE For example, for a total study size of 200, placing 100 group A balls and 100 group B balls in a hat and drawing them randomly without replacement symbolises the random allocation rule. It is usually reported as use of envelopes

LIMITS OF RANDOMIZATION Balanced randomisation introduces correlation between treatment groups, which violates the statistical assumption that all patients are independent
 randomisation forces the outcomes between treatment arms to be similar (apart from")
Balanced (simple) randomisation forces the outcomes between treatment arms to be similar (apart from any treatment effect)

LIMITS OF RANDOMIZATION Variables used in the randomisation process should subsequently be adjusted for in the analysis?

STRATIFIED RANDOMIZATION q. For example, with 6 diabetics, there is 22% chance of 5 -1 or 6 -0 split by block randomization only. q. Stratified randomization is the solution to achieve balance within subgroups: use block randomization separately for diabetics and non-diabetics.

STRATIFIED RANDOMIZATIOn q The block size should be relative small to maintain balance in small strata. Increased number of stratification variables or increased number of levels within strata leads to fewer patients per stratum. q Subjects should have baseline measurements taken before randomization. q Large clinical trials don’t use stratification. It is unlikely to get imbalance in subject characteristics in a large randomized trial.

BLINDING
 Keeping the trial participants, care providers, data collectors, and some times those")
BLINDING (MASKING) Keeping the trial participants, care providers, data collectors, and some times those analysing the data, unaware of which intervention is being administered to which participant, so that they will not be influenced by that knowledge.
 Do not use single, double… But symply report who is blinded 1)")
BLINDING (MASKING) Do not use single, double… But symply report who is blinded 1) Patients 2) Those assessing the outcome 3) Those administering the intervention
")
BLINDING (MASKING)
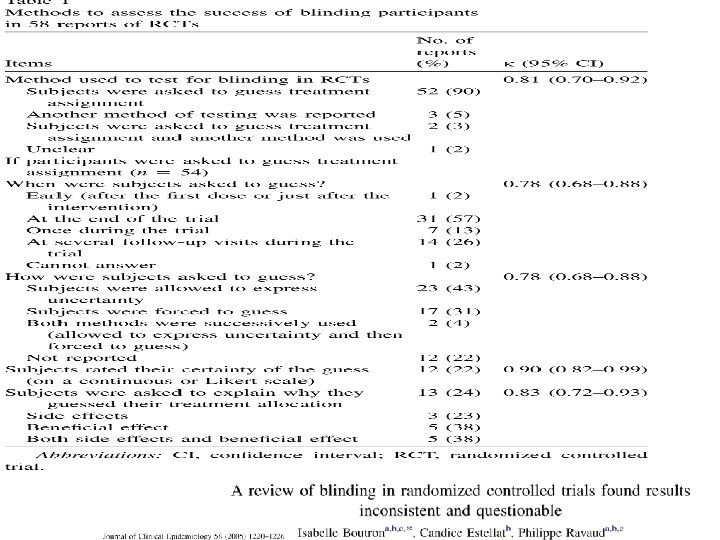

q. The success of blinding could be assessed early in the first days of the study if possible before the evidence of efficacy q. Subjects could be asked to guess treatment assignment, but they should be allowed to express uncertainty and answer ‘‘do not know. ’’ q. If subjects are asked to guess treatment assignment, subjects’ answers (for example placebo/treatment/Do not know) should be reported for each group.

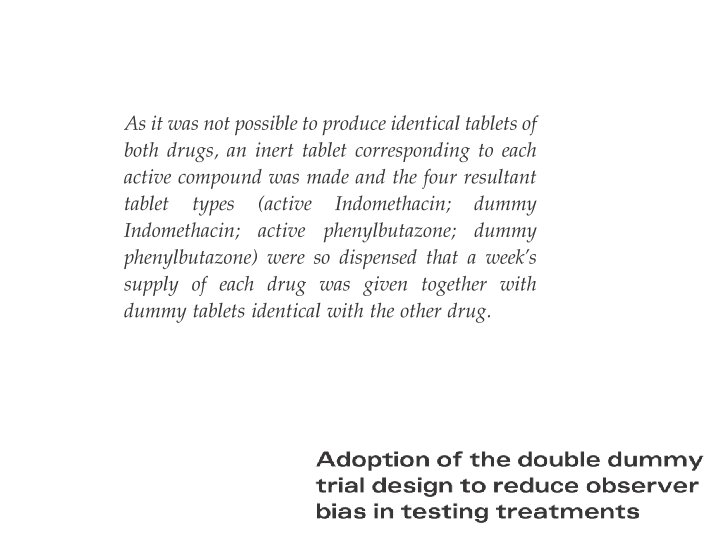
DOUBLE DUMMY

SAMPLE SIZE COMPUTATION

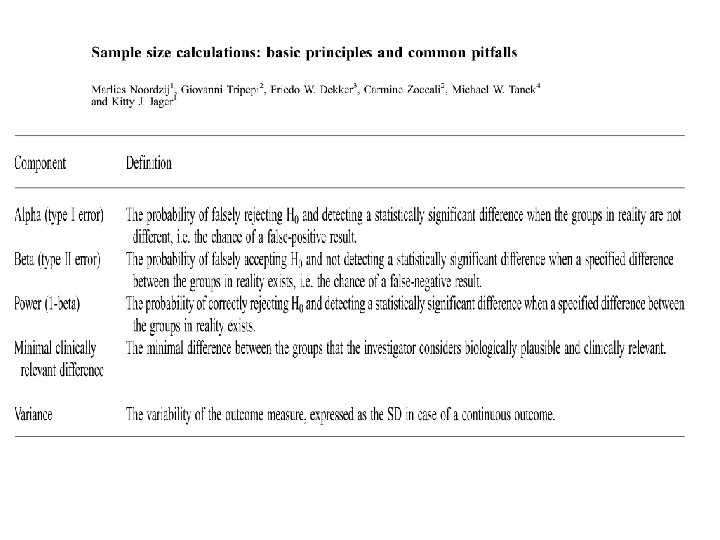
SAMPLE SIZE COMPUTATION The aim of an a priori sample size calculation is mainly to determinate the number of participants needed to detect a clinically relevant treatment effect.

q Type 1 error and power are usually fixed at conventional levels (5% for type I error, 80% or 90% for power). q Assumptions related to the control group are often prespecified on the basis of previously observed data or published results, and the expected treatment effect is expected to be hypothesised as a clinically meaningful effect.

HOW TO MINIMIZE SAMPLE SIZE • Use Continuous Measurements Instead of Categories • Use More Precise Measurements • Use Paired Measurements • Expand the Minimum Expected Difference • Use Unequal Group Sizes

SAMPLE SIZE FOR NON INFERIORITY For NI trial A small sample size is needed

To evaluate sample size for a new drug with 20% of failure compared to 25% in the standard group: - 1461 for group for superiority trial - 298 for group (limit of inferiority 5) - 133 for group (limit of inferiority 10)

AD INTERIM ANALYSIS

AD INTERIM ANALYSIS The interests of participants should be best served if recruitment is closed as soon as a clear answer is available Vs The interests of society should be best met if recruitment continues until there is a clear answer (such that the results are sufficiently conclusive to lead to changes in the clinical management of future patients).

INDEPENDENT DATA MONITORING COMMITTEE q Is the inclusion rate of patients acceptable and as expected? q Is there an unexpectedly high rate of severe or life-threatening adverse events, which may indicate the premature closure of the trial? q Is the outcome of the trial treatment comparable with that of the previous experience upon which the specific trial is based?

INDEPENDENT DATA MONITORING COMMITTEE If the interim analysis demonstrated a statistical significant differences between the trial treatments that exceed the differences defined by the statistical guidelines of the trial then this would warrant closure of the study.

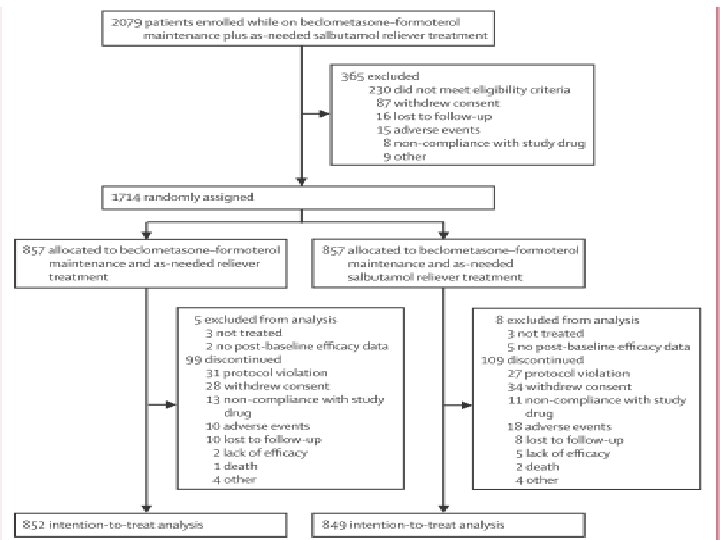
INTENTION TO TREAT vs AS TREATED

INTENTION TO TREAT • Use every subject who was randomized according to randomized treatment assignment. • � Ignore noncompliance, protocol deviations, withdrawal, and anything that happens after randomization • The ITT analysis holds the randomization as of paramount importance • � Deviation from the original randomized groups can contaminate the treatment comparison

WHY INCLUDE NONCOMPLIANT SUBJECTS IN ITT ANALYSIS? q� Compliance or noncompliance occurs after randomization q� Attempting to account for noncompliance by excluding noncompliant subjects can bias the treatment evaluation q In clinical practice, some patients are not fully compliant q� Compliant subjects usually have better outcomes than noncompliant subjects, regardless of treatment

AS PROTOCOL/AS TREATED All participants are analyzed according to the treatment they actually received, regardless of what treatment they were originally allocated. While this may have some initial appeal, once again the effect of random allocation is compromised, making the interpretation of the results difficult.
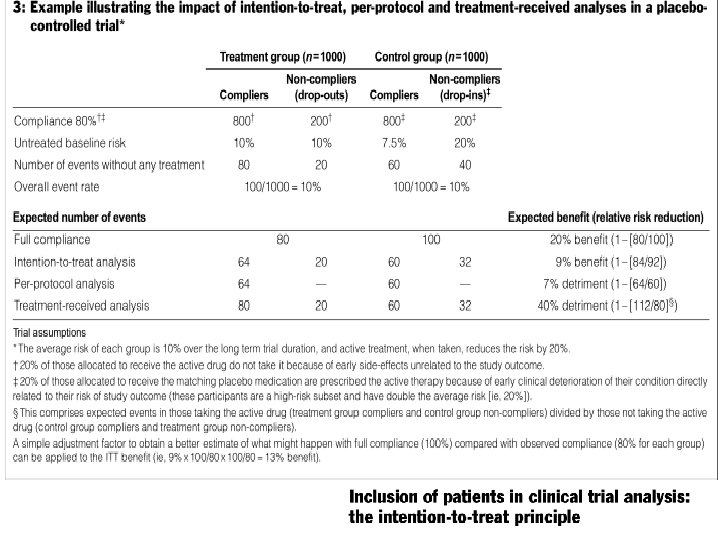

Intention to treat analysis How can we decide on 5 events? As treated analysis

SUBGROUP ANALYSIS

SUBGROUP ANALYSIS If many are performed, it becomes likely that one or more will spuriously be statistically significant. In fact, if the subjects in a trial randomized between treatment groups A and B are partitioned into G mutually exclusive subgroups and a statistical significance test at α=0. 05 is conducted within each subgroup, then even if there is no true effect, the probability of at least one significant result is 1 – (1 – α )G.

SUBGROUP ANALYSIS For α 0. 05 and G 5, this probability is 23 percent; for α 0. 05 and G 10, the probability is 40 percent Subgroup analyses also produce misleading reversals of effects, especially if the overall result is barely significant.

SUBGROUP ANALYSIS q. A commonly used method for adjusting is dividing the overall significance level by the total number of subgroup analyses, also called the Bonferroni method. q. For example, in a study with a significance level of 0. 05 and 10 subgroup analyses, the significance level for each subgroup analysis would be 0. 005. q. However, some statisticians state that significant results are rarely observed after adjustment with the Bonferroni method

SUBGROUP ANALYSIS The pre-specificed ones that is according to stratified randomization are the most reliables ones

TAKE HOME MESSAGES - Check how randomization is performed - Check how blinding is performed - Check about superiority and inferiority structure

THANKS A LOT!!!!
- Slides: 87