
Random Graph Models CreateExplain Complex Network Properties Thrasyvoulos
![Preferential Attachment in Networks “The rich get richer” Ø First considered by [Price 65]](https://slidetodoc.com/presentation_image_h/9f780d3a5d9a40a78b5d4d89040a7a6c/image-28.jpg "Preferential Attachment in Networks “The rich get richer” Ø First considered by [Price 65]")
- Slides: 48
Random Graph Models: Create/Explain Complex Network Properties Thrasyvoulos Spyropoulos / spyropoul@eurecom. fr Eurecom, Sophia-Antipolis
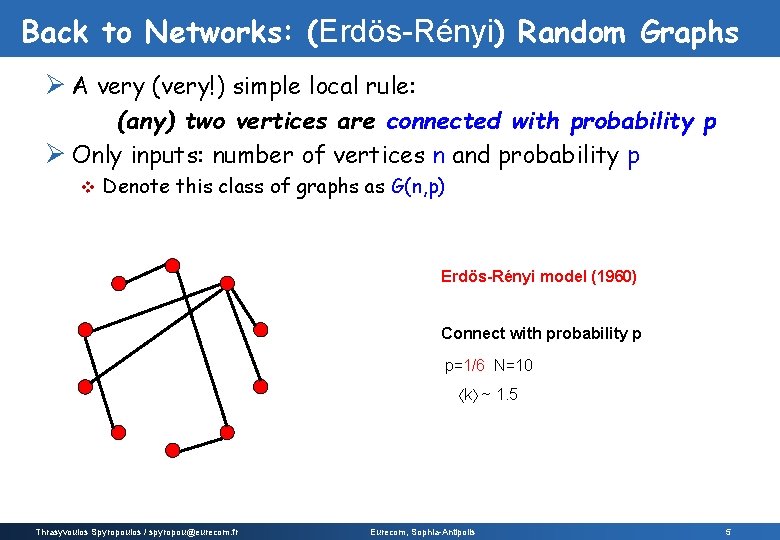
Random Graph Models: Why do we Need Them? Ø The networks discussed are quite large! v Impossible to describe or visualize explicitly. Ø Consider this example: You have a new Internet routing algorithm v You want to evaluate it, but do not have a trace of the Internet topology v You decide to create an “Internet-like” graph on which you will run your algorithm v How do you describe/create this graph? ? v Ø Random graphs: local and probabilistic rules by which vertices are connected Ø Goal: from simple probabilistic rules to observed complexity Q: Which rules gives us (most of) the observed properties? Thrasyvoulos Spyropoulos / spyropou@eurecom. fr Eurecom, Sophia-Antipolis 2
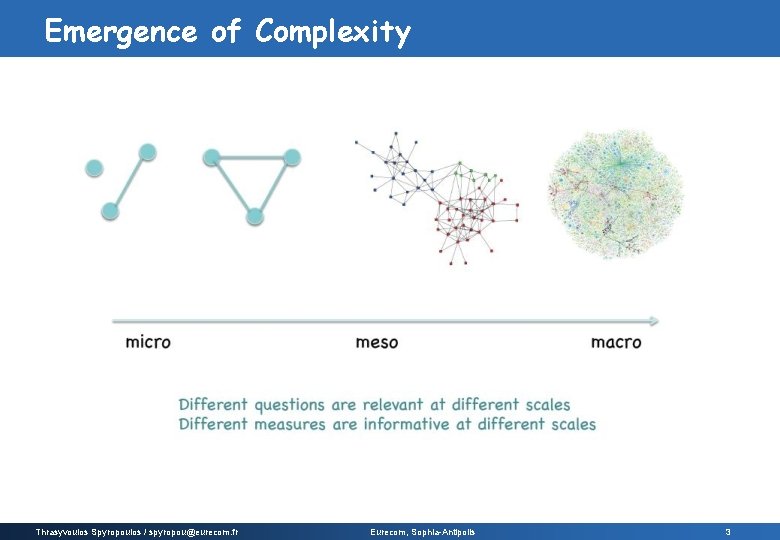
Emergence of Complexity Thrasyvoulos Spyropoulos / spyropou@eurecom. fr Eurecom, Sophia-Antipolis 3
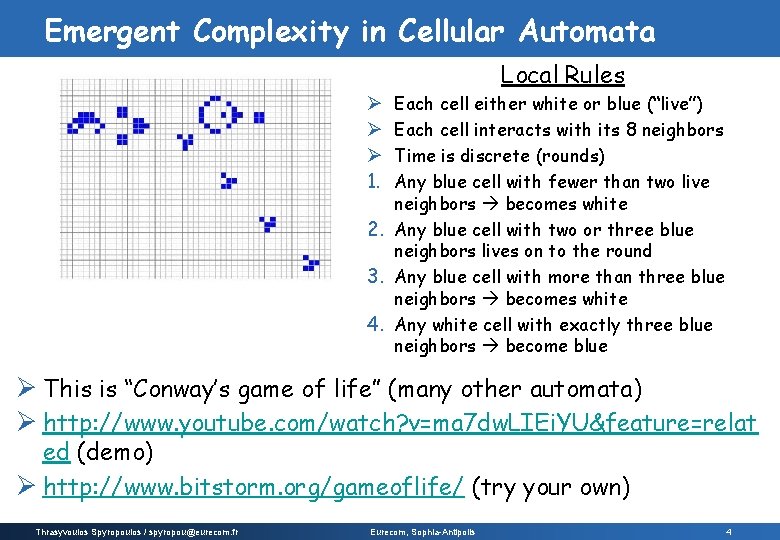
Emergent Complexity in Cellular Automata Local Rules Each cell either white or blue (“live”) Each cell interacts with its 8 neighbors Time is discrete (rounds) Any blue cell with fewer than two live neighbors becomes white 2. Any blue cell with two or three blue neighbors lives on to the round 3. Any blue cell with more than three blue neighbors becomes white 4. Any white cell with exactly three blue neighbors become blue Ø Ø Ø 1. Ø This is “Conway’s game of life” (many other automata) Ø http: //www. youtube. com/watch? v=ma 7 dw. LIEi. YU&feature=relat ed (demo) Ø http: //www. bitstorm. org/gameoflife/ (try your own) Thrasyvoulos Spyropoulos / spyropou@eurecom. fr Eurecom, Sophia-Antipolis 4
Back to Networks: (Erdös-Rényi) Random Graphs Ø A very (very!) simple local rule: (any) two vertices are connected with probability p Ø Only inputs: number of vertices n and probability p v Denote this class of graphs as G(n, p) Erdös-Rényi model (1960) Connect with probability p p=1/6 N=10 k ~ 1. 5 Thrasyvoulos Spyropoulos / spyropou@eurecom. fr Eurecom, Sophia-Antipolis 5
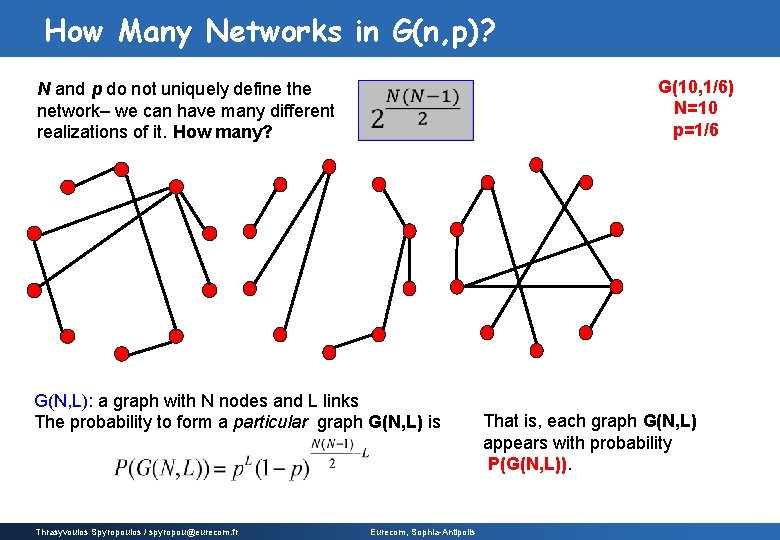
How Many Networks in G(n, p)? N and p do not uniquely define the network– we can have many different realizations of it. How many? G(N, L): a graph with N nodes and L links The probability to form a particular graph G(N, L) is Thrasyvoulos Spyropoulos / spyropou@eurecom. fr Eurecom, Sophia-Antipolis G(10, 1/6) N=10 p=1/6 That is, each graph G(N, L) appears with probability P(G(N, L)).
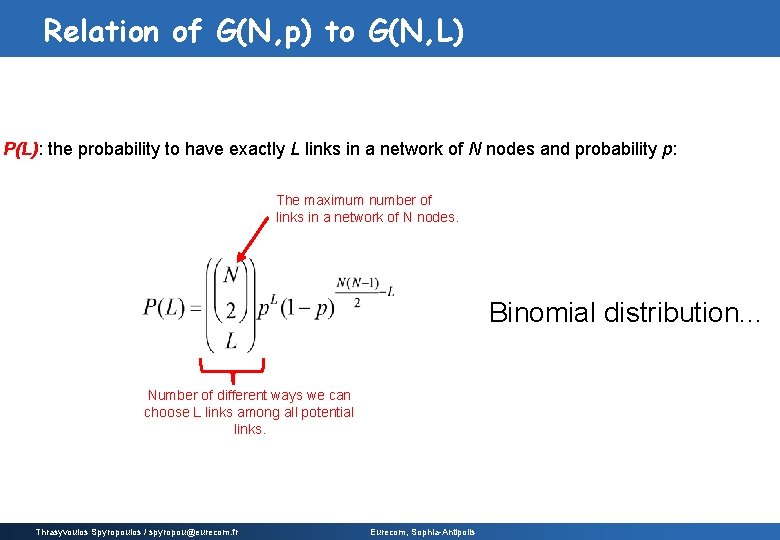
Relation of G(N, p) to G(N, L) P(L): the probability to have exactly L links in a network of N nodes and probability p: The maximum number of links in a network of N nodes. Binomial distribution. . . Number of different ways we can choose L links among all potential links. Thrasyvoulos Spyropoulos / spyropou@eurecom. fr Eurecom, Sophia-Antipolis
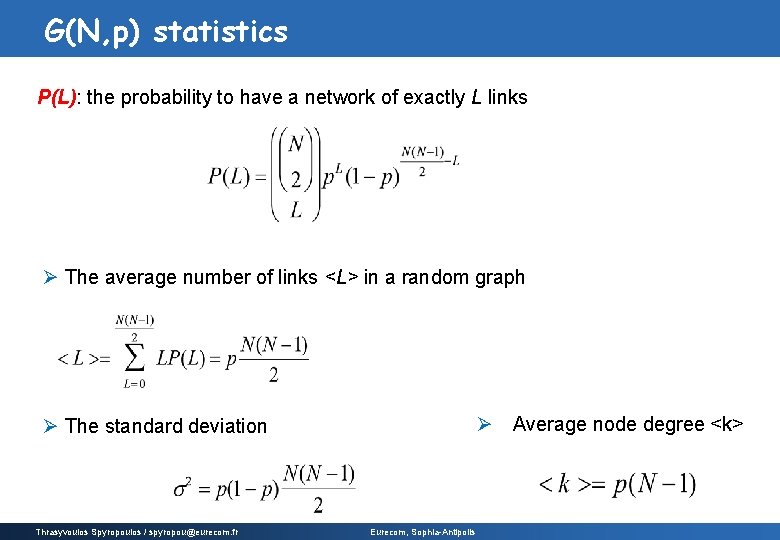
G(N, p) statistics P(L): the probability to have a network of exactly L links Ø The average number of links <L> in a random graph Ø Average node degree <k> Ø The standard deviation Thrasyvoulos Spyropoulos / spyropou@eurecom. fr Eurecom, Sophia-Antipolis
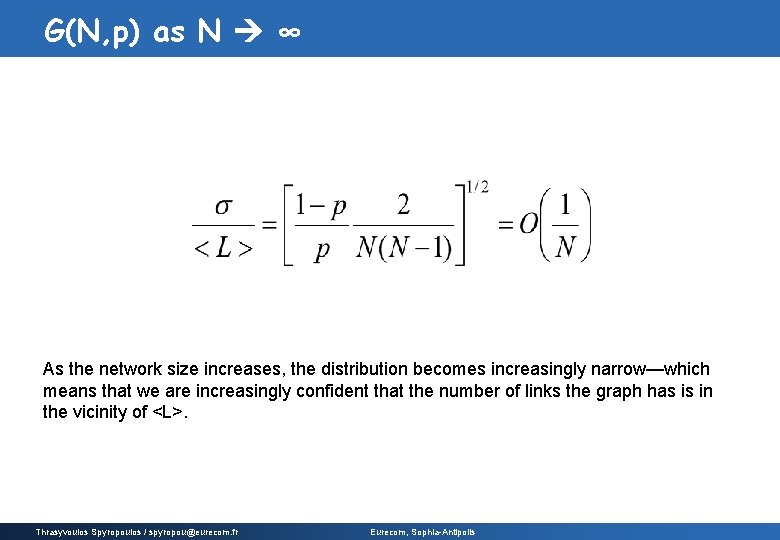
G(N, p) as N ∞ As the network size increases, the distribution becomes increasingly narrow—which means that we are increasingly confident that the number of links the graph has is in the vicinity of <L>. Thrasyvoulos Spyropoulos / spyropou@eurecom. fr Eurecom, Sophia-Antipolis
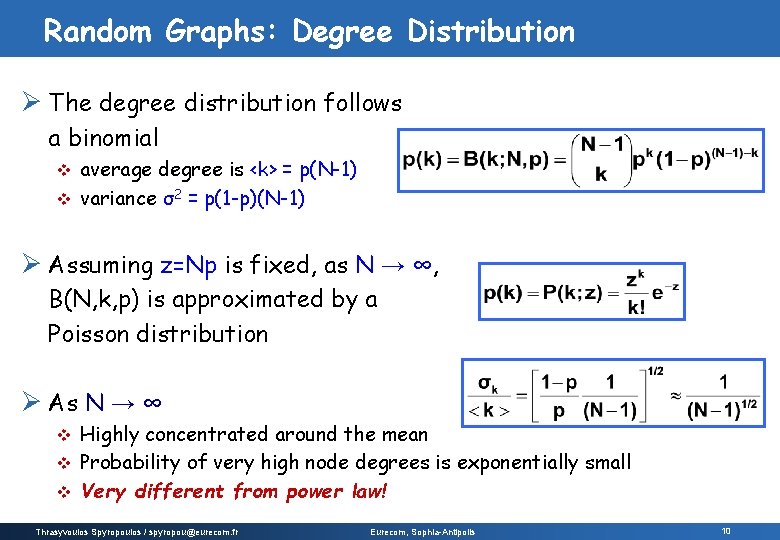
Random Graphs: Degree Distribution Ø The degree distribution follows a binomial average degree is <k> = p(N-1) v variance σ2 = p(1 -p)(N-1) v Ø Assuming z=Np is fixed, as N → ∞, B(N, k, p) is approximated by a Poisson distribution Ø As N → ∞ Highly concentrated around the mean v Probability of very high node degrees is exponentially small v Very different from power law! v Thrasyvoulos Spyropoulos / spyropou@eurecom. fr Eurecom, Sophia-Antipolis 10
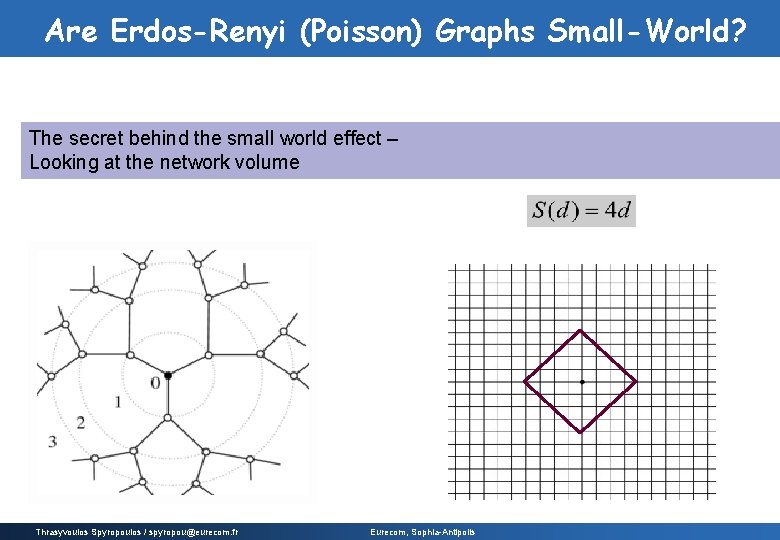
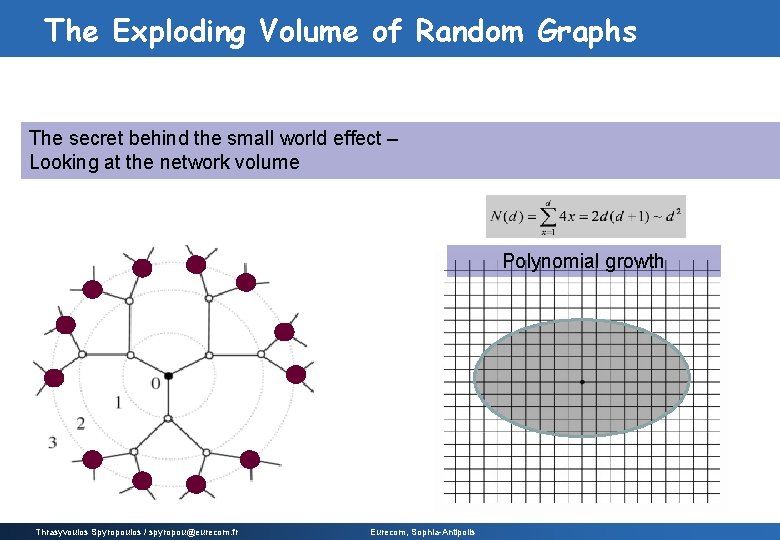
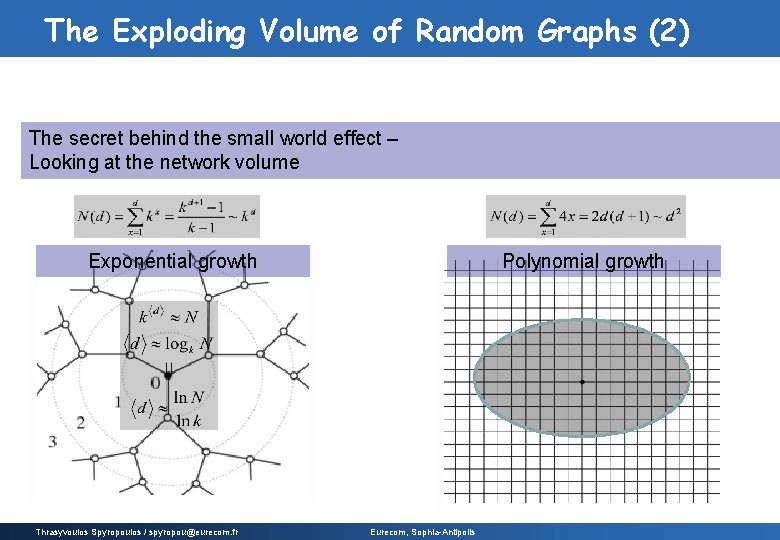
Are Erdos-Renyi (Poisson) Graphs Small-World? The secret behind the small world effect – Looking at the network volume Thrasyvoulos Spyropoulos / spyropou@eurecom. fr Eurecom, Sophia-Antipolis
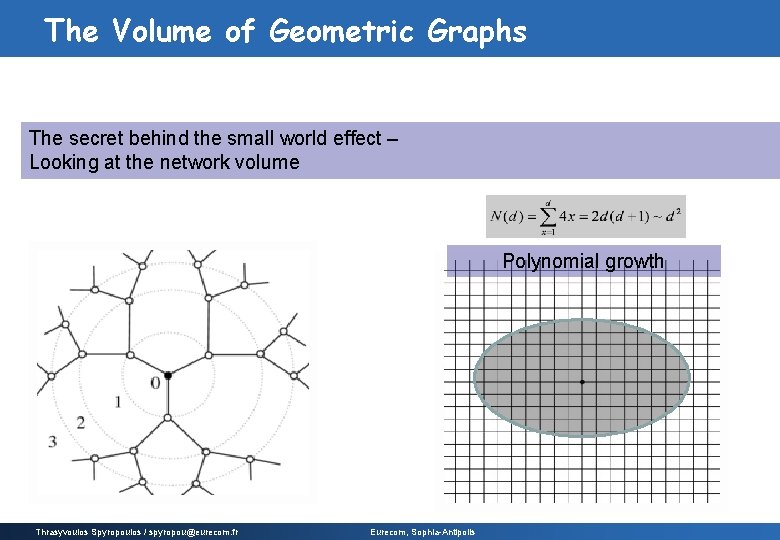
The Volume of Geometric Graphs The secret behind the small world effect – Looking at the network volume Polynomial growth Thrasyvoulos Spyropoulos / spyropou@eurecom. fr Eurecom, Sophia-Antipolis
The Exploding Volume of Random Graphs The secret behind the small world effect – Looking at the network volume Polynomial growth Thrasyvoulos Spyropoulos / spyropou@eurecom. fr Eurecom, Sophia-Antipolis
The Exploding Volume of Random Graphs (2) The secret behind the small world effect – Looking at the network volume Exponential growth Thrasyvoulos Spyropoulos / spyropou@eurecom. fr Polynomial growth Eurecom, Sophia-Antipolis
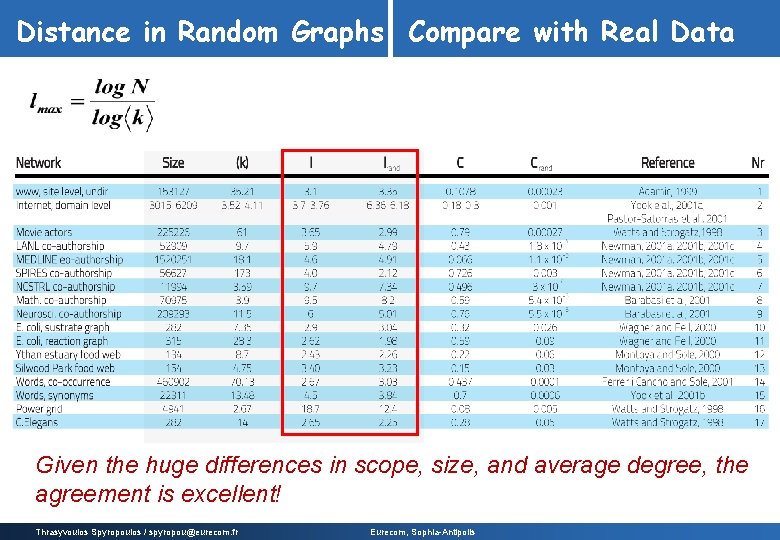
Distance in Random Graphs Compare with Real Data Given the huge differences in scope, size, and average degree, the agreement is excellent! Thrasyvoulos Spyropoulos / spyropou@eurecom. fr Eurecom, Sophia-Antipolis
Random Graphs: Clustering Co-efficient Ø Consider a random graph G(n, p) Q: What is the probability that two of your neighbors are also neighbors? A: It is equal to p, independent of local structure Ø clustering coefficient C = p Ø when z is fixed (sparse networks): C = z/n =O(1/n) Thrasyvoulos Spyropoulos / spyropou@eurecom. fr Eurecom, Sophia-Antipolis 16
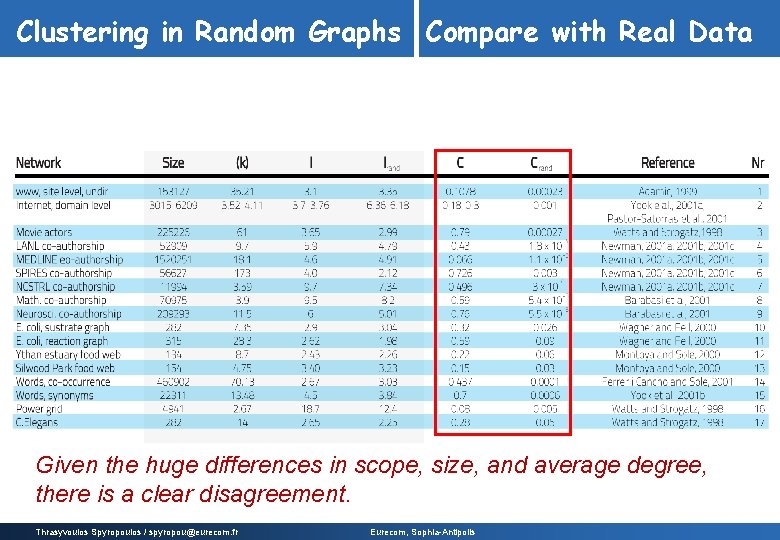
Clustering in Random Graphs Compare with Real Data Given the huge differences in scope, size, and average degree, there is a clear disagreement. Thrasyvoulos Spyropoulos / spyropou@eurecom. fr Eurecom, Sophia-Antipolis
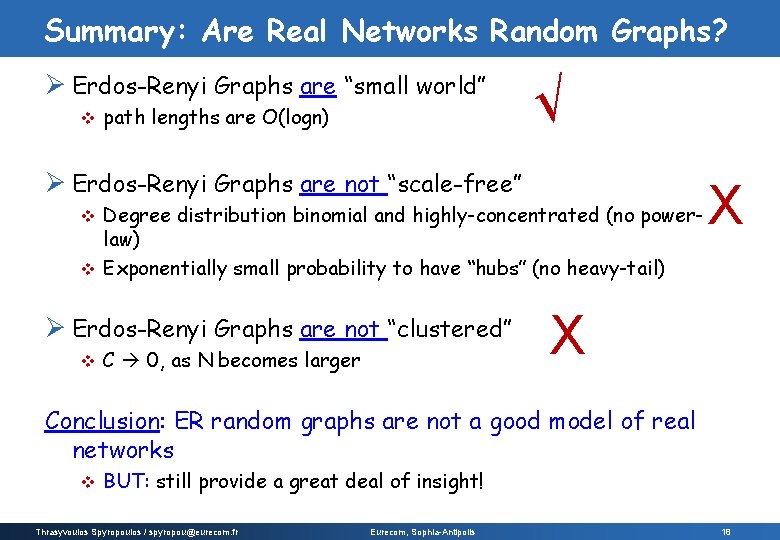
Summary: Are Real Networks Random Graphs? Ø Erdos-Renyi Graphs are “small world” v path lengths are O(logn) √ Ø Erdos-Renyi Graphs are not “scale-free” Degree distribution binomial and highly-concentrated (no powerlaw) v Exponentially small probability to have “hubs” (no heavy-tail) v Ø Erdos-Renyi Graphs are not “clustered” v C 0, as N becomes larger X X Conclusion: ER random graphs are not a good model of real networks v BUT: still provide a great deal of insight! Thrasyvoulos Spyropoulos / spyropou@eurecom. fr Eurecom, Sophia-Antipolis 18
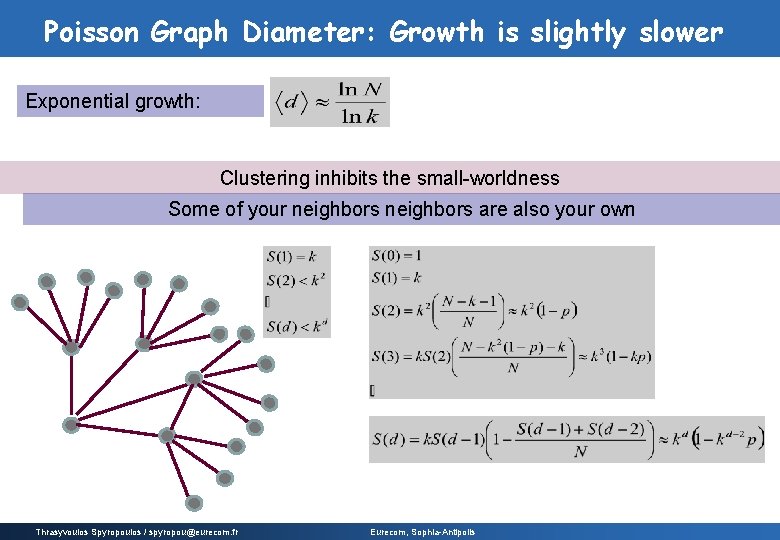
Poisson Graph Diameter: Growth is slightly slower Exponential growth: Clustering inhibits the small-worldness Some of your neighbors are also your own Thrasyvoulos Spyropoulos / spyropou@eurecom. fr Eurecom, Sophia-Antipolis
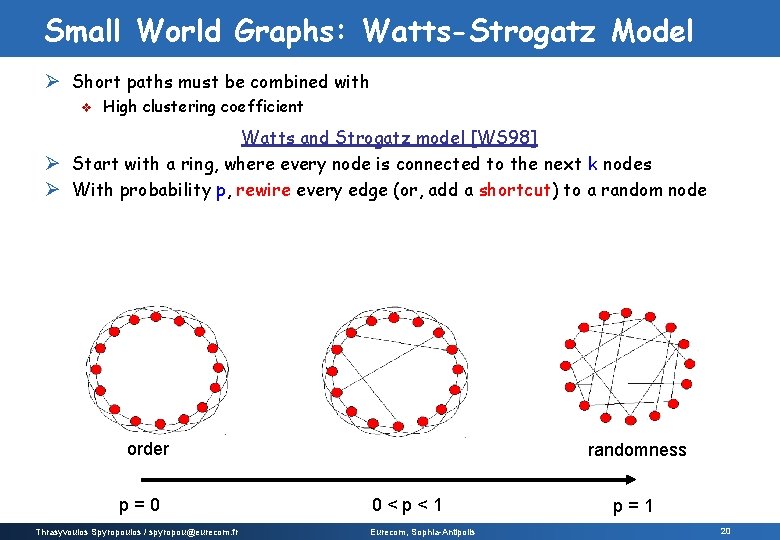
Small World Graphs: Watts-Strogatz Model Ø Short paths must be combined with v High clustering coefficient Watts and Strogatz model [WS 98] Ø Start with a ring, where every node is connected to the next k nodes Ø With probability p, rewire every edge (or, add a shortcut) to a random node order p = 0 Thrasyvoulos Spyropoulos / spyropou@eurecom. fr randomness 0 < p < 1 Eurecom, Sophia-Antipolis p = 1 20
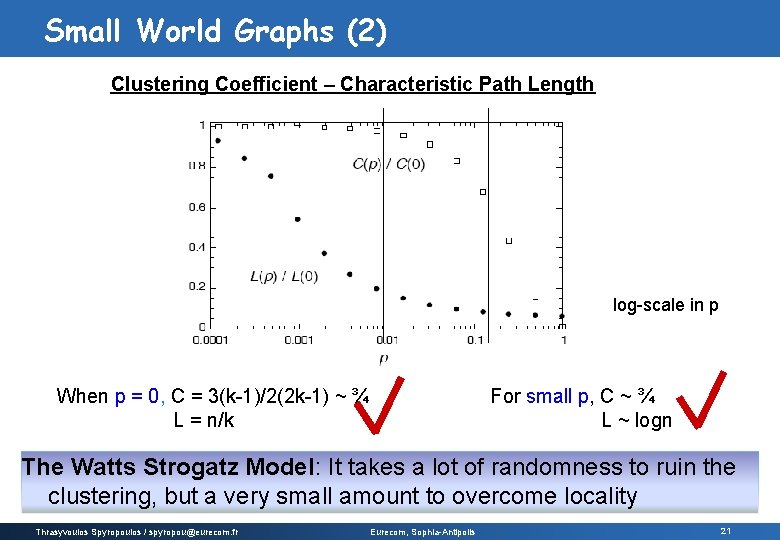
Small World Graphs (2) Clustering Coefficient – Characteristic Path Length log-scale in p For small p, C ~ ¾ L ~ logn When p = 0, C = 3(k-1)/2(2 k-1) ~ ¾ L = n/k The Watts Strogatz Model: It takes a lot of randomness to ruin the clustering, but a very small amount to overcome locality Thrasyvoulos Spyropoulos / spyropou@eurecom. fr Eurecom, Sophia-Antipolis 21
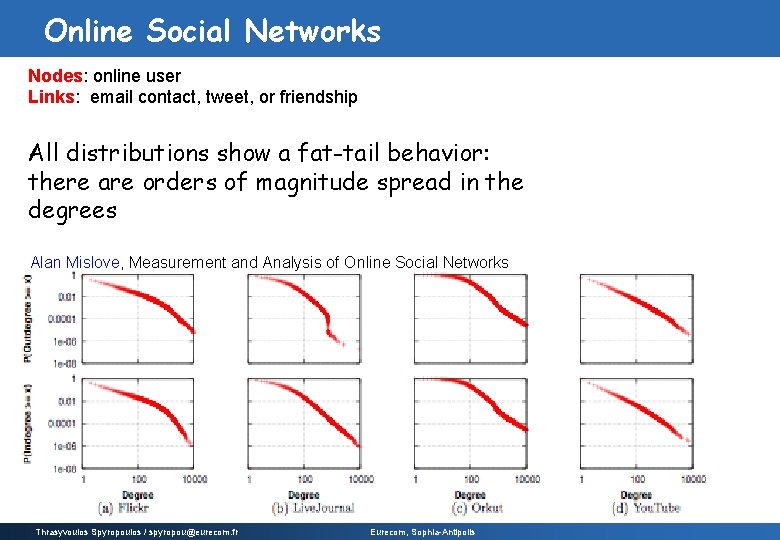
Online Social Networks Nodes: online user Links: email contact, tweet, or friendship All distributions show a fat-tail behavior: there are orders of magnitude spread in the degrees Alan Mislove, Measurement and Analysis of Online Social Networks Thrasyvoulos Spyropoulos / spyropou@eurecom. fr Eurecom, Sophia-Antipolis
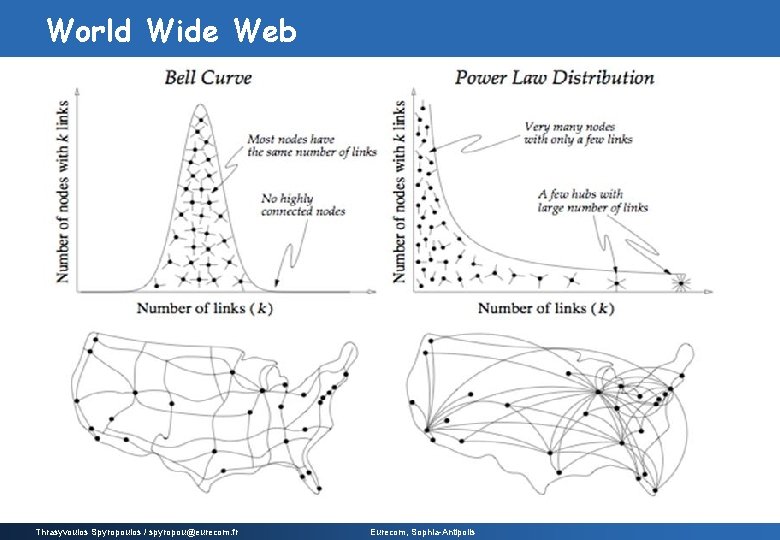
World Wide Web Thrasyvoulos Spyropoulos / spyropou@eurecom. fr Eurecom, Sophia-Antipolis
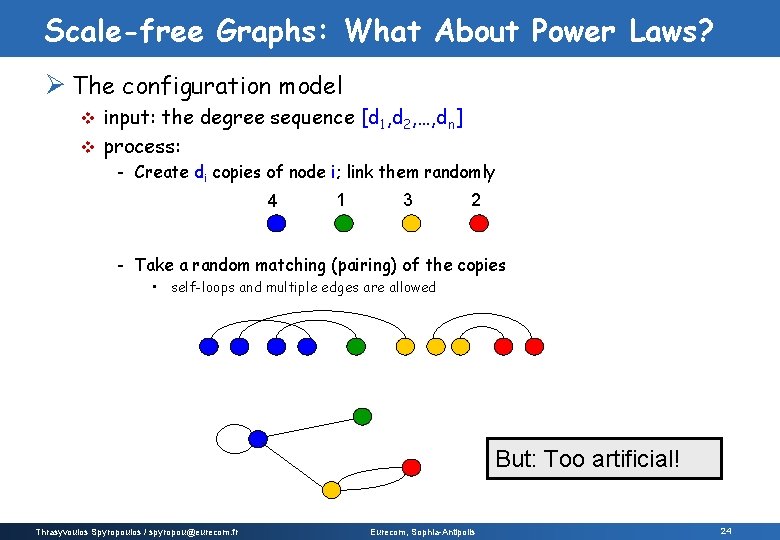
Scale-free Graphs: What About Power Laws? Ø The configuration model input: the degree sequence [d 1, d 2, …, dn] v process: v - Create di copies of node i; link them randomly 4 1 3 2 - Take a random matching (pairing) of the copies • self-loops and multiple edges are allowed But: Too artificial! Thrasyvoulos Spyropoulos / spyropou@eurecom. fr Eurecom, Sophia-Antipolis 24
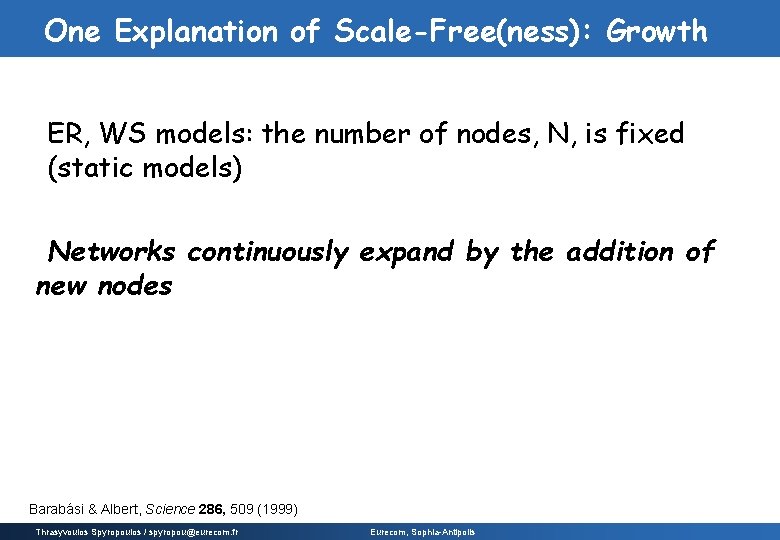
One Explanation of Scale-Free(ness): Growth ER, WS models: the number of nodes, N, is fixed (static models) Networks continuously expand by the addition of new nodes Barabási & Albert, Science 286, 509 (1999) Thrasyvoulos Spyropoulos / spyropou@eurecom. fr Eurecom, Sophia-Antipolis
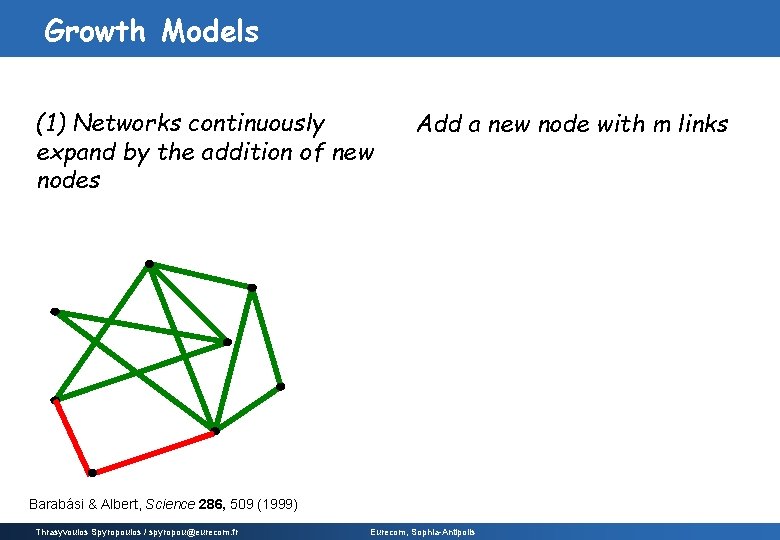
Growth Models (1) Networks continuously expand by the addition of new nodes Add a new node with m links Barabási & Albert, Science 286, 509 (1999) Thrasyvoulos Spyropoulos / spyropou@eurecom. fr Eurecom, Sophia-Antipolis
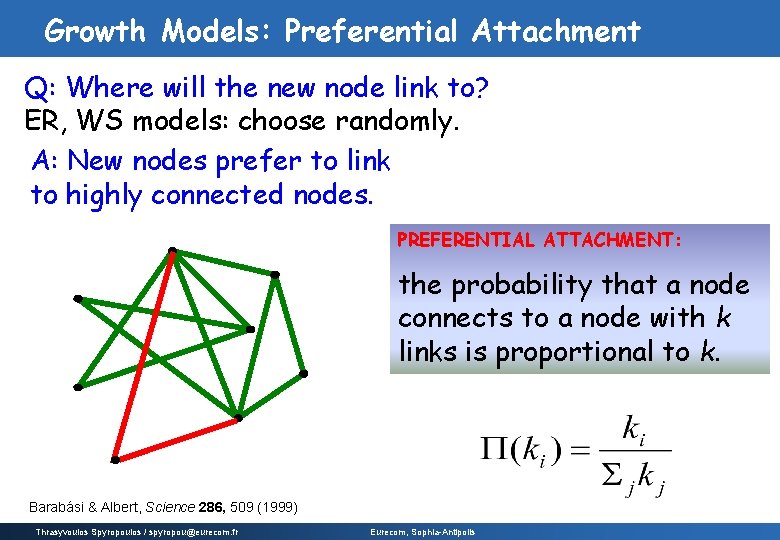
Growth Models: Preferential Attachment Q: Where will the new node link to? ER, WS models: choose randomly. A: New nodes prefer to link to highly connected nodes. PREFERENTIAL ATTACHMENT: the probability that a node connects to a node with k links is proportional to k. Barabási & Albert, Science 286, 509 (1999) Thrasyvoulos Spyropoulos / spyropou@eurecom. fr Eurecom, Sophia-Antipolis
Preferential Attachment in Networks “The rich get richer” Ø First considered by [Price 65] as a model for citation networks each new paper is generated with m citations (on average) v new papers cite previous papers with probability proportional to their indegree (citations) v what about papers without any citations? v - each paper is considered to have a “default” citation - probability of citing a paper with degree k, proportional to k+1 Ø Power law with exponent α = 2+1/m Thrasyvoulos Spyropoulos / spyropou@eurecom. fr Eurecom, Sophia-Antipolis 28
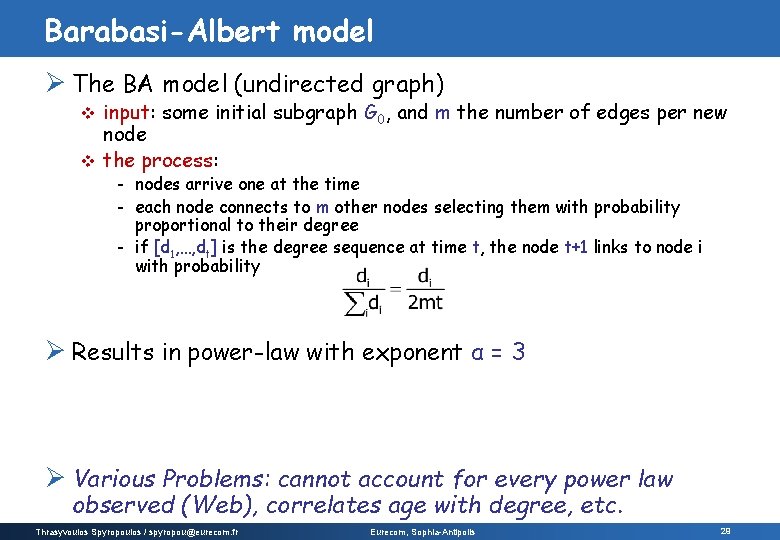
Barabasi-Albert model Ø The BA model (undirected graph) input: some initial subgraph G 0, and m the number of edges per new node v the process: v - nodes arrive one at the time - each node connects to m other nodes selecting them with probability proportional to their degree - if [d 1, …, dt] is the degree sequence at time t, the node t+1 links to node i with probability Ø Results in power-law with exponent α = 3 Ø Various Problems: cannot account for every power law observed (Web), correlates age with degree, etc. Thrasyvoulos Spyropoulos / spyropou@eurecom. fr Eurecom, Sophia-Antipolis 29
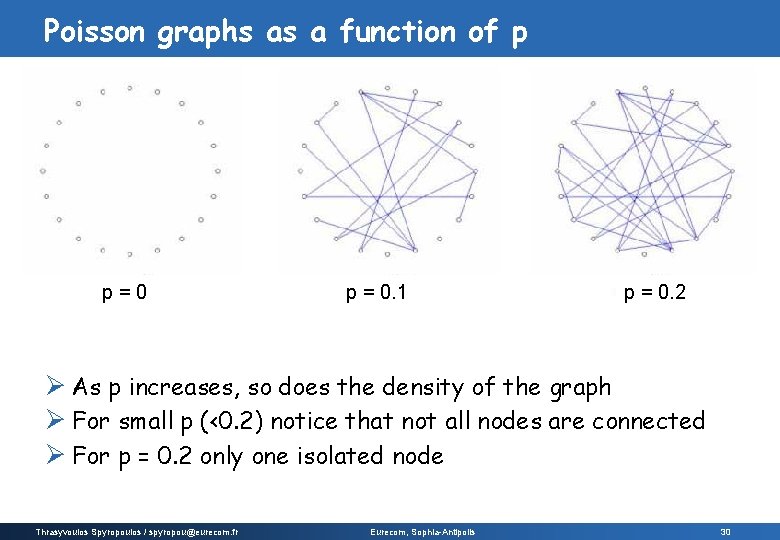
Poisson graphs as a function of p p = 0. 1 p = 0. 2 Ø As p increases, so does the density of the graph Ø For small p (<0. 2) notice that not all nodes are connected Ø For p = 0. 2 only one isolated node Thrasyvoulos Spyropoulos / spyropou@eurecom. fr Eurecom, Sophia-Antipolis 30
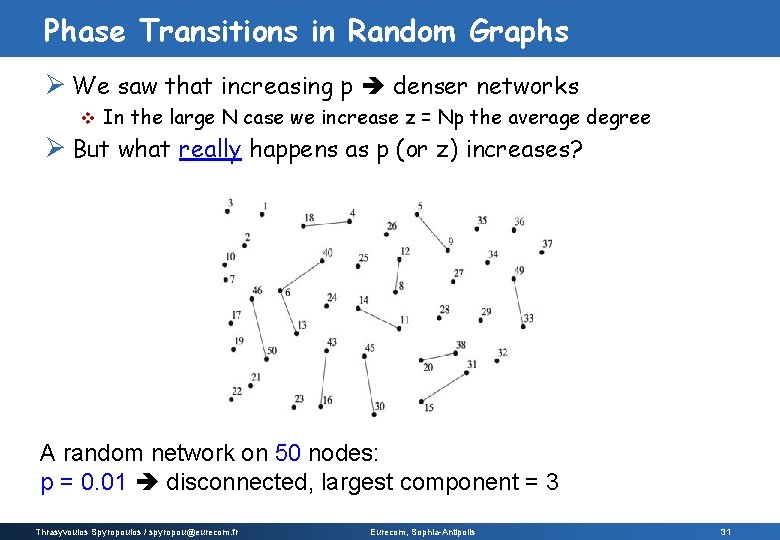
Phase Transitions in Random Graphs Ø We saw that increasing p denser networks v In the large N case we increase z = Np the average degree Ø But what really happens as p (or z) increases? A random network on 50 nodes: p = 0. 01 disconnected, largest component = 3 Thrasyvoulos Spyropoulos / spyropou@eurecom. fr Eurecom, Sophia-Antipolis 31
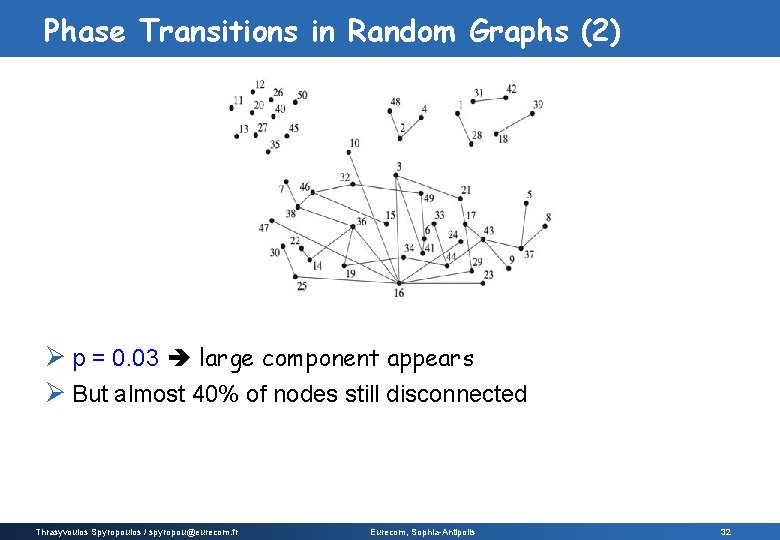
Phase Transitions in Random Graphs (2) Ø p = 0. 03 large component appears Ø But almost 40% of nodes still disconnected Thrasyvoulos Spyropoulos / spyropou@eurecom. fr Eurecom, Sophia-Antipolis 32
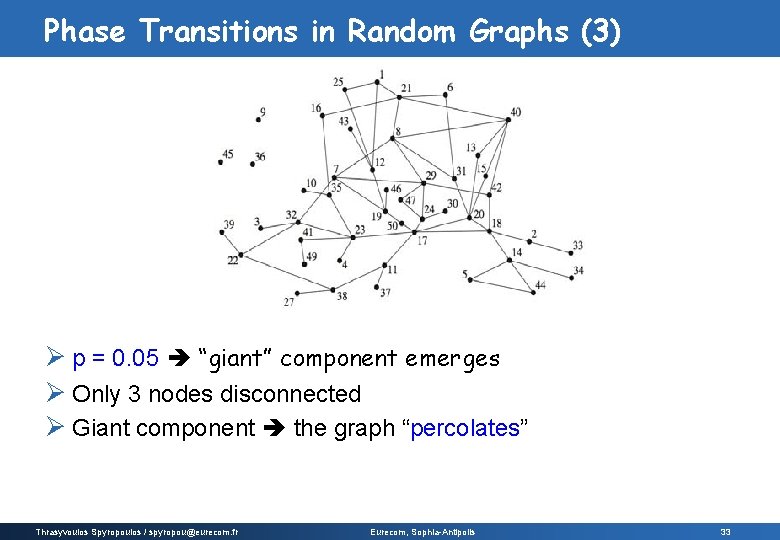
Phase Transitions in Random Graphs (3) Ø p = 0. 05 “giant” component emerges Ø Only 3 nodes disconnected Ø Giant component the graph “percolates” Thrasyvoulos Spyropoulos / spyropou@eurecom. fr Eurecom, Sophia-Antipolis 33
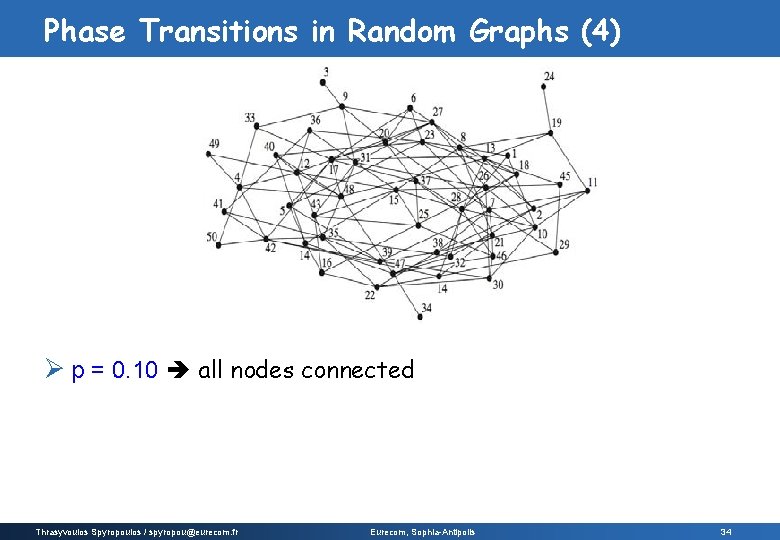
Phase Transitions in Random Graphs (4) Ø p = 0. 10 all nodes connected Thrasyvoulos Spyropoulos / spyropou@eurecom. fr Eurecom, Sophia-Antipolis 34
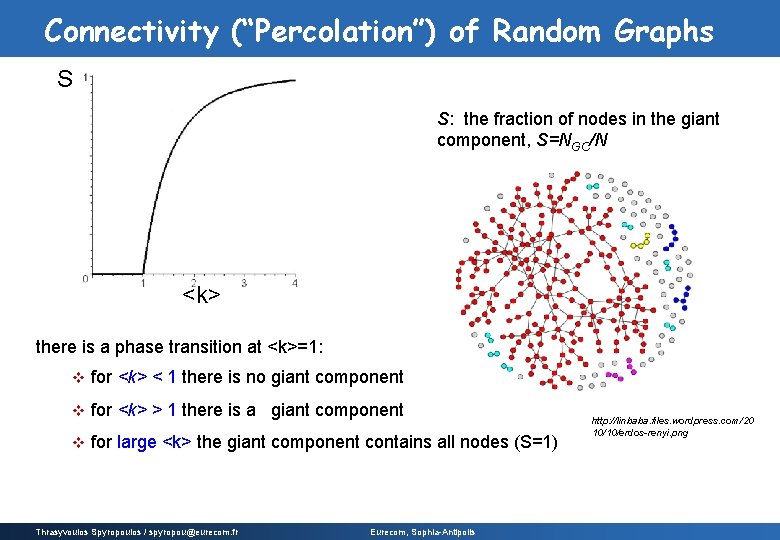
Connectivity (“Percolation”) of Random Graphs S S: the fraction of nodes in the giant component, S=NGC/N <k> there is a phase transition at <k>=1: v for <k> < 1 there is no giant component v for <k> > 1 there is a giant component v for large <k> the giant component contains all nodes (S=1) Thrasyvoulos Spyropoulos / spyropou@eurecom. fr Eurecom, Sophia-Antipolis http: //linbaba. files. wordpress. com/20 10/10/erdos-renyi. png
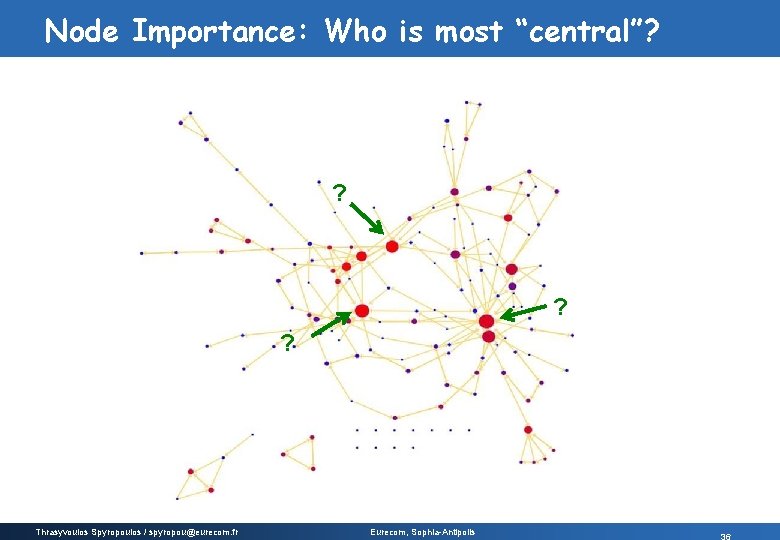
Node Importance: Who is most “central”? ? ? ? Thrasyvoulos Spyropoulos / spyropou@eurecom. fr Eurecom, Sophia-Antipolis
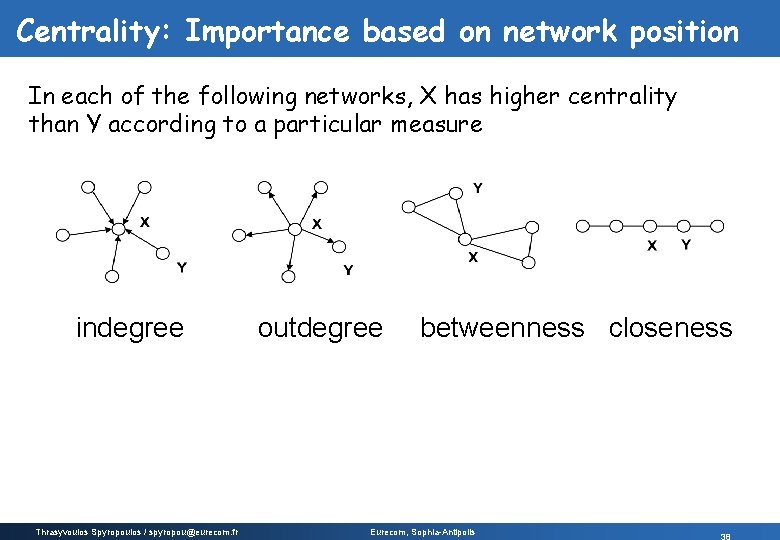
Node Centrality: Depends on Application Ø Influence: Which social network nodes should I pick to advertise/spread a video/product/opinion? Ø Resilience: Which node(s) should I attack to disconnect the network? Ø Malware/Virus Infection: Which nodes should I immunize (e. g. upload a patch) to stop a given Internet “worm” from spreading quickly? Ø Performance: Which nodes are the bottleneck in a network? Ø Search Engines: Which nodes contain the most relevant information? Ø A centrality measure implicitly solves some optimization problem Thrasyvoulos Spyropoulos / spyropou@eurecom. fr Eurecom, Sophia-Antipolis
Centrality: Importance based on network position In each of the following networks, X has higher centrality than Y according to a particular measure indegree Thrasyvoulos Spyropoulos / spyropou@eurecom. fr outdegree betweenness closeness Eurecom, Sophia-Antipolis
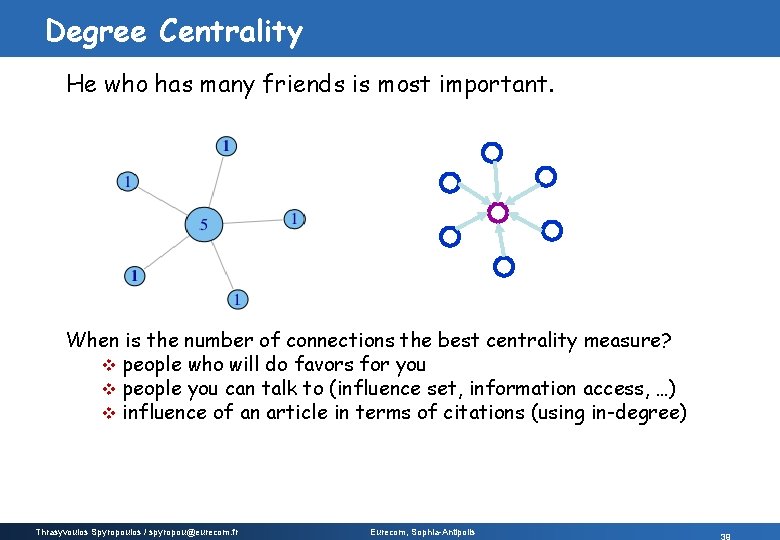
Degree Centrality He who has many friends is most important. When is the number of connections the best centrality measure? v people who will do favors for you v people you can talk to (influence set, information access, …) v influence of an article in terms of citations (using in-degree) Thrasyvoulos Spyropoulos / spyropou@eurecom. fr Eurecom, Sophia-Antipolis
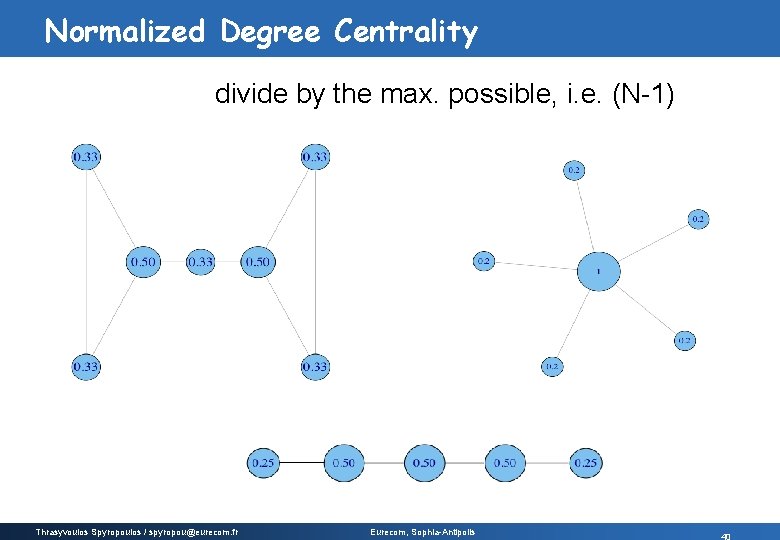
Normalized Degree Centrality divide by the max. possible, i. e. (N-1) Thrasyvoulos Spyropoulos / spyropou@eurecom. fr Eurecom, Sophia-Antipolis
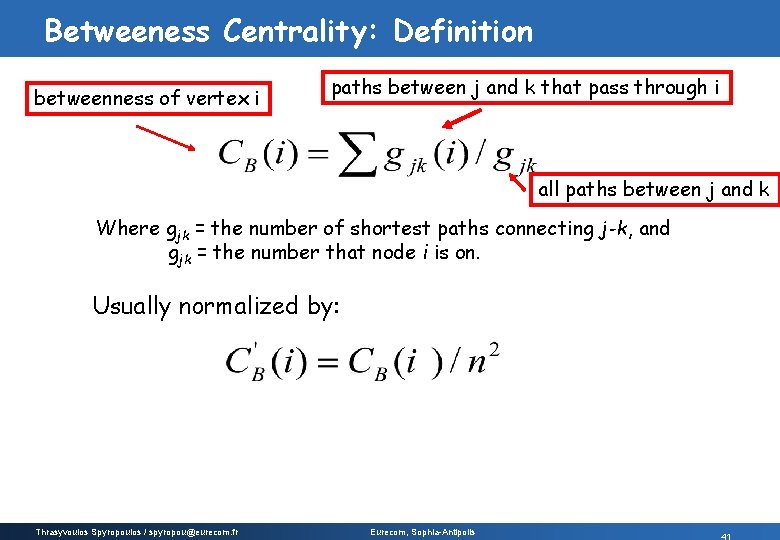
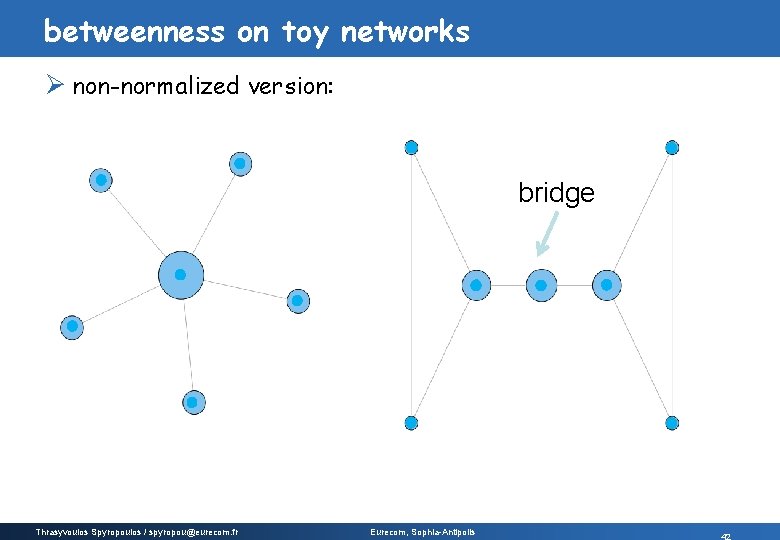
Betweeness Centrality: Definition betweenness of vertex i paths between j and k that pass through i all paths between j and k Where gjk = the number of shortest paths connecting j-k, and gjk = the number that node i is on. Usually normalized by: Thrasyvoulos Spyropoulos / spyropou@eurecom. fr Eurecom, Sophia-Antipolis
betweenness on toy networks Ø non-normalized version: bridge Thrasyvoulos Spyropoulos / spyropou@eurecom. fr Eurecom, Sophia-Antipolis
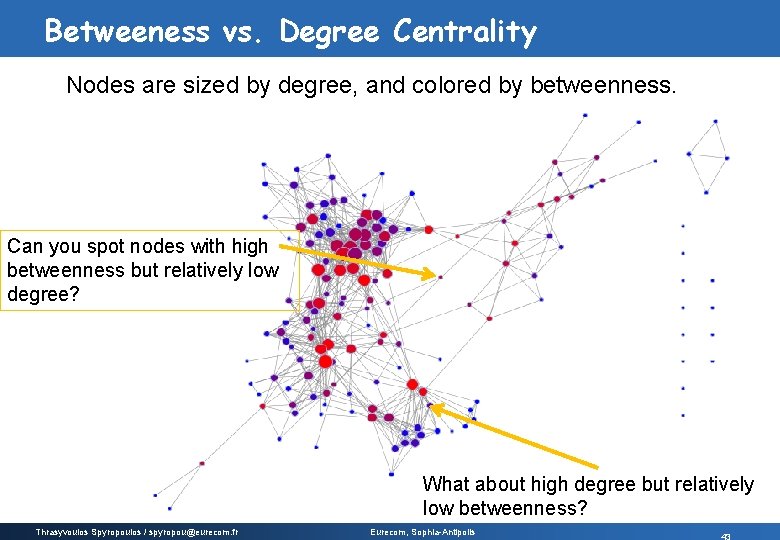
Betweeness vs. Degree Centrality Nodes are sized by degree, and colored by betweenness. Can you spot nodes with high betweenness but relatively low degree? What about high degree but relatively low betweenness? Thrasyvoulos Spyropoulos / spyropou@eurecom. fr Eurecom, Sophia-Antipolis
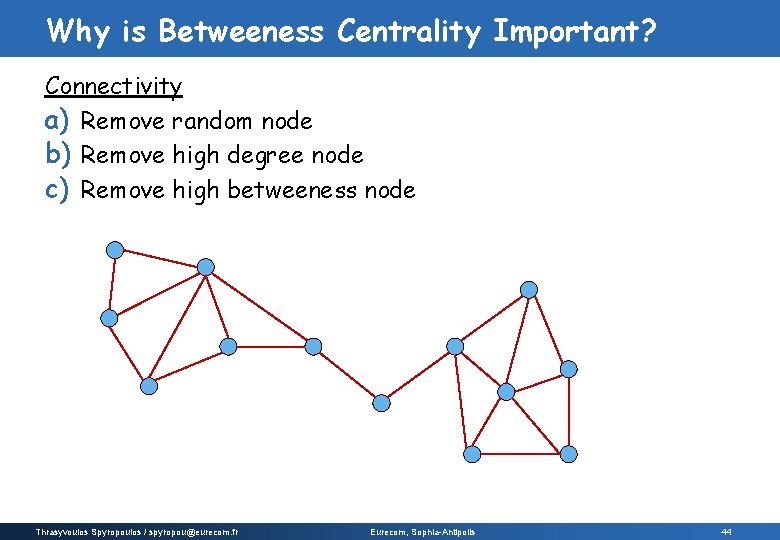
Why is Betweeness Centrality Important? Connectivity a) Remove random node b) Remove high degree node c) Remove high betweeness node Thrasyvoulos Spyropoulos / spyropou@eurecom. fr Eurecom, Sophia-Antipolis 44
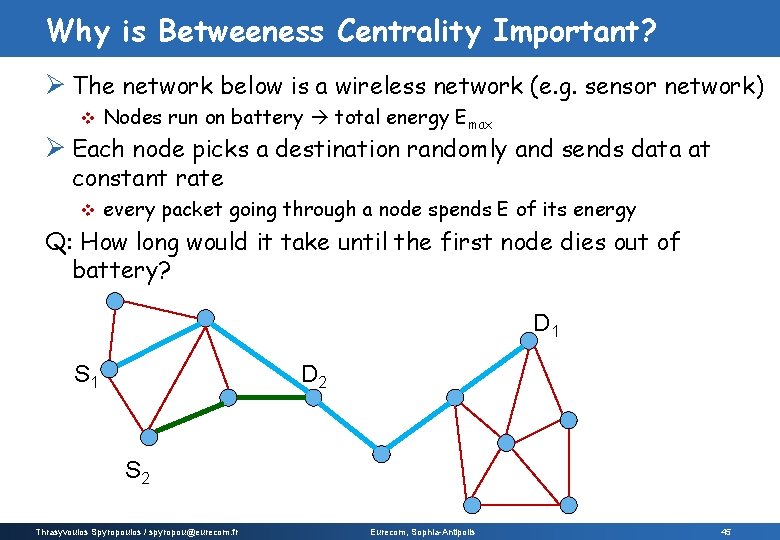
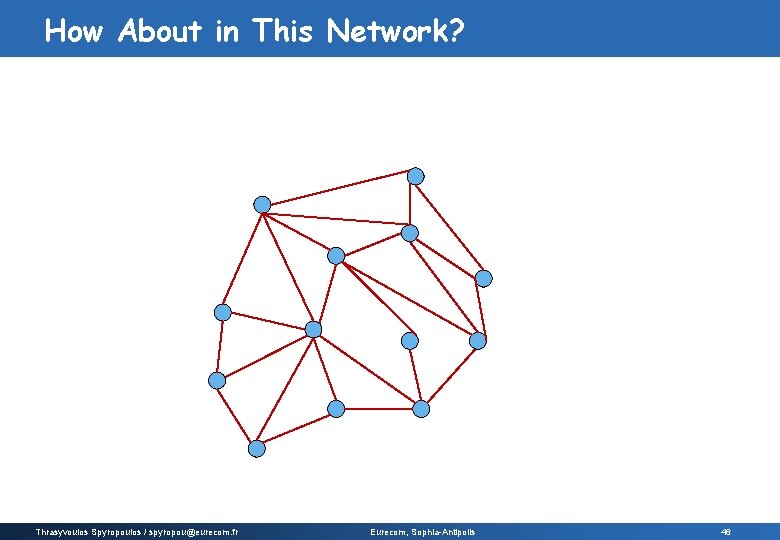
Why is Betweeness Centrality Important? Ø The network below is a wireless network (e. g. sensor network) v Nodes run on battery total energy Emax Ø Each node picks a destination randomly and sends data at constant rate v every packet going through a node spends E of its energy Q: How long would it take until the first node dies out of battery? D 1 S 1 D 2 S 2 Thrasyvoulos Spyropoulos / spyropou@eurecom. fr Eurecom, Sophia-Antipolis 45
How About in This Network? Thrasyvoulos Spyropoulos / spyropou@eurecom. fr Eurecom, Sophia-Antipolis 46
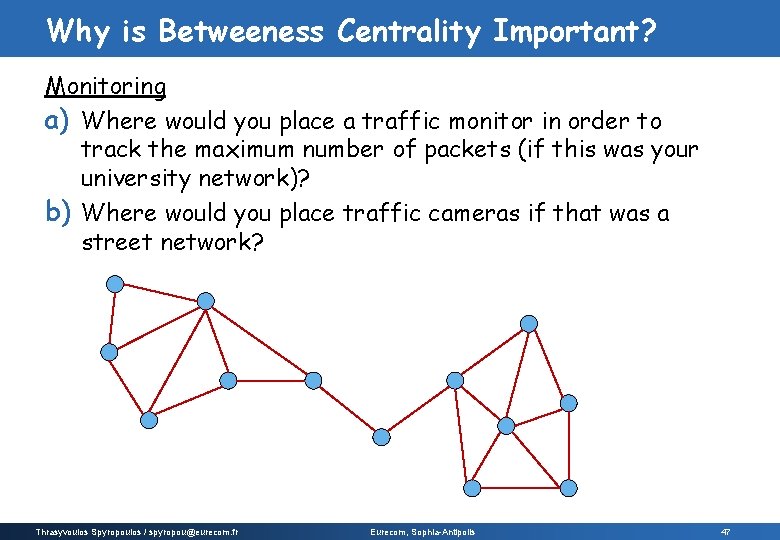
Why is Betweeness Centrality Important? Monitoring a) Where would you place a traffic monitor in order to track the maximum number of packets (if this was your university network)? b) Where would you place traffic cameras if that was a street network? Thrasyvoulos Spyropoulos / spyropou@eurecom. fr Eurecom, Sophia-Antipolis 47
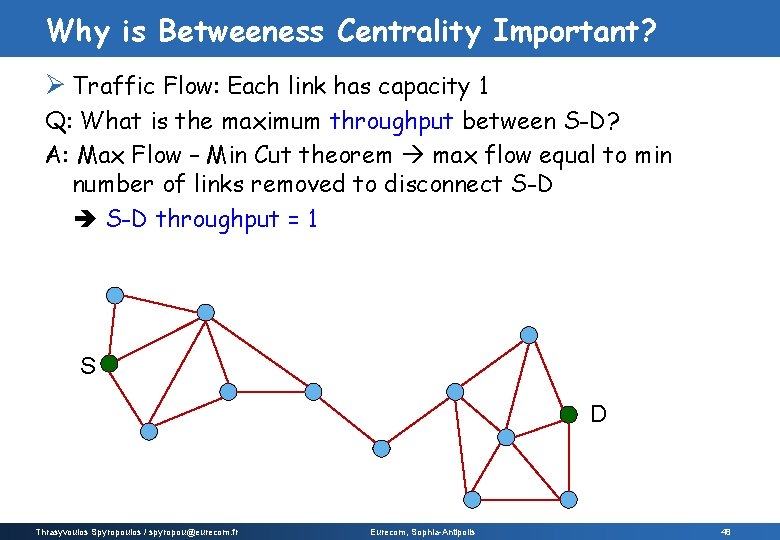
Why is Betweeness Centrality Important? Ø Traffic Flow: Each link has capacity 1 Q: What is the maximum throughput between S-D? A: Max Flow – Min Cut theorem max flow equal to min number of links removed to disconnect S-D throughput = 1 S D Thrasyvoulos Spyropoulos / spyropou@eurecom. fr Eurecom, Sophia-Antipolis 48