
Random Field Theory Will Penny SPM short course
- Slides: 39
Random Field Theory Will Penny SPM short course, London, May 2005
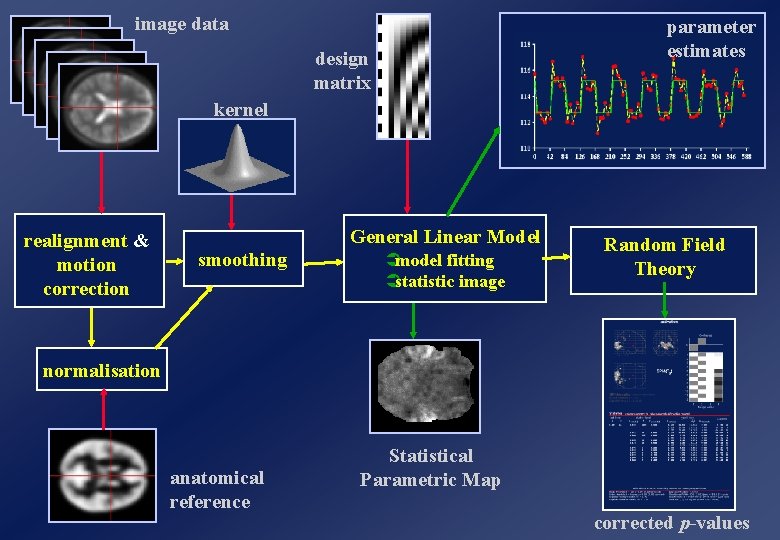
image data parameter estimates design matrix kernel realignment & motion correction General Linear Model smoothing model fitting statistic image Random Field Theory normalisation anatomical reference Statistical Parametric Map corrected p-values
Overview 1. Terminology 2. Random Field Theory 3. Imaging Data 4. Cluster level inference 5. SPM Results 6. FDR
Overview 1. Terminology 2. Random Field Theory 3. Imaging Data 4. Cluster level inference 5. SPM Results 6. FDR
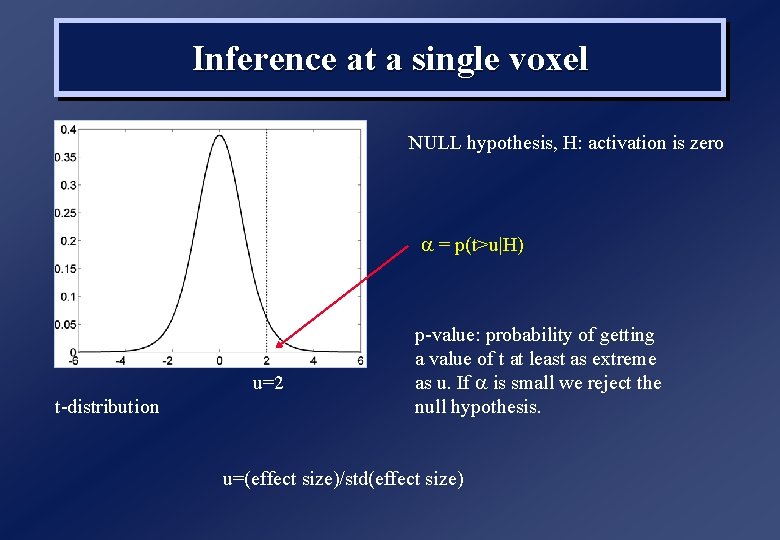
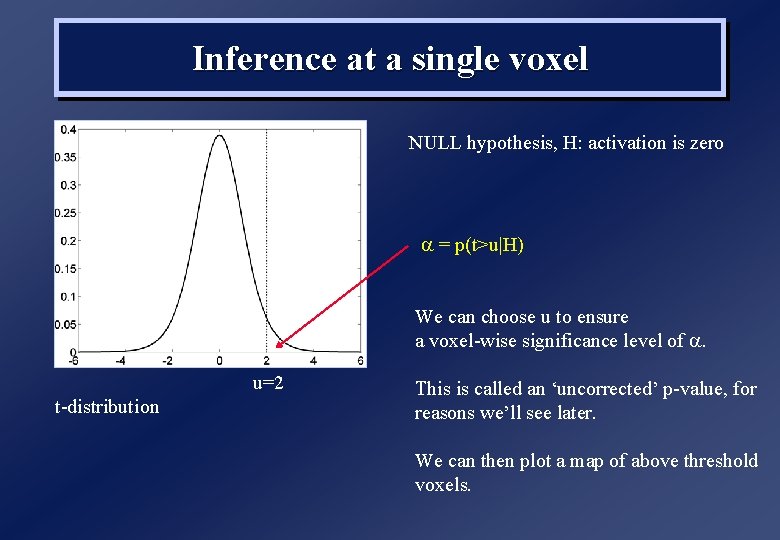
Inference at a single voxel NULL hypothesis, H: activation is zero a = p(t>u|H) u=2 t-distribution p-value: probability of getting a value of t at least as extreme as u. If a is small we reject the null hypothesis. u=(effect size)/std(effect size)
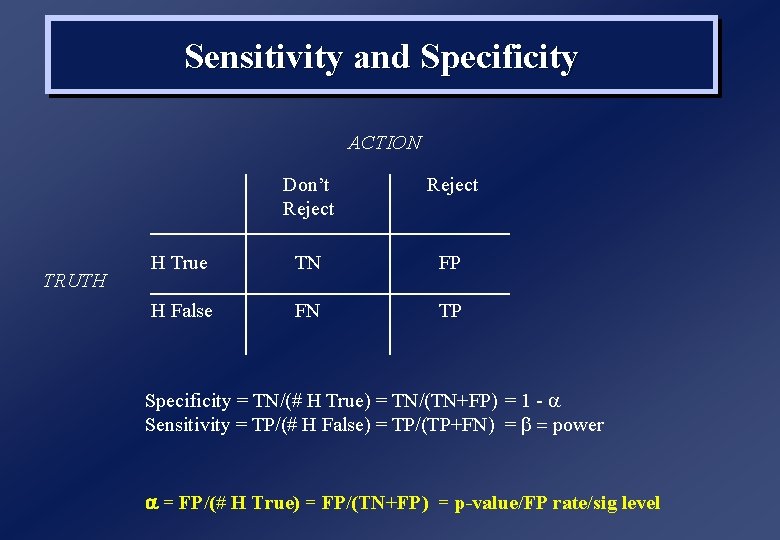
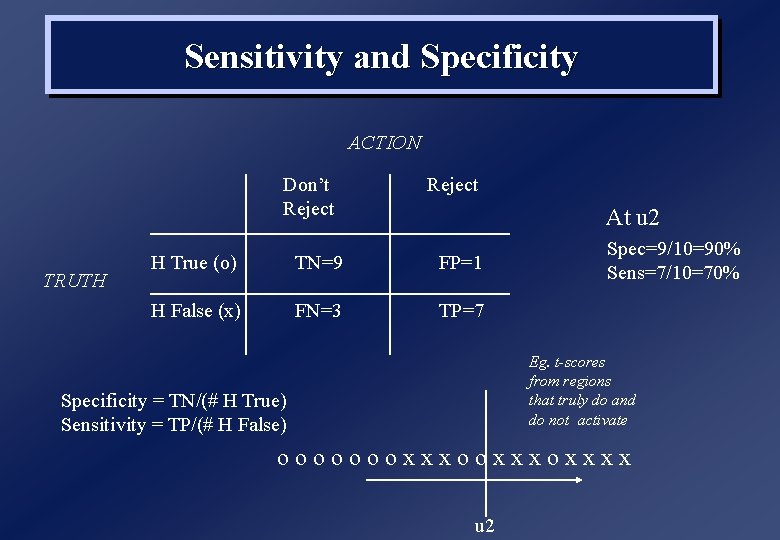
Sensitivity and Specificity ACTION TRUTH Don’t Reject H True TN FP H False FN TP Specificity = TN/(# H True) = TN/(TN+FP) = 1 - a Sensitivity = TP/(# H False) = TP/(TP+FN) = b = power a = FP/(# H True) = FP/(TN+FP) = p-value/FP rate/sig level
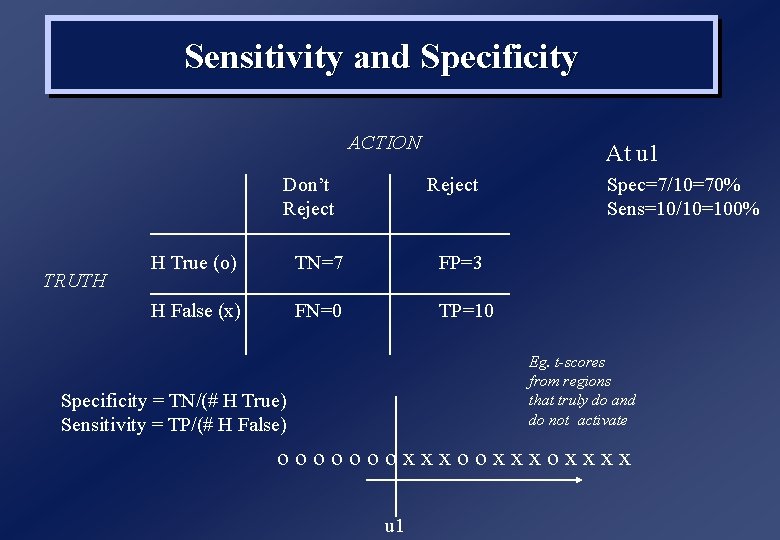
Sensitivity and Specificity ACTION Don’t Reject TRUTH At u 1 Reject H True (o) TN=7 FP=3 H False (x) FN=0 TP=10 Spec=7/10=70% Sens=10/10=100% Eg. t-scores from regions that truly do and do not activate Specificity = TN/(# H True) Sensitivity = TP/(# H False) oooooooxxxoxxxx u 1
Sensitivity and Specificity ACTION Don’t Reject TRUTH Reject At u 2 H True (o) TN=9 FP=1 H False (x) FN=3 TP=7 Spec=9/10=90% Sens=7/10=70% Eg. t-scores from regions that truly do and do not activate Specificity = TN/(# H True) Sensitivity = TP/(# H False) oooooooxxxoxxxx u 2
Inference at a single voxel NULL hypothesis, H: activation is zero a = p(t>u|H) We can choose u to ensure a voxel-wise significance level of a. u=2 t-distribution This is called an ‘uncorrected’ p-value, for reasons we’ll see later. We can then plot a map of above threshold voxels.
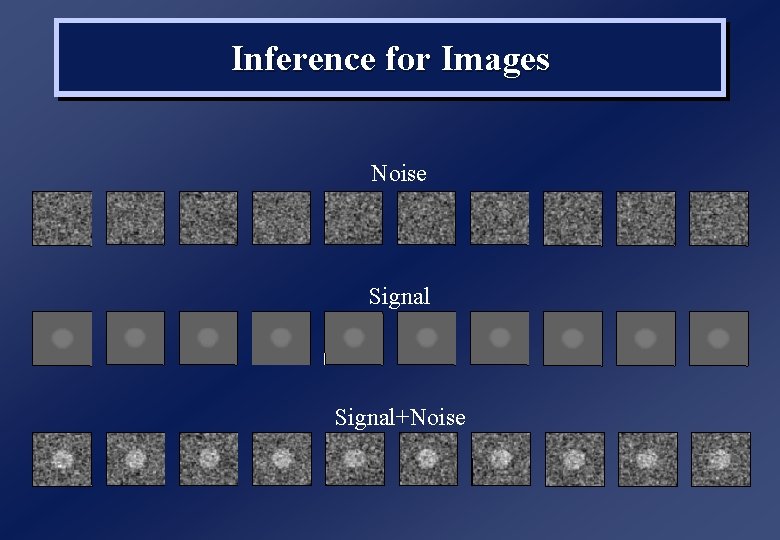
Inference for Images Noise Signal+Noise
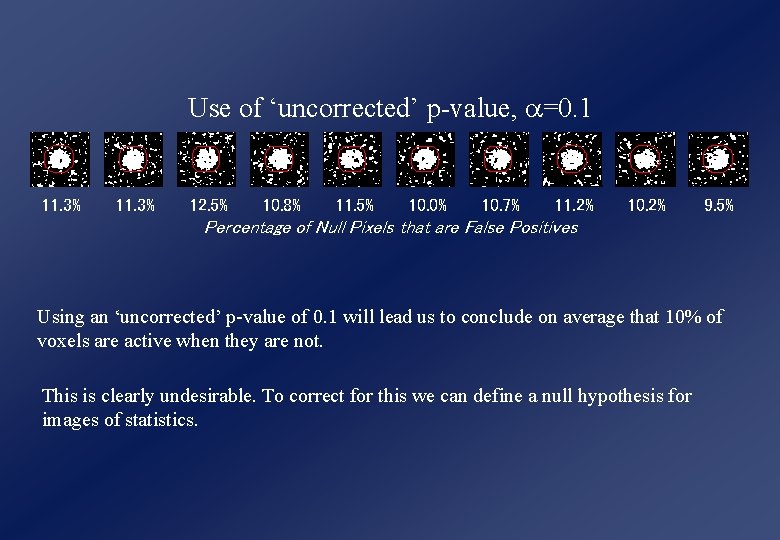
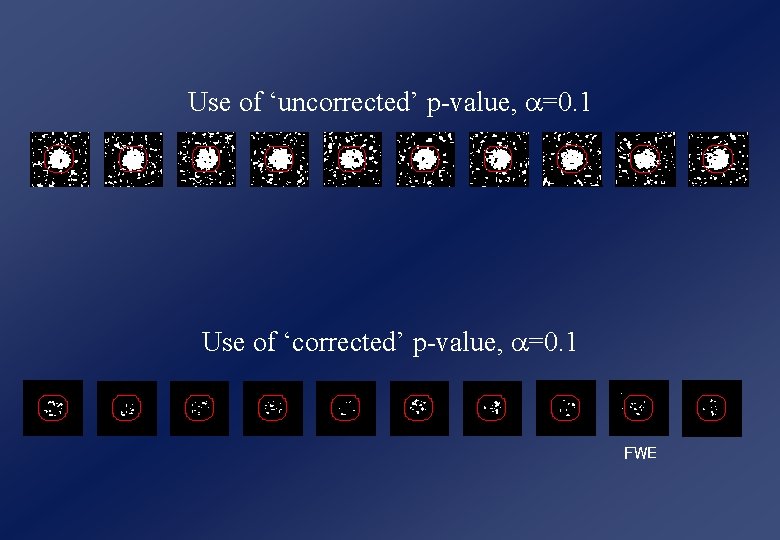
Use of ‘uncorrected’ p-value, a=0. 1 11. 3% 12. 5% 10. 8% 11. 5% 10. 0% 10. 7% 11. 2% 10. 2% 9. 5% Percentage of Null Pixels that are False Positives Using an ‘uncorrected’ p-value of 0. 1 will lead us to conclude on average that 10% of voxels are active when they are not. This is clearly undesirable. To correct for this we can define a null hypothesis for images of statistics.
Family-wise Null Hypothesis FAMILY-WISE NULL HYPOTHESIS: Activation is zero everywhere If we reject a voxel null hypothesis at any voxel, we reject the family-wise Null hypothesis A FP anywhere in the image gives a Family Wise Error (FWE) Family-Wise Error (FWE) rate = ‘corrected’ p-value
Use of ‘uncorrected’ p-value, a=0. 1 Use of ‘corrected’ p-value, a=0. 1 FWE
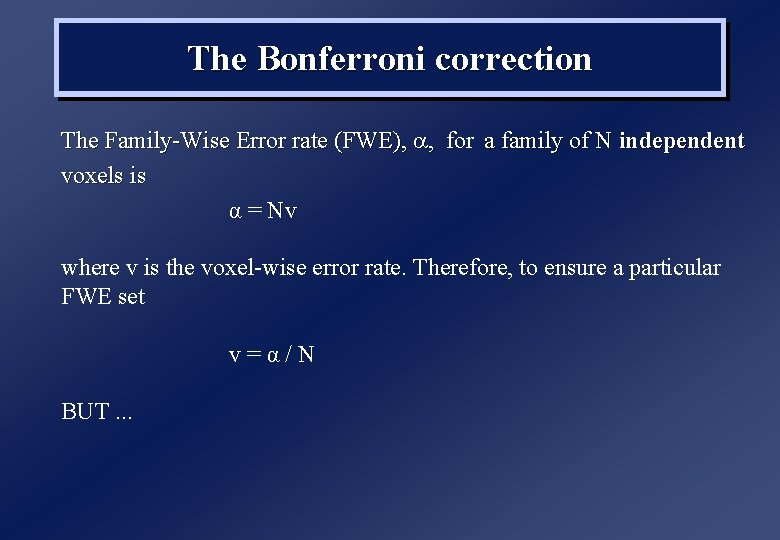
The Bonferroni correction The Family-Wise Error rate (FWE), a, for a family of N independent voxels is α = Nv where v is the voxel-wise error rate. Therefore, to ensure a particular FWE set v=α/N BUT. . .
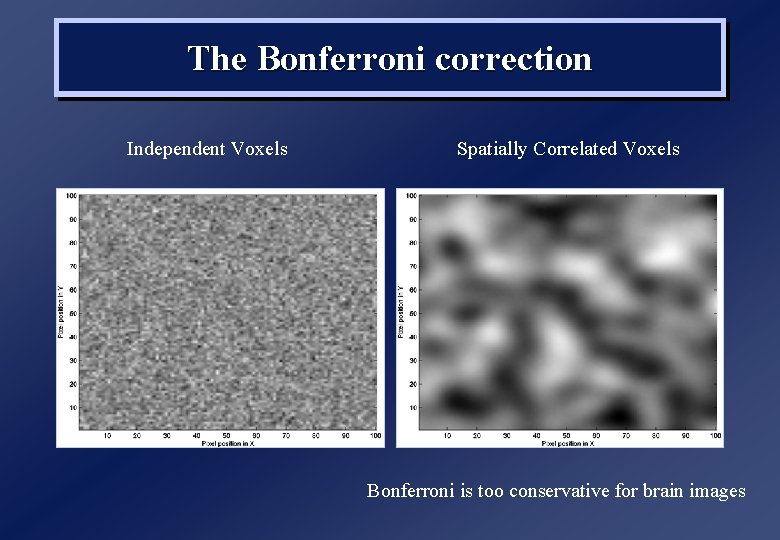
The Bonferroni correction Independent Voxels Spatially Correlated Voxels Bonferroni is too conservative for brain images
Overview 1. Terminology 2. Random Field Theory 3. Imaging Data 4. Cluster level inference 5. SPM Results 6. FDR
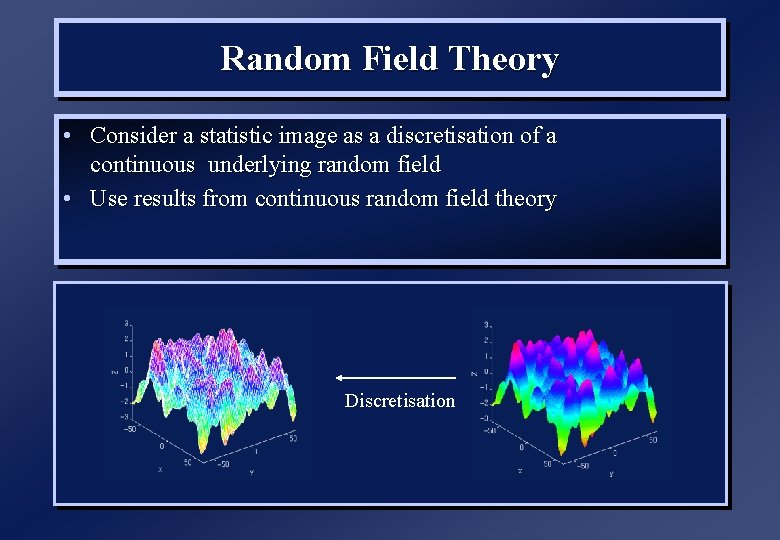
Random Field Theory • Consider a statistic image as a discretisation of a continuous underlying random field • Use results from continuous random field theory Discretisation
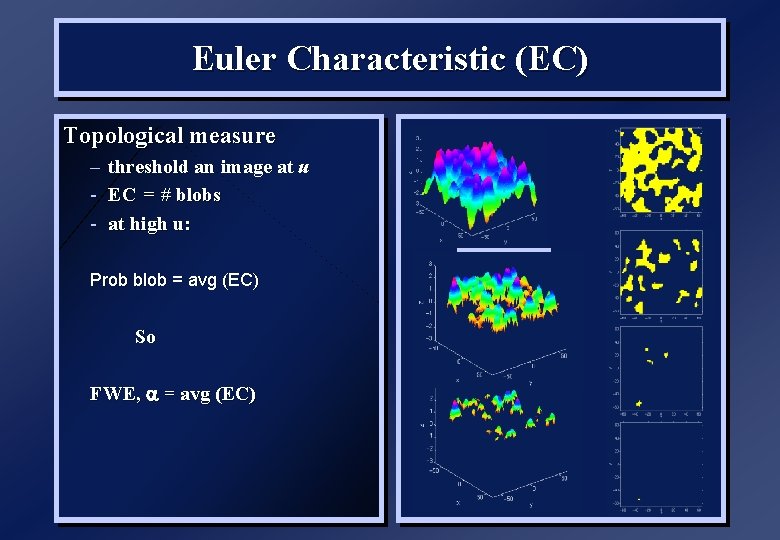
Euler Characteristic (EC) Topological measure – threshold an image at u - EC = # blobs - at high u: Prob blob = avg (EC) So FWE, a = avg (EC)
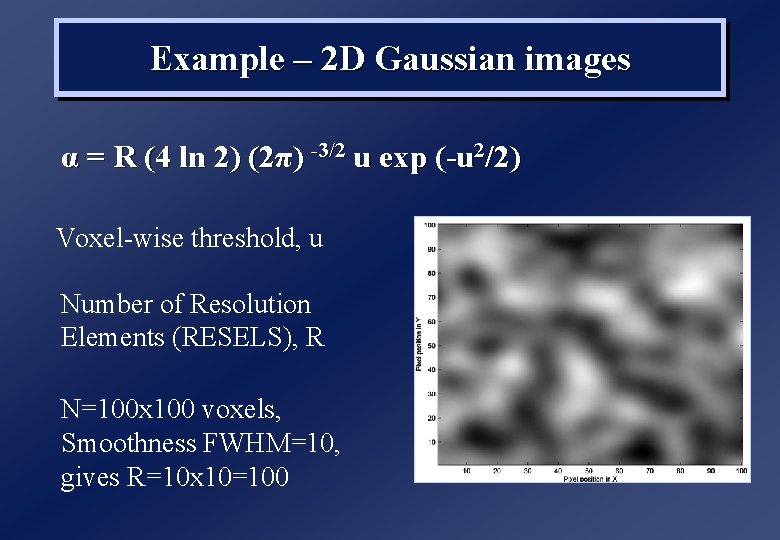
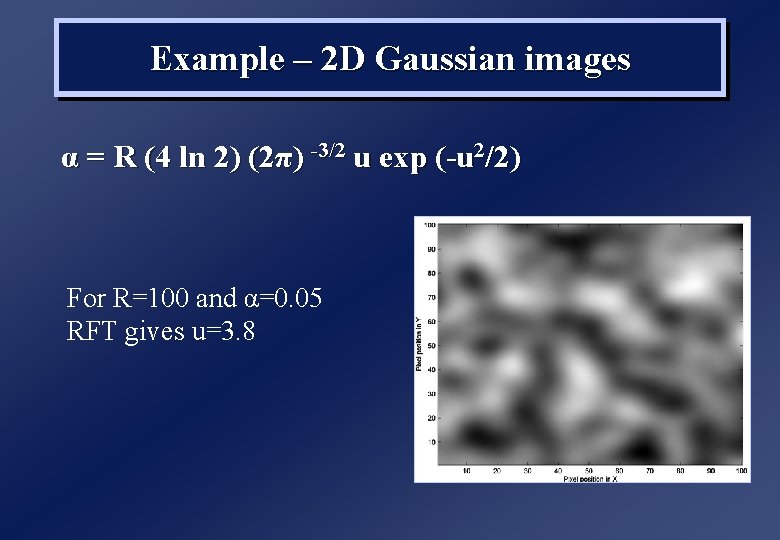
Example – 2 D Gaussian images α = R (4 ln 2) (2π) -3/2 u exp (-u 2/2) Voxel-wise threshold, u Number of Resolution Elements (RESELS), R N=100 x 100 voxels, Smoothness FWHM=10, gives R=10 x 10=100
Example – 2 D Gaussian images α = R (4 ln 2) (2π) -3/2 u exp (-u 2/2) For R=100 and α=0. 05 RFT gives u=3. 8
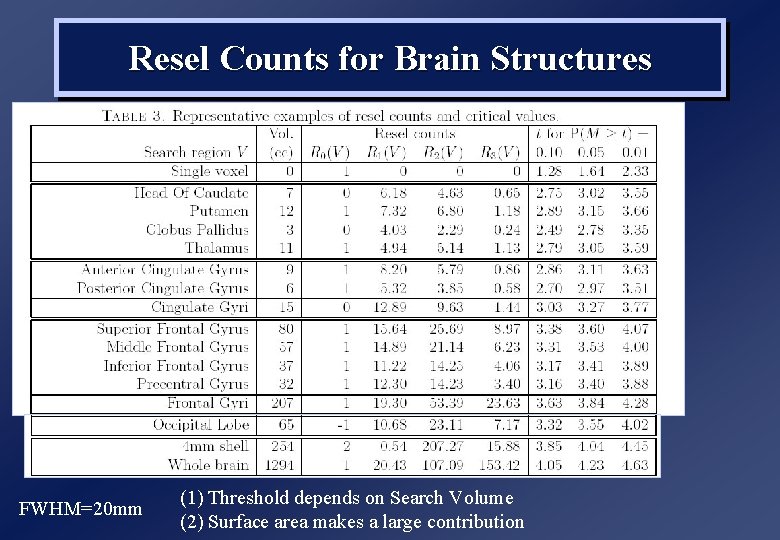
Resel Counts for Brain Structures FWHM=20 mm (1) Threshold depends on Search Volume (2) Surface area makes a large contribution
Overview 1. Terminology 2. Theory 3. Imaging Data 4. Levels of Inference 5. SPM Results
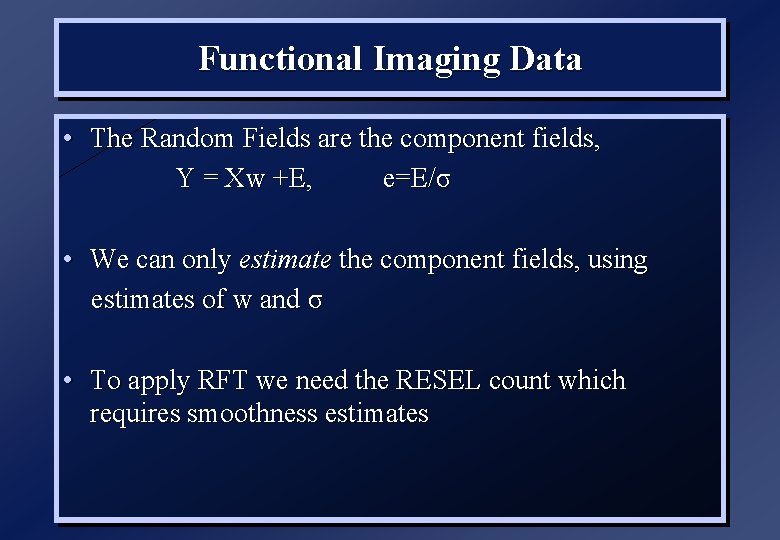
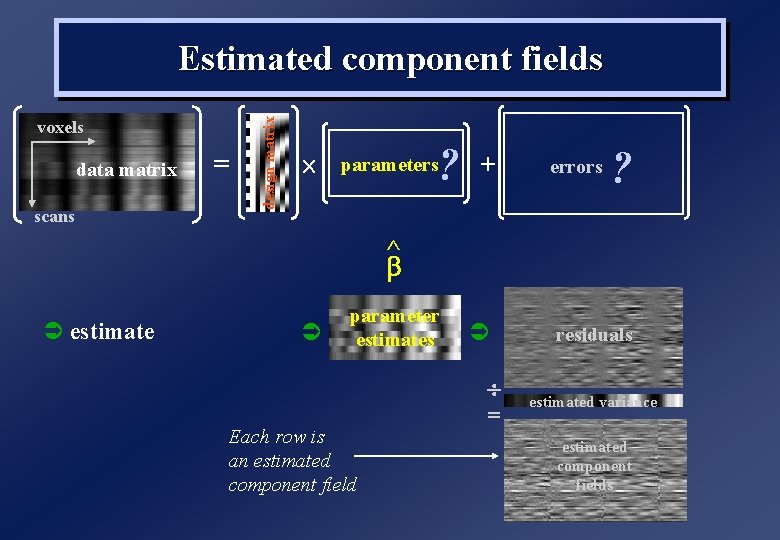
Functional Imaging Data • The Random Fields are the component fields, Y = Xw +E, e=E/σ • We can only estimate the component fields, using estimates of w and σ • To apply RFT we need the RESEL count which requires smoothness estimates
voxels data matrix scans = design matrix Estimated component fields ? parameters + errors ? ^ estimate parameter estimates Each row is an estimated component field = residuals estimated variance estimated component fields
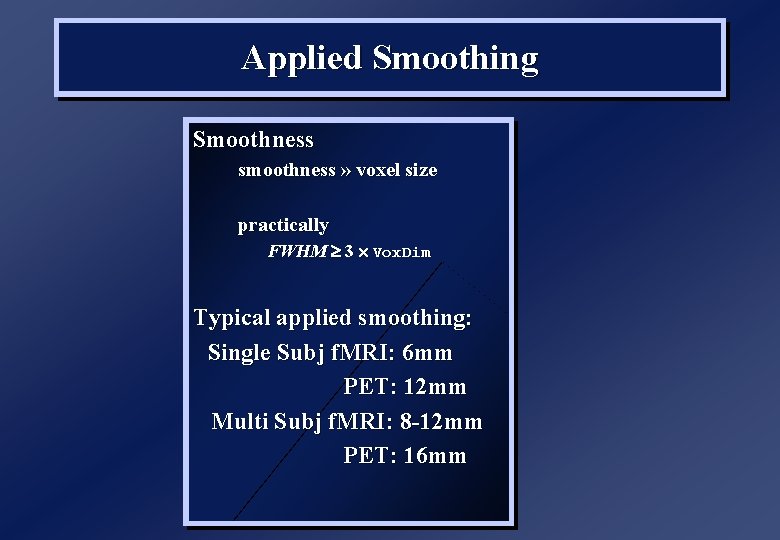
Applied Smoothing Smoothness smoothness » voxel size practically FWHM 3 Vox. Dim Typical applied smoothing: Single Subj f. MRI: 6 mm PET: 12 mm Multi Subj f. MRI: 8 -12 mm PET: 16 mm
Overview 1. Terminology 2. Theory 3. Imaging Data 4. Levels of Inference 5. SPM Results
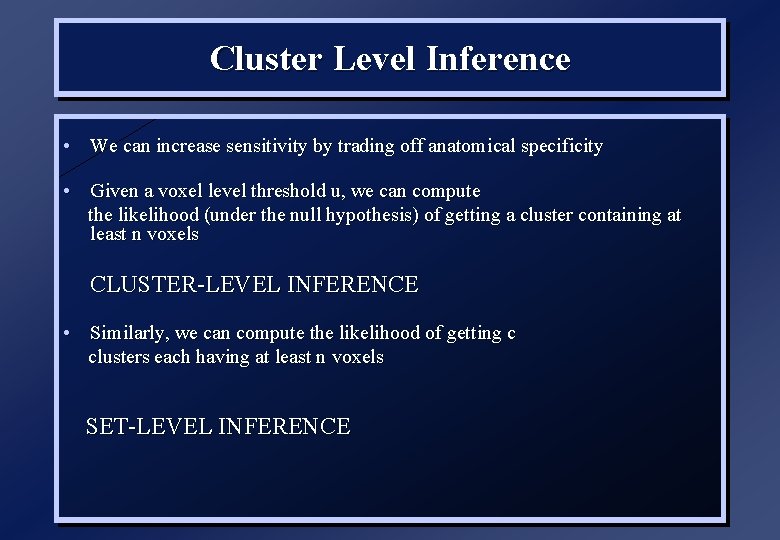
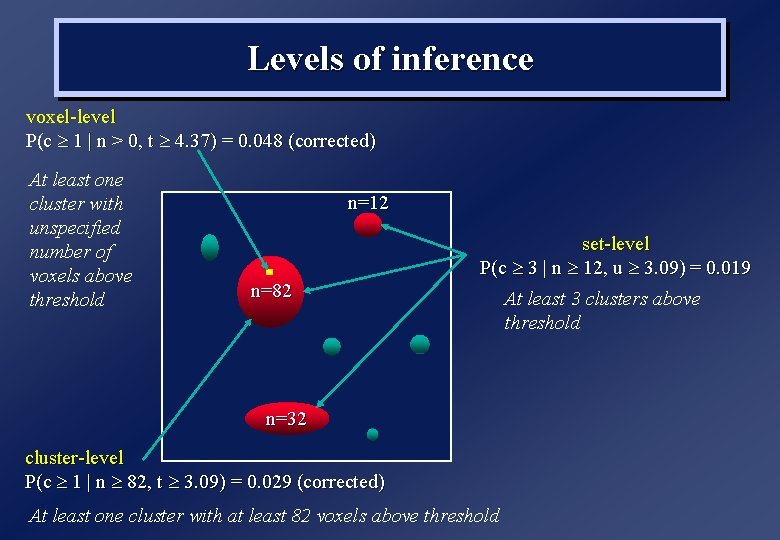
Cluster Level Inference • We can increase sensitivity by trading off anatomical specificity • Given a voxel level threshold u, we can compute the likelihood (under the null hypothesis) of getting a cluster containing at least n voxels CLUSTER-LEVEL INFERENCE • Similarly, we can compute the likelihood of getting c clusters each having at least n voxels SET-LEVEL INFERENCE
Levels of inference voxel-level P(c 1 | n > 0, t 4. 37) = 0. 048 (corrected) At least one cluster with unspecified number of voxels above threshold n=12 n=82 set-level P(c 3 | n 12, u 3. 09) = 0. 019 n=32 cluster-level P(c 1 | n 82, t 3. 09) = 0. 029 (corrected) At least one cluster with at least 82 voxels above threshold At least 3 clusters above threshold
Overview 1. Terminology 2. Theory 3. Imaging Data 4. Levels of Inference 5. SPM Results
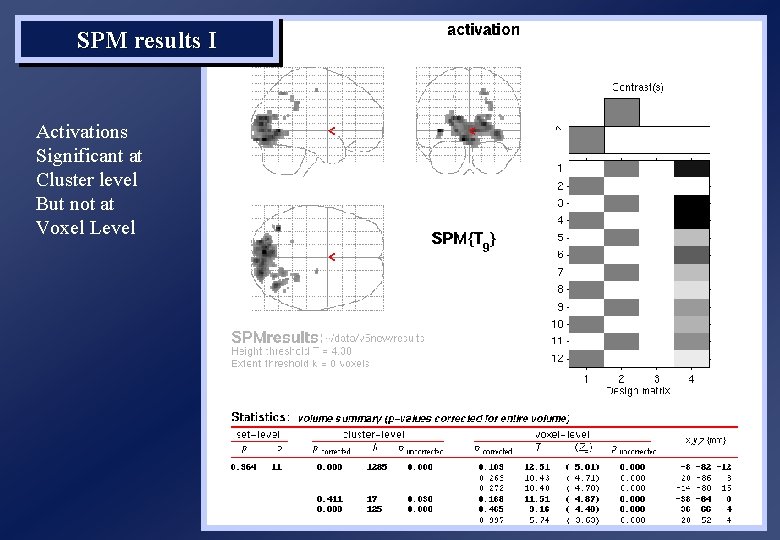
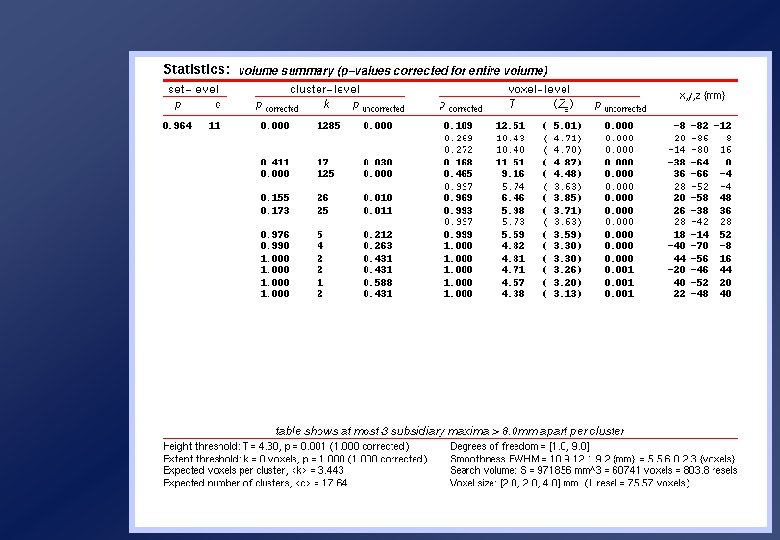
SPM results I Activations Significant at Cluster level But not at Voxel Level
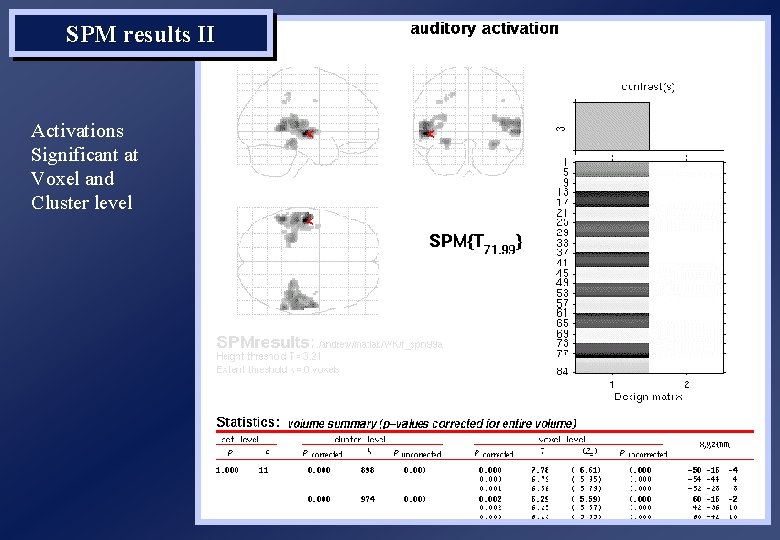
SPM results II Activations Significant at Voxel and Cluster level
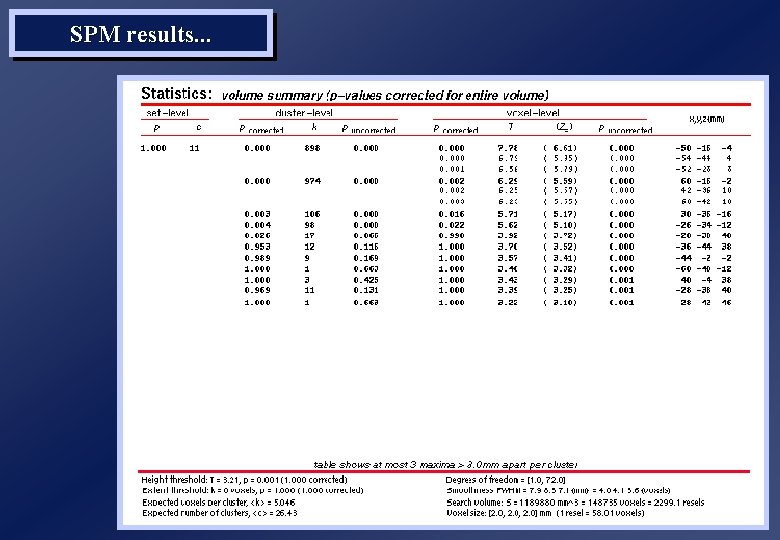
SPM results. . .
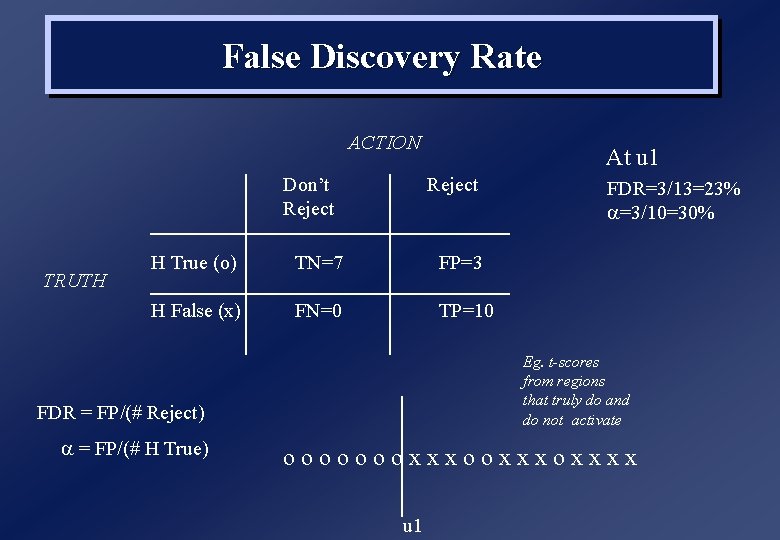
False Discovery Rate ACTION Don’t Reject TRUTH At u 1 Reject H True (o) TN=7 FP=3 H False (x) FN=0 TP=10 Eg. t-scores from regions that truly do and do not activate FDR = FP/(# Reject) a = FP/(# H True) FDR=3/13=23% a=3/10=30% oooooooxxxoxxxx u 1
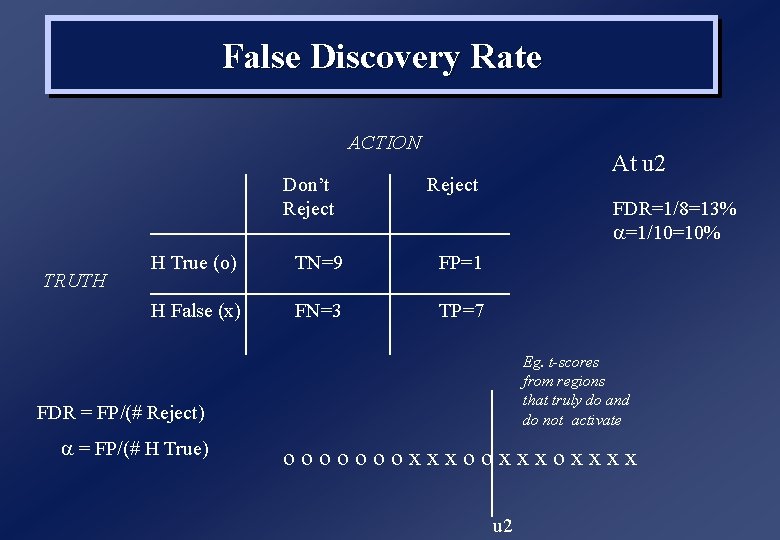
False Discovery Rate ACTION Don’t Reject TRUTH At u 2 Reject FDR=1/8=13% a=1/10=10% H True (o) TN=9 FP=1 H False (x) FN=3 TP=7 Eg. t-scores from regions that truly do and do not activate FDR = FP/(# Reject) a = FP/(# H True) oooooooxxxoxxxx u 2
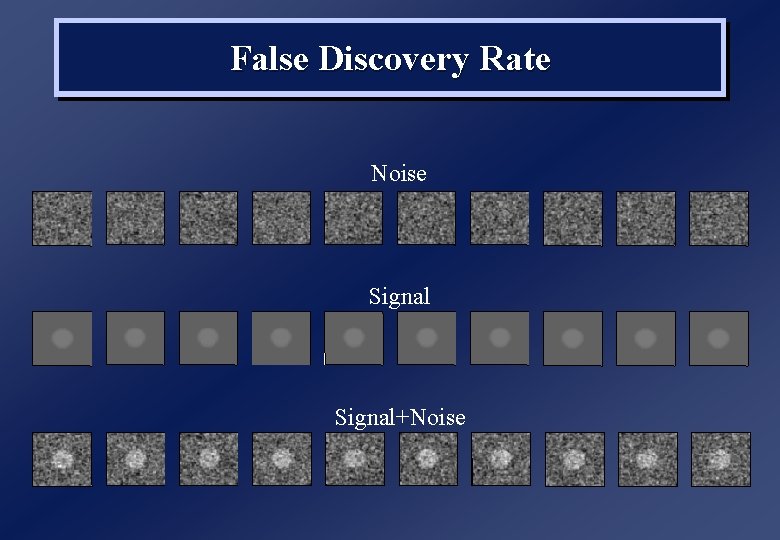
False Discovery Rate Noise Signal+Noise
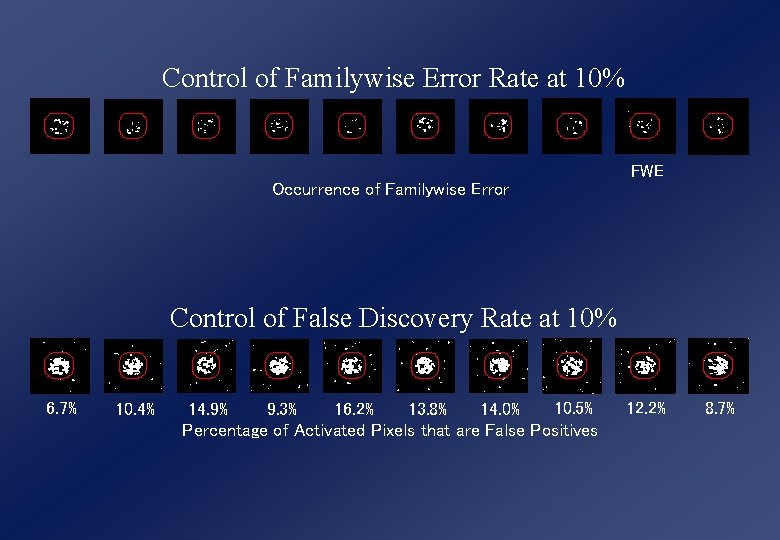
Control of Familywise Error Rate at 10% FWE Occurrence of Familywise Error Control of False Discovery Rate at 10% 6. 7% 10. 4% 10. 5% 14. 9% 9. 3% 16. 2% 13. 8% 14. 0% Percentage of Activated Pixels that are False Positives 12. 2% 8. 7%
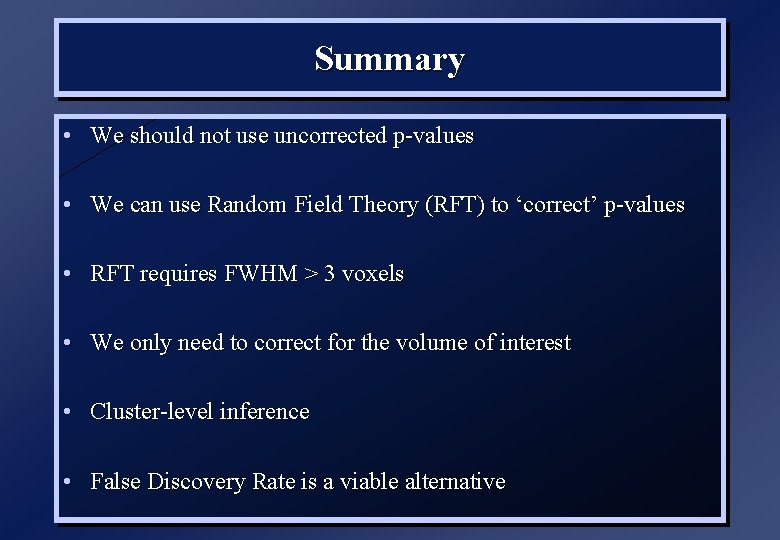
Summary • We should not use uncorrected p-values • We can use Random Field Theory (RFT) to ‘correct’ p-values • RFT requires FWHM > 3 voxels • We only need to correct for the volume of interest • Cluster-level inference • False Discovery Rate is a viable alternative