Raman Spectrum Principle and Application 18307110312 18307110178 8


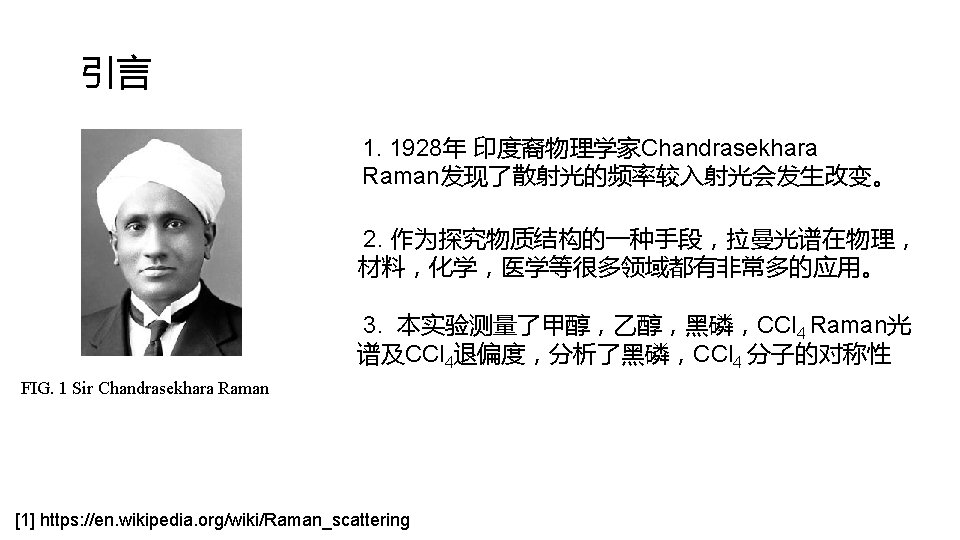

![实验装置 8 [1] http: //phylab. fudan. edu. cn/doku. php? id=exp: %E 6%8 B%89%E 6%9](https://slidetodoc.com/presentation_image_h2/6d7e89ed686162bf0c64053894e01f52/image-8.jpg "实验装置 8 [1] http: //phylab. fudan. edu. cn/doku. php? id=exp: %E 6%8 B%89%E 6%9")


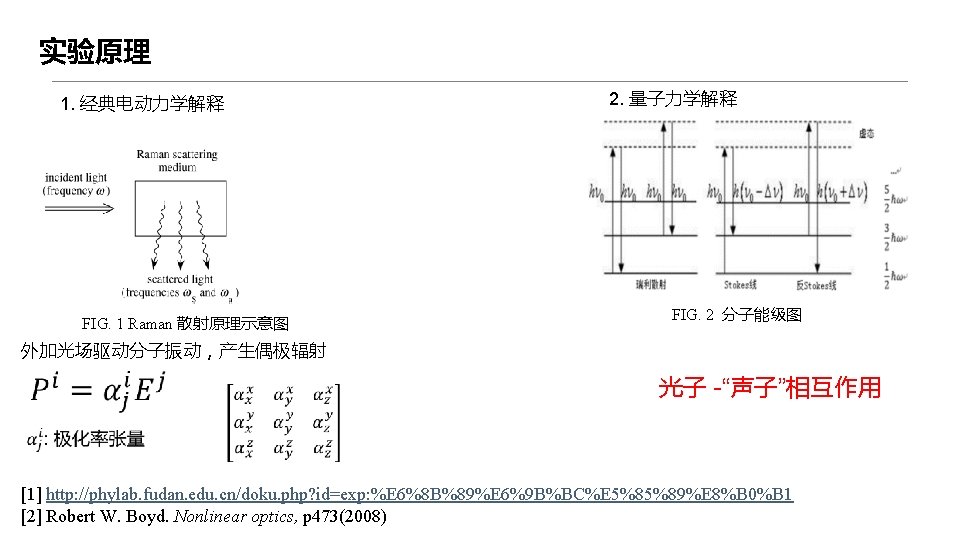
![Basic structure of BP Zigzag(ZZ) Monolayer Armchair(AC) Zigzag [1]Castellanos-Gomez A, Vicarelli L, Prada E,](https://slidetodoc.com/presentation_image_h2/6d7e89ed686162bf0c64053894e01f52/image-20.jpg "Basic structure of BP Zigzag(ZZ) Monolayer Armchair(AC) Zigzag [1]Castellanos-Gomez A, Vicarelli L, Prada E,")
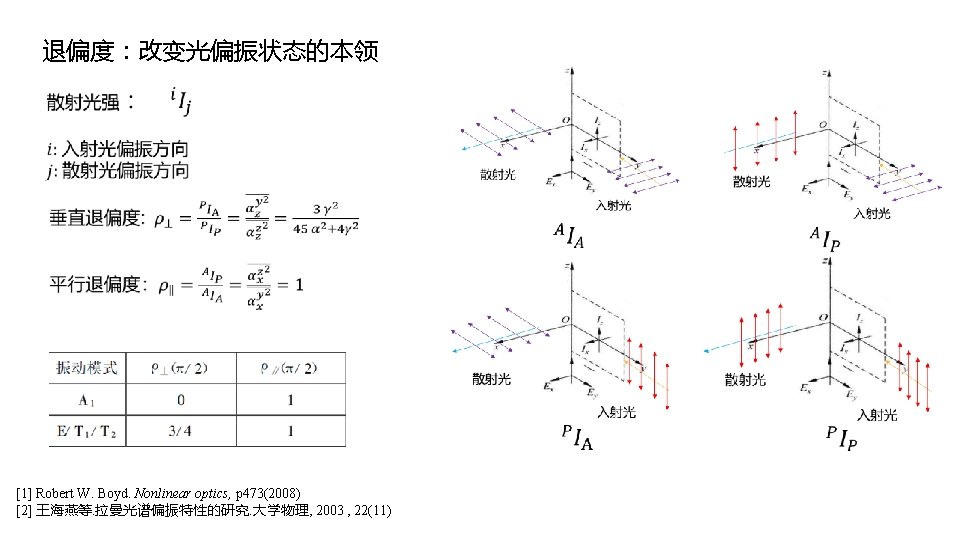
![Vibrational model of BP [1]Mao N, Zhang S, Wu J, et al. Lattice vibration](https://slidetodoc.com/presentation_image_h2/6d7e89ed686162bf0c64053894e01f52/image-21.jpg "Vibrational model of BP [1]Mao N, Zhang S, Wu J, et al. Lattice vibration")

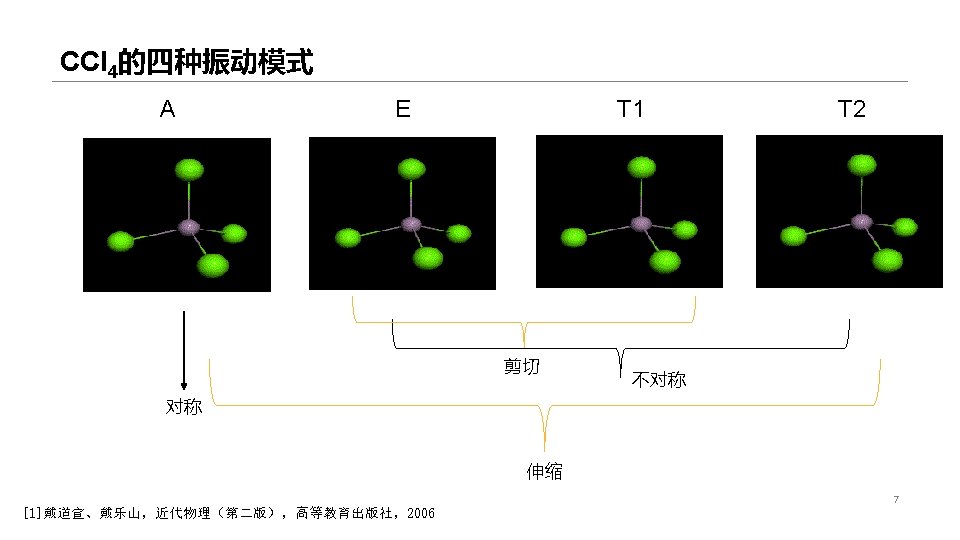
![Armchair direction [1]Mao N, Zhang S, Wu J, et al. Lattice vibration and raman](https://slidetodoc.com/presentation_image_h2/6d7e89ed686162bf0c64053894e01f52/image-23.jpg "Armchair direction [1]Mao N, Zhang S, Wu J, et al. Lattice vibration and raman")


- Slides: 31
Raman Spectrum ——Principle and Application 复旦大学物理学系 唐涵麟 18307110312 余博洋 18307110178
实验装置 8 [1] http: //phylab. fudan. edu. cn/doku. php? id=exp: %E 6%8 B%89%E 6%9 B%BC%E 5%85%89%E 8%B 0%B 1
CCl 4 Raman 光谱分析
Application of Raman scattering in Analyzing sample composition ----Using Methanol and Ethanol
Logic map To judge the ingredient of sample Find the characteris tic peaks of the ingredient Study the characteris tic peaks of target ingredient 15
Combined graph of Me. OH and Et. OH (We Minus the baseline and smooth the curve in order to optimize the result. ) Characteristic peaks • Methanol: 555. 8 nm, 632. 0 nm, 641. 0 nm • Ethanol: 562. 7 nm, 575. 3 nm, 16
Unknown sample We can see the corresponding Characteristic peaks---with both of Me. OH's and Et. OH's. Due to the limitation of signal to noise ratio, intensity analysis is unreliable, thus we cannot judge the percentage composition. 17
Application of Raman scattering in analyzing sample structure ----Using Black Phosphorus
Brief introduction to black phosphorus Heated 2 D material 1 • Interesting and superior properties in many fields Orthorhombic system 2 Highly tunable 3 • Properties varies form gating, doping, layer numbers and polarized light.
Basic structure of BP Zigzag(ZZ) Monolayer Armchair(AC) Zigzag [1]Castellanos-Gomez A, Vicarelli L, Prada E, et al. Isolation and characterization of few-layer black phosphorus[J]. 2 D Materials, 2014, 1(2): 025001. Armchair 20
Vibrational model of BP [1]Mao N, Zhang S, Wu J, et al. Lattice vibration and raman scattering in anisotropic black phosphorus crystals[J]. Small Methods, 2018, 2(6): 1700409. 21
Experimental data of few layers BP Rayleigh scattering • Peaks are sharp and strong • The base line is steady and plain • High signal to noise ratio Experimental equipment really matters 22
Armchair direction [1]Mao N, Zhang S, Wu J, et al. Lattice vibration and raman scattering in anisotropic black phosphorus crystals[J]. Small Methods, 2018, 2(6): 1700409. 23
465. 76 cm^-1 464. 85 cm^-1 • Due to the Limitations of experimental means, we cannot quantitatively measure the layer number. • The “few” layers may be not few enough, thus the red shift is not so obvious. 24
• Maximum value and minimum value appear in orthogonal direction ---- corresponding to AC and ZZ direction. • Thus we can find that, for our sample, the AC direction is 40° while the ZZ direction is 130°.
Brief summary We utilize the Raman scattering by the following methods··· ① Use characteristic peak analysis to judge sample composition. ② Observe The layer number dependence of Raman spectra of black phosphorus. ③ Figure out the direction within layer of BP. 26
Appendix: FIG. 1 Raman 散射示意图 Unti-stokes 线 瑞利散射成分 Stokes 线 Raman 散射成分 28
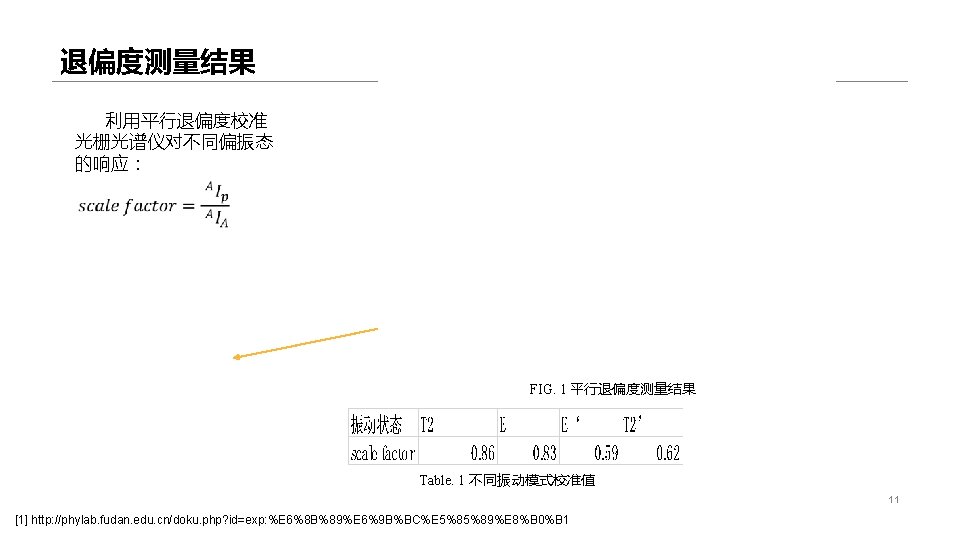
Appendix 2 振动模式 波长 A 1 524. 5 519. 4 519. 3 0. 02% T 2 528. 5 523. 4 523. 3 0. 02% A 1 0. 02 NA 0 2. 0% E 531. 2 526. 1 525. 9 0. 03% T 2 0. 88 0. 73 0. 75 2. 6% 瑞利峰 537. 1 532 E 0. 83 0. 71 0. 75 5. 3% E’ 543. 4 538. 3 538. 2 0. 02% E’ 1. 2 0. 73 0. 75 2. 5% T 2’ 1. 4 0. 78 0. 75 4. 4% T 2’ 546. 2 541. 1 541 0. 02% A 1’ 550. 6 545. 5 545. 3 0. 04% A 1' 0. 040 NA 0 4. 0% T 1’ 559. 73 555. 915 554. 9 0. 20% T 1’ www. islide. cc 瑞利峰修正 相对误差 理论值 振动模式 532 NA 修正前 修正后 理论值 相对误差 560. 7 29
Experiment methods Sample preparation 01 Use mechanics method to get few layer BP 02 Find proper sample under microscope 03 Transfer to quartz substrate 30
Experiment methods Raman scattering Use Laser Micro-Raman Spectrometer and Andor SR 550 i grating spectrometer. 01 Build laser optical path 02 Using visible light to find and focus on target sample under microscope 03 Switch to laser and launch the software 31