Raman Spectroscopy The first raman spectra C 6


 Basic Principals of Raman Spectroscopy: - light is scattered by the sample")


 Spectrometer")


 � Surface enhanced Raman spectroscopy involves obtaining Raman spectra in")


 Qualitative Information i. characteristic regions for different groups as in IR ii.")


- Slides: 37
Raman Spectroscopy The first raman spectra C 6 H 6 Scattering Dr. Saral K. Gupta Department of Physics Banasthali Vidyapith
Roadmap of raman spectroscopy � 1923 – Inelastic light scattering is predicted by A. Smekel � 1928 – Landsberg and Mandelstam see unexpected frequency shifts in scattering from quartz � 1928 – C. V. Raman and K. S. Krishnan see “feeble fluorescence” from neat solvents � 1930 – C. V. Raman wins Nobel Prize in Physics � 1961 – Invention of laser makes Raman experiments reasonable � 1977 – Surface-enhanced Raman scattering (SERS) is discovered � 1997 – Single molecule SERS is possible
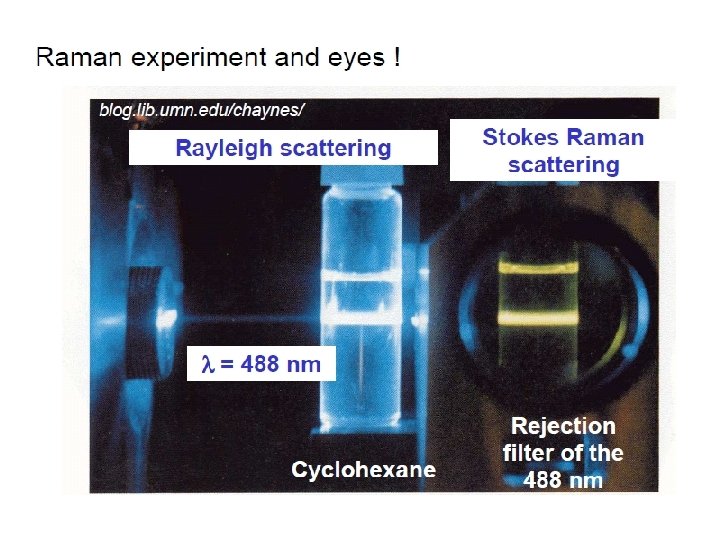
First Raman experiment
About the spectroscopy Introduction Raman spectroscopy: complementary to IR spectroscopy. - radiation at a certain frequency is scattered by the molecule with shifts in the wavelength of the incident beam. - observed frequency shifts are related to vibrational changes in the molecule associated with IR absorbance. - Raman Scattering Spectrum Resembles IR absorbance spectrum - Raman & IR mechanism differ
comparison of Raman & IR I. III. IV. IR Spectroscopy vibrational modes change in dipole excitation of molecule to excited vibrational state bond asymmetric vibrations (active) Raman Spectroscopy vibrational modes change in polarizability momentary distortion of the electrons distributed around the symmetric vibrations (active)
2. ) Basic Principals of Raman Spectroscopy: - light is scattered by the sample at various angles by momentary absorption to virtual state and reemission No change in electronic states energy absorbed by molecule from photon of light not quantized Infinite number of virtual states
v some scattered emissions occur at the same energy while others return in a different state Rayleigh Scattering no change in energy hnin = hnout Raman Scattering net change in energy hnin <> hnout Elastic: collision between photon and molecule results in no change in energy Inelastic: collision between photon and molecule results in a net change in energy
Two Types of Raman Scattering Anti-Stokes: E = hn + DE Stokes: E = hn - DE ±∆E – the energy of the first vibration level of the ground state – IR vibration absorbance Raman frequency shift and IR absorption peak frequency are identical
Contd. . Selection rule: Dv = ± 1 Overtones: Dv = ± 2, ± 3, … Must also have a change in polarizability Classical Description does not suggest any difference between Stokes and Anti-Stokes intensities
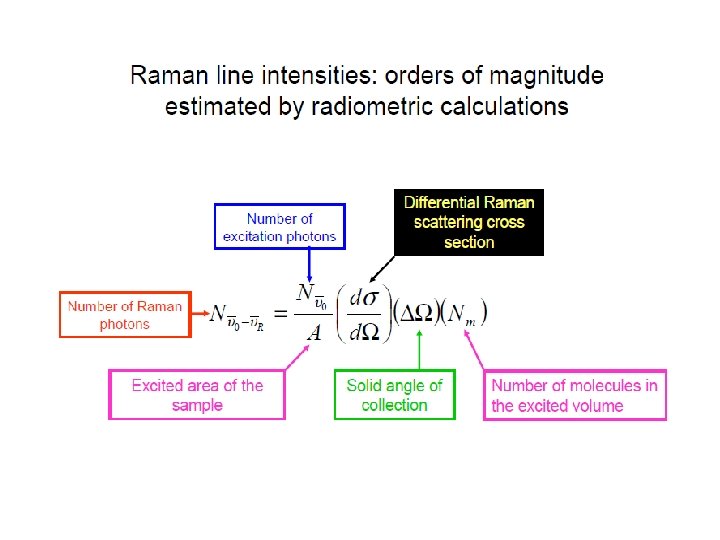
- Resulting Raman Spectrum Lower energy higher energy Probability of Emission Observed Intensity Raleigh scattering >> Stokes >> anti-Stokes difference in population of energy levels of vibrational transitions Intensity of Raman lines are 0. 001% intensity of the source
Instrumentation Basic design Light source: - generally a laser to get required intensity of light for reasonable S/N • Raman scattering is only 0. 001% of light source - Doesn’t have to be in IR region, since look at changes around central peak. • visible source used because of high intensity • allows use of glass/quartz sample cells & optics • UV/Vis type detectors (photomultiplier tubes)
Active Raman Vibrations: - need change in polarizability of molecule during vibration - polarizability related to electron cloud distribution example: O = C = O IR inactive Raman active O = C = O IR active Raman inactive IR & Raman are complimentary. Can be cases where vibration is both IR & Raman active (eg. SO 2 – non-linear molecule) In general IR tends to emphasize polar functional groups (R-OH, , etc. ) Raman emphasizes aromatic & carbon backbone (C=C, -CH 2 -, etc. ) - Raman does not “see” many common polar solvents can use with aqueous samples – advantage over IR Raman frequency range: 4000 -50 cm-1(Stokes and anti-stokes)
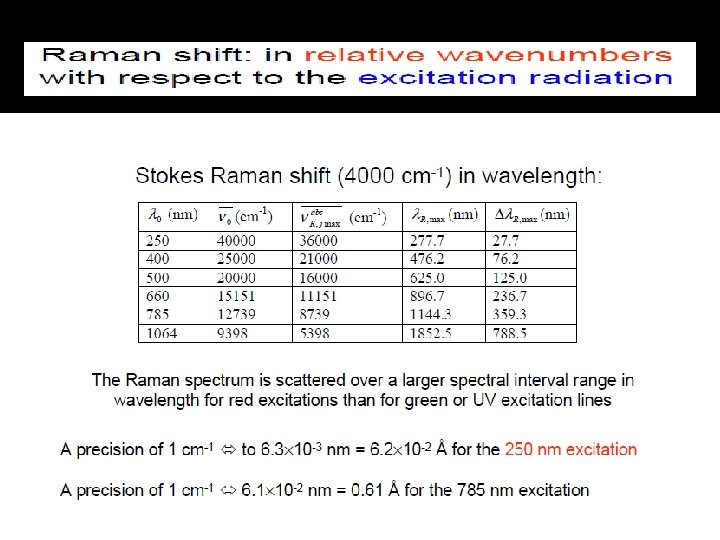
Presentation of Raman Spectra � lex = 1064 nm = 9399 cm-1 � Breathing mode: 9399 – 992 = 8407 cm-1 � Stretching mode: 9399 – 3063 = 6336 cm-1
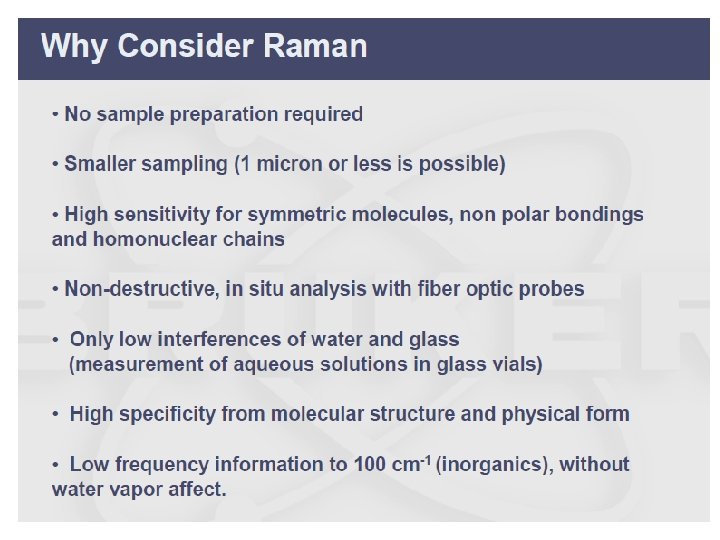
Advantages of Raman over IR v Water can be used as solvent. v Very suitable for biological samples in native state (because water can be used as solvent). v Although Raman spectra result from molecular vibrations at IR frequencies, spectrum is obtained using visible light or NIR radiation. v =>Glass and quartz lenses, cells, and optical fibers can be used. Standard detectors can be used. v Few intense overtones and combination bands => few spectral overlaps. v Totally symmetric vibrations are observable. v Raman intensities a to concentration and laser power.
The Different Elements Constitutive of Raman- (micro) Spectrometer
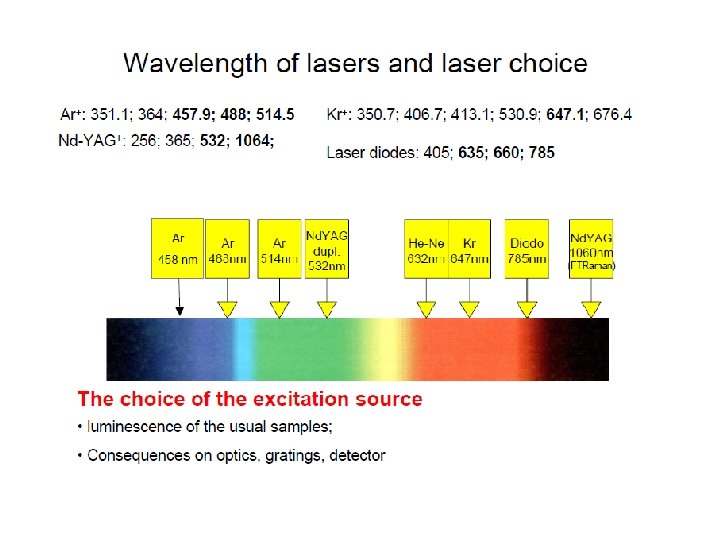
Excitation Sources
CCD Detectors charge-coupled devices � Most of the current dispersive Raman set-ups are now equipped with multichannel two-dimensional CCD detectors. The main advantages of these detectors are: Ø The high quantum efficiency. Ø The extremely low level of thermal noise (when effectively cooled). Ø Low read noise. Ø The large spectral range available. Many CCD chips exist, but one of the most common spectroscopy sensor formats is the 1024 x 256 pixel array.
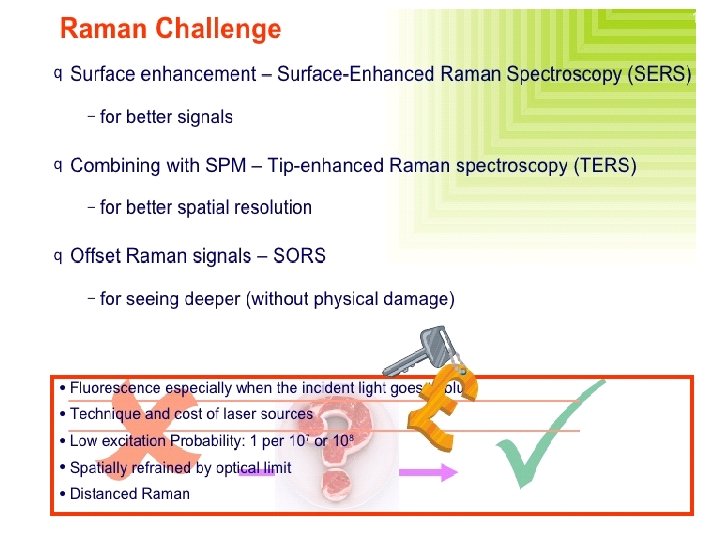
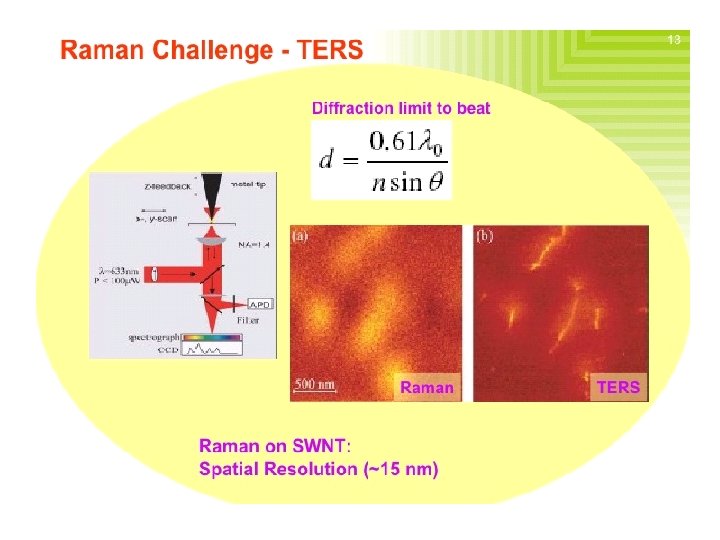
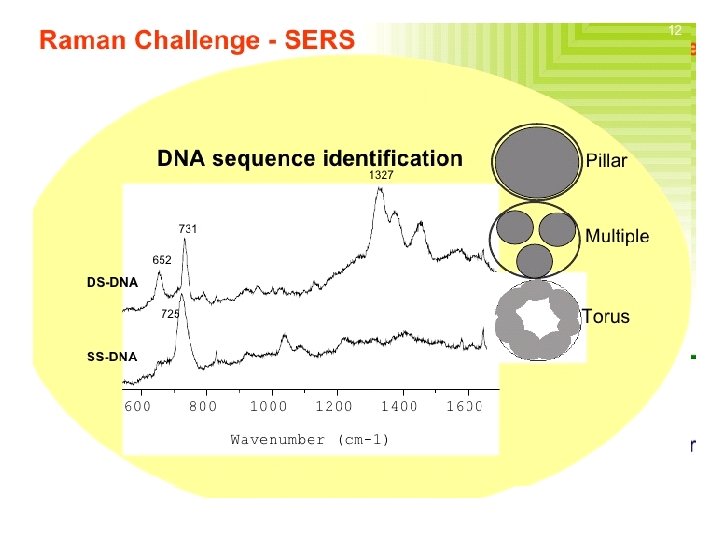
Surface-Enhanced Raman Spectroscopy (SERS) � Surface enhanced Raman spectroscopy involves obtaining Raman spectra in the usual way on samples that are adsorbed on the surface of colloidal metal particles (usually silver, gold, or copper) or on roughened surfaces of pieces of these metals. � For reasons that are not fully understood, the Raman lines of the adsorbed molecule are often enhanced by a factor of 103 to 106. � When surface enhancement is combined with the resonance enhancement technique discussed in the previous section, the net increase in signal intensity is roughly the product of the intensity produced by each of the techniques. Consequently, detection limits in the 10 -9 to 10 -12 M range have been observed.
Nature of SERS � Not extremely well understood. Electromagnetic interactions Chemical enhancement Arises from two effects: � Electromagnetic: Dominant Depends on the metal surfaces’ roughness features, which can be attained via small metal particles. The metal particles create an EM field (Plasmon) proximal to the analyze, enhancing its Raman signal. � Chemical: Electronic coupling with the metal surface, creating a higher Raman scattering cross-section via a variety of pathways (charge-transfer intermediates, interactions with free electrons, etc. ).
SERS versus Raman Spectroscopy
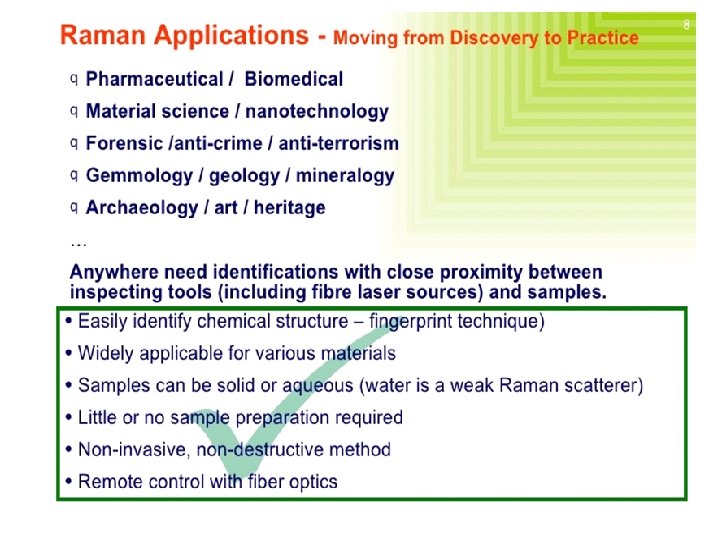
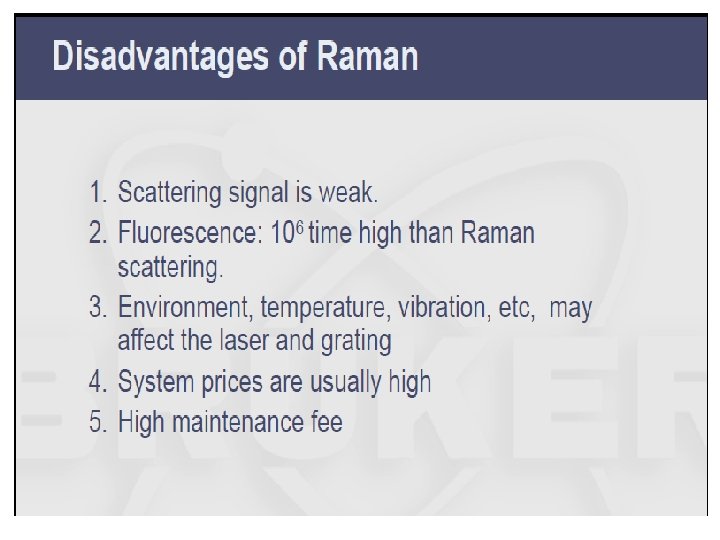
Applications: a) Qualitative Information i. characteristic regions for different groups as in IR ii. Raman correlation charts available iii. Good for aqueous based samples iv. Useful for a variety of samples, organic, inorganic & biological b) Quantitative Information – not routinely used i. fewer technical problems than IR, fewer peaks ii. Interference from fluorescence iii. Higher cost iii. Signal weak – require modified Raman methods 1) Resonance Raman spectroscopy allows detection of 10 -3 ->10 -7 M by using lasers light with wavelength approaching electronic absorption 2) Surface enhanced Raman spectroscopy places samples on metal or rough surfaces that increase Raman scattering.
Raman Microscope Imaging In pharmaceutics
Raman in Drug Detection
In Geology and minerology