Raman Spectroscopy Analytical Chemistry Lab Department of Chemistry

Raman Spectroscopy Analytical Chemistry Lab, Department of Chemistry, Yonsei University

Raman scattering or the Raman effect is the inelastic scattering of a photon. Discovered by Sir Chandrasekhara Venkata Raman and Kariamanickam Srinivasa Krishnan in liquids Raman received the Nobel Prize in 1930


Raman Spectroscopy 1923 – Inelastic light scattering is predicted by A. Smekel 1928 – Landsberg and Mandelstam see unexpected frequency shifts in scattering from quartz 1928 – C. V. Raman and K. S. Krishnan see “feeble fluorescence” from neat solvents First Raman Spectra: Filtered Hg arc lamp spectrum: C 6 H 6 Scattering http: //www. springerlink. com/content/u 4 d 7 aexmjm 8 pa 1 fv/fulltext. pdf

Raman Spectroscopy 1923 – Inelastic light scattering is predicted by A. Smekel 1928 – Landsberg and Mandelstam see unexpected frequency shifts in scattering from quartz 1928 – C. V. Raman and K. S. Krishnan see “feeble fluorescence” from neat solvents 1930 – C. V. Raman wins Nobel Prize in Physics 1961 – Invention of laser makes Raman experiments reasonable 1977 – Surface-enhanced Raman scattering (SERS) is discovered 1997 – Single molecule SERS is possible


Raman Spectroscopy The Raman spectroscopy effect arises when a beam of intense monochromatic light passes through a sample that contains molecules that can undergo a change on molecular polarization as they vibrate.
 • Random direction of emission •")
Rayleigh Scattering • Elastic ( does not change) • Random direction of emission • Little energy loss Eugene Hecht, Optics, Addison-Wesley, Reading, MA, 1998.

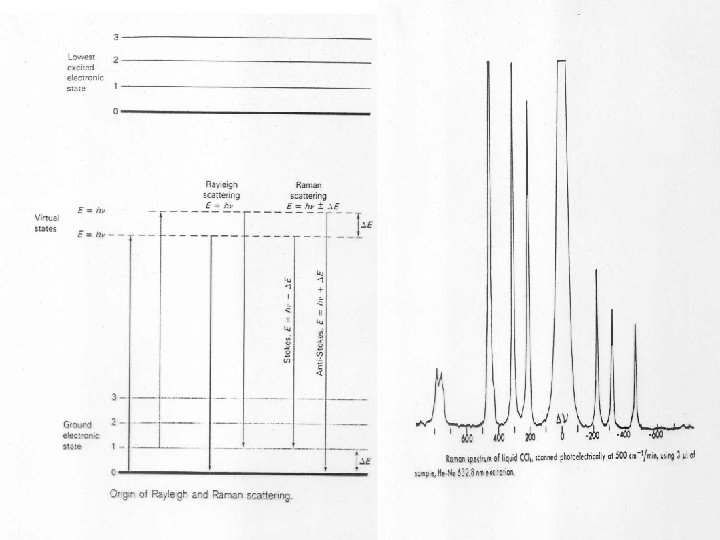
Raman Spectroscopy 1 in 107 photons is scattered inelastically Scattered Excitation virtual state Rotational Raman Vibrational Raman Electronic Raman v” = 1 v” = 0 Infrared Raman (absorption) (scattering)

Presentation of Raman Spectra ex = 1064 nm = 9399 cm-1 Breathing mode: 9399 – 992 = 8407 cm-1 Stretching mode: 9399 – 3063 = 6336 cm-1

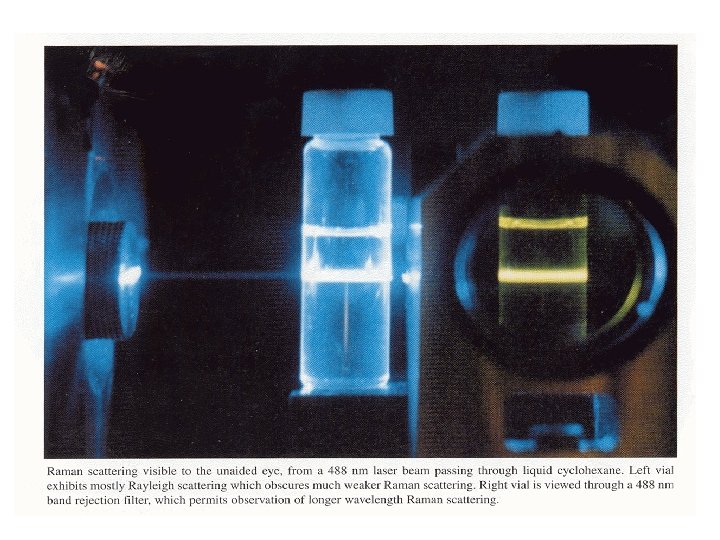
• Spectral peaks in normal Raman spectrometry are commonly 10 -5 to 10 -7 times weaker than the incident radiation • Some Raman lines are closely adjacent to the exciting wavelength • Raman peaks must be observed against a background of stray light originated from Rayleigh scattering. • Often Raman peaks must be separated from the fluorescence of analytes or sample impurities
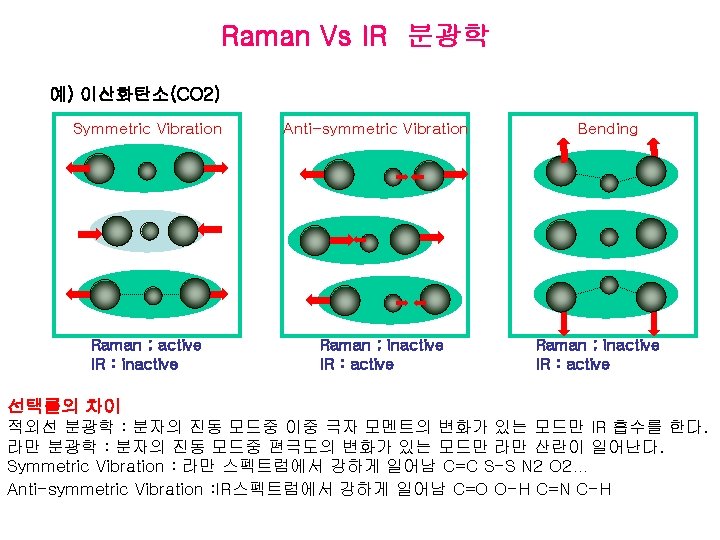

Raman active Raman inactive

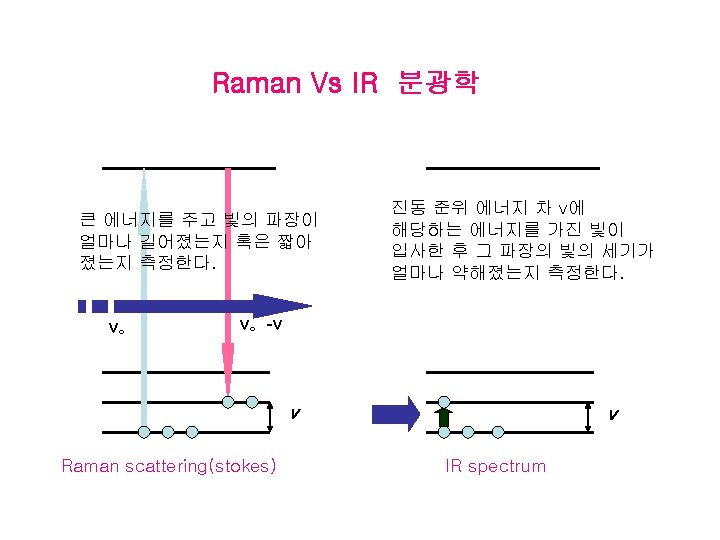
Raman vs IR Spectra Ingle and Crouch, Spectrochemical Analysis

Raman vs Infrared Spectra Mc. Creery, R. L. , Raman Spectroscopy for Chemical Analysis, 3 rd ed. , Wiley, New York: 2000

Raman vs Infrared Spectra Mc. Creery, R. L. , Raman Spectroscopy for Chemical Analysis, 3 rd ed. , Wiley, New York: 2000
 – Raman scattering cross-section (cm 2)")
Raman Intensities Radiant power of Raman scattering: s(nex) – Raman scattering cross-section (cm 2) nex – excitation frequency E 0 – incident beam irradiance ni – number density in state i exponential – Boltzmann factor for state i s(nex) - target area presented by a molecule for scattering
 Raman spectroscopy can be used to detect")
Comparison of Raman with Infrared Spectroscopy 1) Raman spectroscopy can be used to detect and analyze molecules with inactive spectra 2) Raman can be use to study materials in aqueous solution 3) Ability to examine the entire vibrational spectrum with one instrument 4) Spectrum is relatively simple and possible to assign all of Raman bands 5) Sample preparation for Raman is generally simpler 6) Intensity of spontaneous Raman lines increase linearly with concentration

Advantages of IR over Raman • Simpler and cheaper instrumentation. • Less instrument dependent than Raman spectra because IR spectra are based on measurement of intensity ratio. • Lower detection limit than (normal) Raman. • Background fluorescence can overwhelm Raman. • More suitable for vibrations of bonds with very low polarizability (e. g. C–F).

Shortcomings of Raman • Sample must be free from dust particle • Fluorescence background • Photo and heat make sample degradation and/or unwanted side reaction • Relatively high cost and experts needed
 It is important to appreciate that the magnitude of Raman shift")
Resonance Raman 1) It is important to appreciate that the magnitude of Raman shift are independent of the wavelength of excitation 2) The resonance Raman results from the promotion of an electron into an excited vibrational state, accompanied by immediate relaxation into a vibrational level of the ground state 3) Raman line intensities are greatly enhanced (10 2 ~10 6 times) by excitation w/ l that is close to labs of a molecule

Resonance Raman Spectra ex = 441. 6 nm ex = 514. 5 nm http: //www. photobiology. com/v 1/udaltsov. htm

Spectra from Background Subtraction Mc. Creery, R. L. , Raman Spectroscopy for Chemical Analysis, 3 rd ed. , Wiley, New York: 2000

Fluorescence Background in Raman Scattering Mc. Creery, R. L. , Raman Spectroscopy for Chemical Analysis, 3 rd ed. , Wiley, New York: 2000


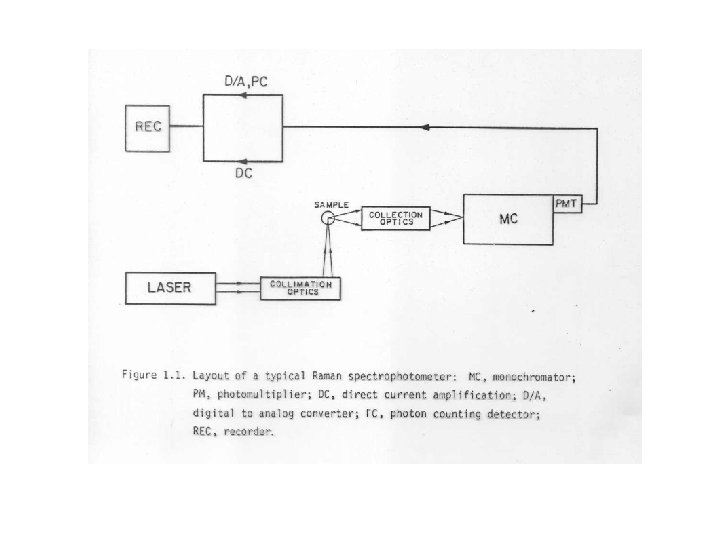
Basic components of the Raman • • • A source, usually a CW gas laser A sample illuminating system A sample holder A double or triple monochromator A signal processing system-including a PMT and amplification system, an output device

Advantages of laser • High intensity • Highly monochromatic • Small beam diameter * no dispersion * can apply to microsample • Polarization: 100 % linearity • Excitation frequency can be varied

* Liquid sample

Rotating Raman Cells Rubinson, K. A. , Rubinson, J. F. , Contemporary Instrumental Analysis, Prentice Hall, New Jersey: 2000

Solid Sample

Raman Spectroscopy: PMT vs CCD Mc. Creery, R. L. , Raman Spectroscopy for Chemical Analysis, 3 rd ed. , Wiley, New York: 2000

Dispersive and FT -Raman Spectrometry Mc. Creery, R. L. , Raman Spectroscopy for Chemical Analysis, 3 rd ed. , Wiley, New York: 2000

Overall review 1. 2. 3. Raman spectra give information on molecular vibrations and are obtained from changes in the frequency of light observed in a scattering experiment ( inelastic scattering) The gross selection rule: The physical picture arises from considering changes in polarization (induced dipole moment) that arise if a vibration occurs during the time the electrons are oscillating in response to the applied radiation Camparision of the spectra polarized perpendicular and pararell to the incident light gives information on the symmetry of the vibrational motions

4. Raman spectra can be obtained in water. This is a major advantage over IR 5. Resonance Raman spectra result when the wavelength of the exciting light falls within an electronic absorption band of a chromophore in the molecule. Some vibrations associated with such a chromophore may be enhanced by factors of 1000 or more 6. The experimental parameters of a band in a spectrum are its position (Dn) (which is independent of the frequency of the exciting light), its intensity (which is directly propotional to concentration), and its polarization
- Slides: 42