Rainfall Temperature Scenarios for Sri Lanka under the

")


 Climatology n ANUSPLIN Software – developed by Australian National University")

 n n Southwest Monsoon (SWM) n n May")
 average Rainfall in Northeast Monsoon (NEM) Baseline (1961 -1990) average Rainfall")
 average Rainfall in First Inter Monsoon (FIM) Baseline (1961 -1990) average")


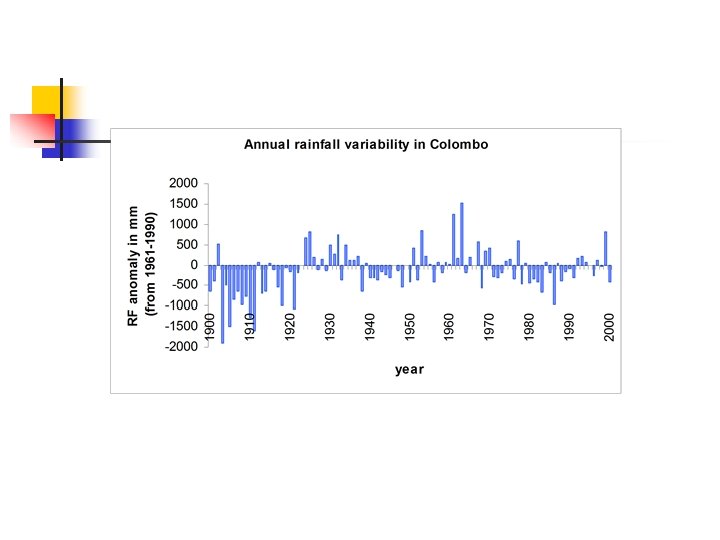


 1981 – 1990 1991 - 2000 Colombo")
- Slides: 41
Rainfall & Temperature Scenarios for Sri Lanka under the anticipated Climate Change B. R. S. B. Basnayake 1, Janaka Ratnasiri 2, J. C. Vithanage 2 1 Centre for Climate Change Studies, Department of Meteorology 2 Sri Lanka Association for the Advancement of Sciences AIACC Project - AS – 12 Sri Lanka
Outline. . n n n n Objectives Downscaling of GCM Baseline (1961 – 1990) climatology Observed Climate Change in Sri Lanka Temperature change Scenarios under the A 1 FI, A 2 & B 1 Scenarios with Had. CM 3, CGCM & CSIRO Rainfall change Scenarios under the A 2 Scenario with Had. CM 3 Conclusion
Objectives… Projection of Rainfall & Temperature Scenarios, which are applicable to Sri Lanka based on General Circulation Model (GCM) results
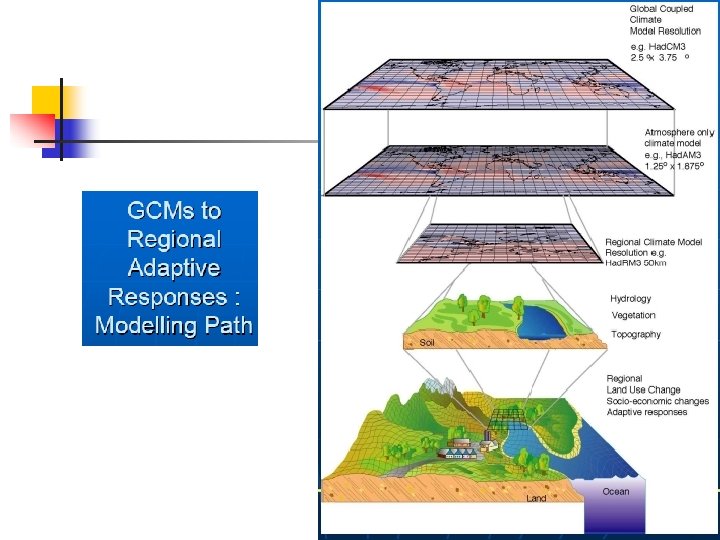
Downscaling of GCM ü ü ü Since Sri Lanka is an Island Resolution power of the grid points of the GCMs (300 km X 300 km) are not sufficient enough High diversity of altitude from sea level within short distance
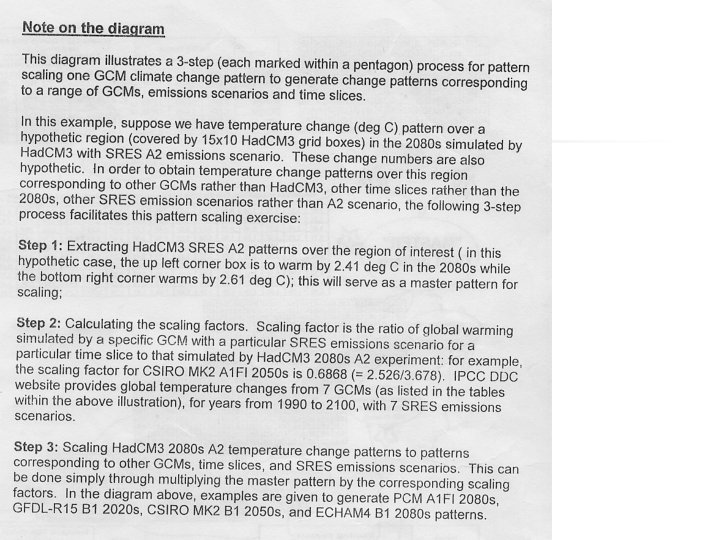
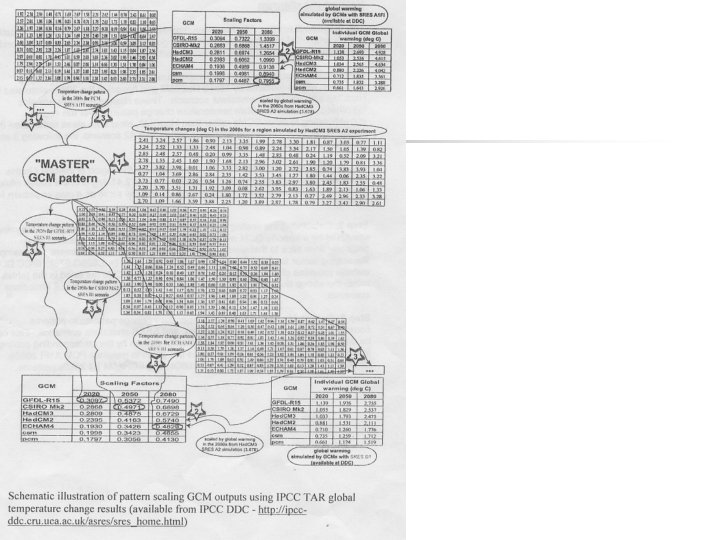
Downscaling Tools n GCM Based Statistical Downscaling is used Pattern Scaling Method n Sim. CLIM Software - developed by IGCI, University of Waikato, New Zealand
Baseline (1961 – 1990) Climatology n ANUSPLIN Software – developed by Australian National University (ANU) is used to spatially interpolate the rainfall and temperature fields with terrain effect
Climatology of Sri Lanka
Climatological Seasons n First Inter-Monsoon (FIM) n n Southwest Monsoon (SWM) n n May – September Second Inter-Monsoon (SIM) n n March & April October & November Northeast Monsoon (NEM) n December – February
Baseline (1961 -1990) average Rainfall in Northeast Monsoon (NEM) Baseline (1961 -1990) average Rainfall in Southwest Monsoon (SWM)
Baseline (1961 -1990) average Rainfall in First Inter Monsoon (FIM) Baseline (1961 -1990) average Rainfall in Second Inter Monsoon (SIM)
1961 -1990 Baseline average Tmean in Northeast Monsoon 1961 -1990 Baseline average Tmean in Second Inter Monsoon
1961 -1990 Baseline average Tmean in First Inter Monsoon 1961 -1990 Baseline average Tmean in Southwest Monsoon
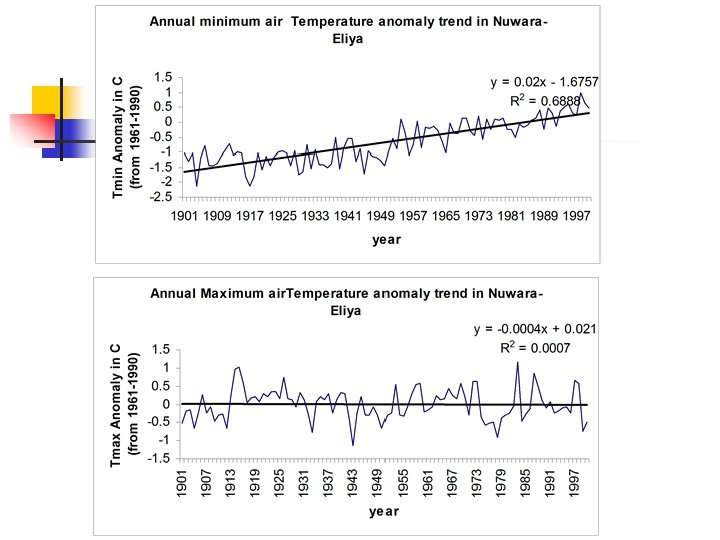
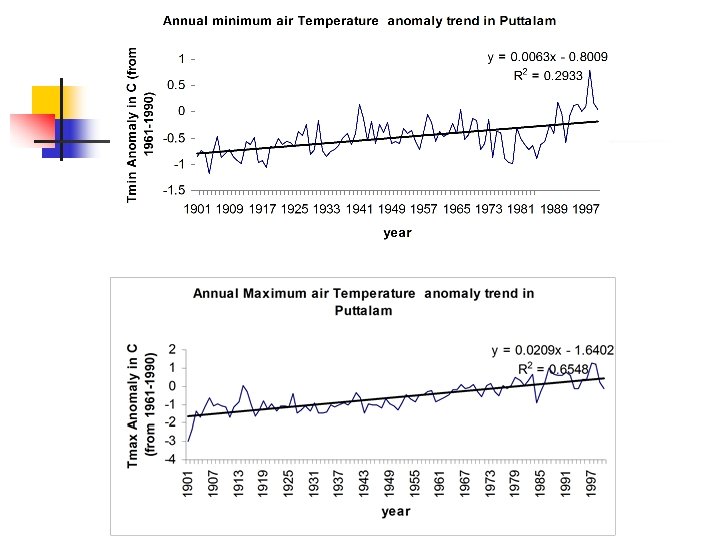
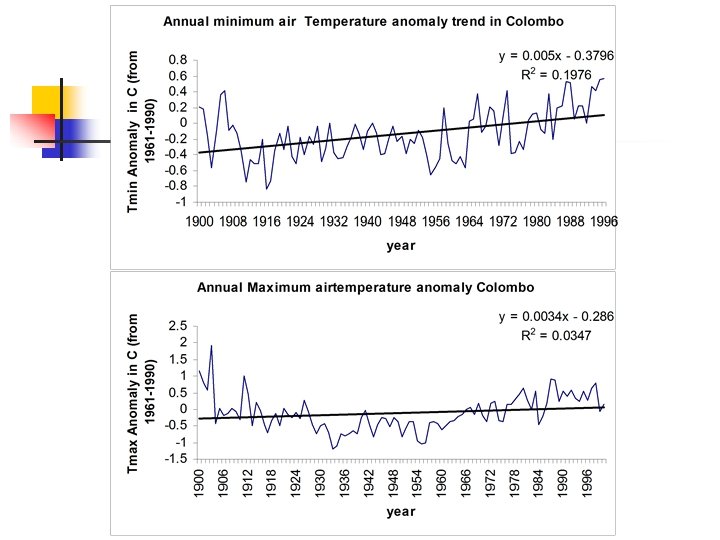
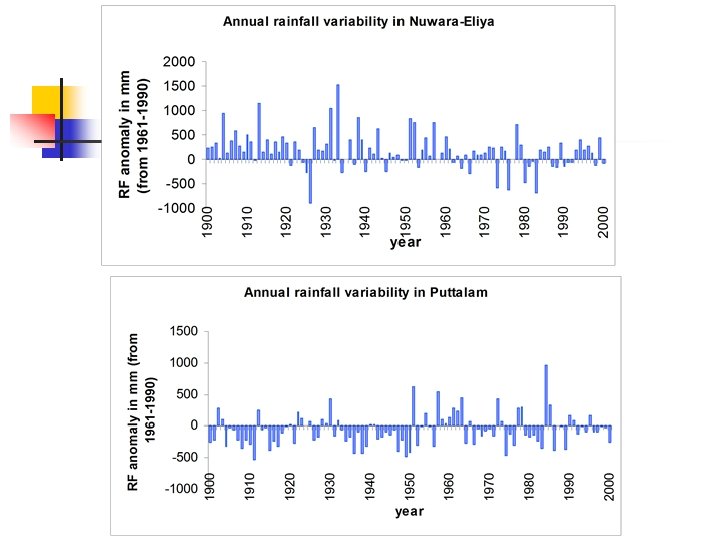
Observed Climate Changes in Sri Lanka
• temperature for the 1961 -1990 period is in the order of 0. 016 0 C per year.
Season Coefficient of Variation of all Sri Lanka Rainfall 1931 1960 – 1961 1990 Northeast Monsoon (Dec. to Feb. ) 31% 42% First Intermonsoon (Mar. to Apr. ) 23% 27% Southwest Monsoon (May. to Sep. ) 21% 16% Second Intermonsoon (Oct. to Nov) 22% 23% Annual (Jan. to Dec. ) 12% 14% - The Coefficient of Variation of all-Sri Lanka Rainfall during the periods 1931 -1960 and 1961 -1990.
Future Scenarios
General Circulation Models n n n Had. CM 3 CGCM CSIRO Emission Scenarios § A 1 FI § A 2 § B 1
Mean Temperature Change Scenarios in June 2100
Mean Temperature in June 2100 under the A 1 FI Had. CM 3 Mean Temperature in June 2100 under the A 2 Had. CM 3
Mean Temperature in June 2100 under the B 1 Had. CM 3
Mean Temperature in June 2100 under the A 1 FI CGCM Mean Temperature in June 2100 under the A 2 CGCM
Mean Temperature in June 2100 under the B 1 CGCM
Mean Temperature in June 2100 under the A 1 FI CSIRO Mean Temperature in June 2100 under the A 2 CSIRO
Mean Temperature in June 2100 under the B 1 CSIRO
Range of Mean Temperature Increment over the baseline in June 2100 Had. CM 3 CSIRO CGCM A 1 FI 2. 5 – 3. 0 2. 2 – 2. 4 2. 0 – 2. 2 A 2 2. 1 – 2. 5 1. 9 – 2. 0 1. 7 – 1. 8 B 1 1. 1 – 1. 4 1. 0 – 1. 1 0. 9 – 1. 0
Rainfall Change Scenarios in June 2100
Rainfall in June 2025 Under A 2 Had. CM 3 Rainfall in June 2050 Under A 2 Had. CM 3
Rainfall in June 2075 Under A 2 Had. CM 3 Rainfall in June 2100 Under A 2 Had. CM 3
Conclusions n n Projected Mean Temperature increases under different scenarios for different GCM models with varying magnitudes. Projected June Rainfall increases with Had. CM 3 under A 2 Scenario. The increments are much more higher on the western slopes of the central hills (windward side) compared to leeward side.
Acknowledgement n IGCI, University of Waikato, New Zealand is greatly acknowledged
Thank You
Station Topographical Location Coefficient of Variation (%) 1981 – 1990 1991 - 2000 Colombo Low Country 21% 20% Galle Low Country 28% 12% Ratnapura Low Country 23% 15% Kandy Mid Country 21% 22% Kenilworth Mid Country 37% 17% Talawakelle Up Country 28% 21% Nuwara-Eliya Up Country 26% 13% The Coefficient of Variation of southwest monsoon rainfall at selected stations in low, mid and up country regions during 1981 -1990 and 1990 -2000 periods (Basnayake and Punyawardane, 2003)