RAFIC HARIRI FOUNDATION STUDENTS Students distribution around the

RAFIC HARIRI FOUNDATION STUDENTS

Students distribution around the world ON N BA 82 E L 225 C 32 AN 91 AD A E EU RO P GES LLE O C N H TEC LEBANO IN 1161 . US A& &S O H UT 869 4 AF R ICA . ARAB COUNTRIES 263

Cum# 286 7788 15614 18912 22169 25306 27224 29032 30560 31818 32883 34028 34743 34932 35034 35063 35075 35091 35119 35187 35253 35400 35635 35828 35992 2013 2012 2011 2010 2009 2008 2007 2006 2005 2004 2003 2002 2001 2000 1999 1998 1997 1996 1995 1994 1993 1992 1991 1990 1989 1988 1987 1986 1985 1984 1983 40000 35000 30000 25000 20000 15000 10000 5000 0 2 99 35 28 8 35 35 6 35 00 4 35 53 2 35 7 18 35 19 1 35 91 0 35 5 07 35 63 0 35 34 0 35 32 9 34 3 74 34 43 7 34 28 0 34 83 8 32 8 81 31 60 5 30 32 0 29 24 2 27 06 3 25 9 16 22 12 9 18 4 61 15 8 8 77 6 28 Years 1983 1984 1985 1986 1987 1988 1989 1990 1991 1992 1993 1994 1995 1996 1997 1998 1999 2000 2001 2002 2003 2004 2005 2006 2007 2008 2009 2010

TABLE 1 Total Extension Program Language Technol. Medical Sciences Dentistry Pharmacy Health Sc. Medicine Prep. Prog. Juridical & Political Sc. Humanities & Social Sc. Agricult. Sc. Engineering & Architecture Business & Fine Arts Economics Major Country 22583 3004 ــ 339 3802 137 500 578 1330 ــ 649 2023 515 4566 4717 423 Lebanon 1161 ــ 29 ــ ــ 50 ــ ــ 239 ــ 381 444 18 Islamic & Technical Institute/Lebanon 263 ــ 22 3 30 24 ــ 82 ــ 14 28 6 49 1 4 Arab Countries 8694 2929 179 479 1722 72 146 76 637 ــ 165 885 31 1035 300 38 Europe & North Africa 3291 ــ 536 330 49 55 23 134 4 52 171 61 1337 491 48 U. S. A & Canada 179 1405 5857 288 725 727 2183 4 880 3346 613 7368 5953 531 Grand Total 35992 5933

PIE CHART

Numbers of all students sponsored by Rafic Hariri Foundation 23744 25000 20000 15000 10000 5000 0 8694 3291 263 USA & Canada Europe & North Africa Arab Countries Lebanon

Numbers of all students sponsored by Rafic Hariri Foundation Prep. Program /languages 6116 16, 99% Fine Arts 531 1, 48% Business & Economics 5953 16, 54% Technology 1405 3, 90% Engineering & Arctitecture 7368 20, 47% General Sc. 5857 16, 27% Agriculture Dentistry 288 0, 80% Pharmacy 725 2, 01% Health Sc. 727 2, 02% Medicine 2183 6, 07% Juridical & Humanities & Political Sc. 880 Social Sc. 2, 44% 3346 9, 30% 613 1, 70%

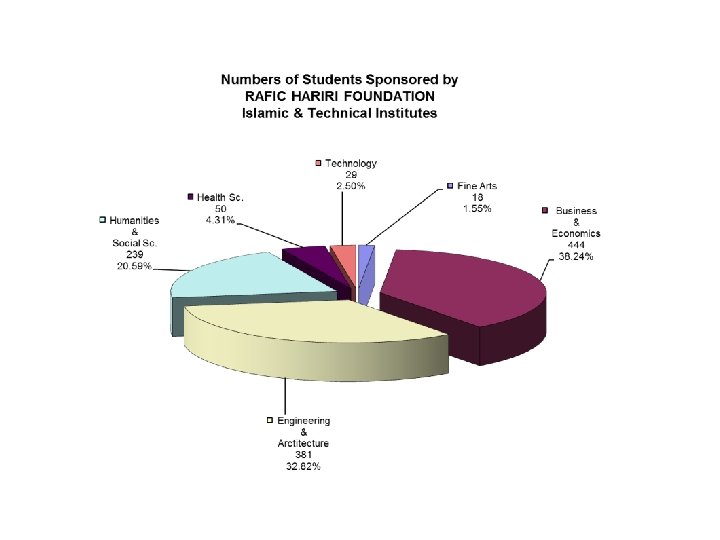
Numbers of Students Sponsored by RAFIC HARIRI FOUNDATION in Lebanon Prep. Program /languages 3004 Technology 13, 30% 339 1, 50% Business & Economics 4717 20, 89% Fine Arts 423 1, 87% General Sc. 3802 16, 84% Engineering & Arctitecture 4566 20, 22% Dentistry 137 0, 61% Pharmacy 500 2, 21% Health Sc. 578 2, 56% Medicine 1330 5, 89% Juridical & Political Sc. 649 2, 87% Humanities & Social Sc. 2023 8, 96% Agriculture 515 2, 28%

Numbers of Students Sponsored by RAFIC HARIRI FOUNDATION in Lebanon 2023 2500 1330 1500 137 500 3004 3500 gy am gr es ro ag. P gu ep /lan Pr c. l. S lo no ch Te a er en G y . Sc ac try tis en D th m ar Ph l ea H Bu ne Fi o on ts Ar Ec e in ic ed M al ic & rid. Ju Sc al ic lit s Poitie & an c. um l. S H ia c So re tu ul ric Ag ing er & e ne ur gi ct En ite ct Ar ss ne & si s ic m 0 339 578 649 515 423 1000 4566 4717 5000 4500 4000 3802 3000 2000

Numbers of Students Sponsored by RAFIC HARIRI FOUNDATION ARABE COUNTRIES General Sc. 3 1, 14% Technology 22 8, 37% Prep. Program /languages 0 0% Fine Arts 4 1, 52% Business & Economics 1 0, 38% Engineering & Arctitecture 49 18, 63% Agriculture Dentistry 30 11, 41% 6 2, 28% Pharmacy 24 9, 13% Health Sc. 0 0% Humanities & Social Sc. 28 10, 65% Medicine 82 31, 18% Juridical & Political Sc. 14 5, 32%

Numbers of Students Sponsored by RAFIC HARIRI FOUNDATION Europe & North. Engineering Africa & Prep. Program /languages 3108 35, 75% Business & Economics 300 3, 45% Fine Arts 38 0, 44% Arctitecture 1035 11, 90% Agriculture 31 0, 36% Humanities & Social Sc. 885 10, 18% Juridical & Political Sc. 165 1, 90% Medicine 637 7, 33% Technology 479 5, 51% General Sc. 1722 19, 81% Dentistry 72 0, 83% Pharmacy 146 1, 68% Health Sc. 76 0, 87%

Numbers of Students Sponsored by RAFIC HARIRI FOUNDATION USA & Canada General Sc. 330 10, 03% Technology 536 16, 29% Prep. Program /languages 4 0, 12% Fine Arts 48 1, 46% Business & Economics 491 14, 92% Dentistry 49 1, 49% Pharmacy 55 1, 67% Health Sc. 23 0, 70% Medicine 134 4, 07% Agriculture Juridical & Political Sc. 52 1, 58% Humanities & Social Sc. 171 5, 20% 61 1, 85% Engineering & Arctitecture 1337 40, 63%

PHD 853 MEDECINE 1813 MASTER 1829 BA/BS 24227 INSTITUTES 1161 PREPARATORIES PROGRAM 6116
- Slides: 14