
Radio Propagation Large Scale Path Loss CS 515





- Slides: 95
Radio Propagation - Large -Scale Path Loss CS 515 Mobile and Wireless Networking Ibrahim Korpeoglu Computer Engineering Department Bilkent University, Ankara 12/6/2020 1
Reading Homework Due Date: Next Wednesday n n Read the handouts that wa have put into the library Read the following paper: n J. B. Andersen, T. S. Rappaport, S. Yoshida, Propagation Measurements and Models for Wireless Communications Channels, IEEE Communications Magazine, (January 1995), pp. 42 -49. n n Read Chapter 4 of Rappaport’s Book. You have of course read the previous 4 papers! CS 515 Ibrahim Korpeoglu 2
Basics n n n When electrons move, they create electromagnetic waves that can propagate through the space Number of oscillations per second of an electromagnetic wave is called its frequency, f, measured in Hertz. The distance between two consecutive maxima is called the wavelength, designated by l. CS 515 Ibrahim Korpeoglu 3
Basics n n By attaching an antenna of the appropriate size to an electrical circuit, the electromagnetic waves can be broadcast efficiently and received by a receiver some distance away. In vacuum, all electromagnetic waves travel at the speed of light: c = 3 x 10⁸ m/sec. In copper or fiber the speed slows down to about 2/3 of this value. Relation between f, l , c: lf = c CS 515 Ibrahim Korpeoglu 4
Basics n n We have seen earlier the electromagnetic spectrum. The radio, microwave, infrared, and visible light portions of the spectrum can all be used to transmit information q CS 515 By modulating the amplitude, frequency, or phase of the waves. Ibrahim Korpeoglu 5
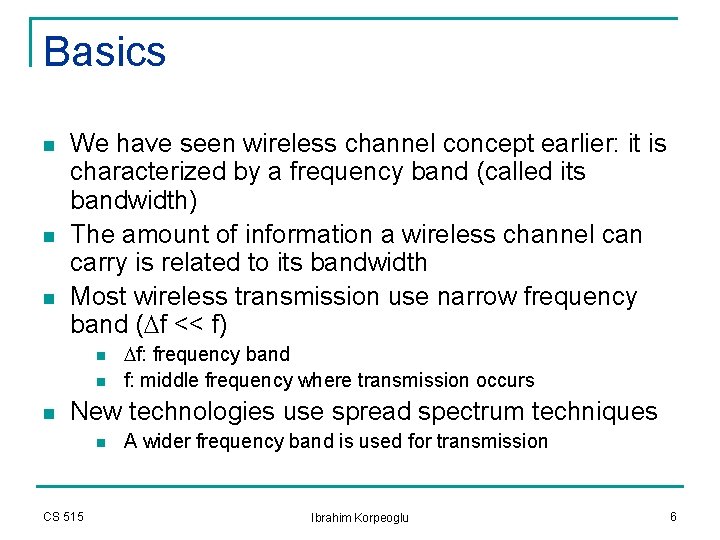
Basics n n n We have seen wireless channel concept earlier: it is characterized by a frequency band (called its bandwidth) The amount of information a wireless channel can carry is related to its bandwidth Most wireless transmission use narrow frequency band (Df << f) n n n Df: frequency band f: middle frequency where transmission occurs New technologies use spread spectrum techniques n CS 515 A wider frequency band is used for transmission Ibrahim Korpeoglu 6
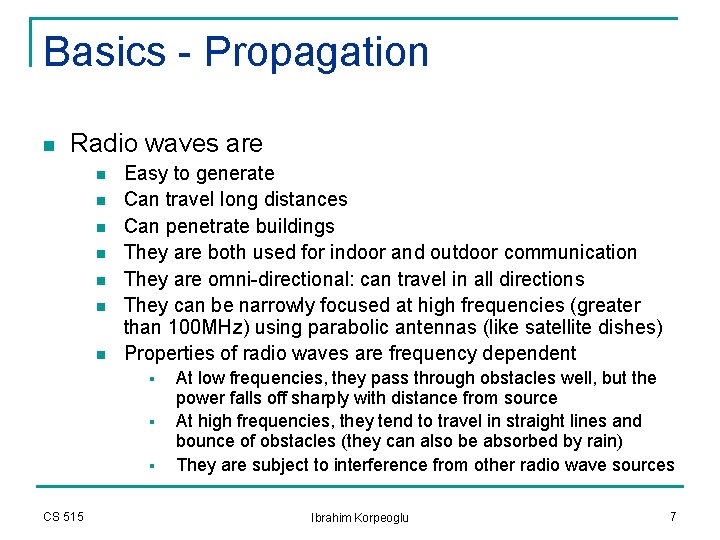
Basics - Propagation n Radio waves are n n n n Easy to generate Can travel long distances Can penetrate buildings They are both used for indoor and outdoor communication They are omni-directional: can travel in all directions They can be narrowly focused at high frequencies (greater than 100 MHz) using parabolic antennas (like satellite dishes) Properties of radio waves are frequency dependent § § § CS 515 At low frequencies, they pass through obstacles well, but the power falls off sharply with distance from source At high frequencies, they tend to travel in straight lines and bounce of obstacles (they can also be absorbed by rain) They are subject to interference from other radio wave sources Ibrahim Korpeoglu 7
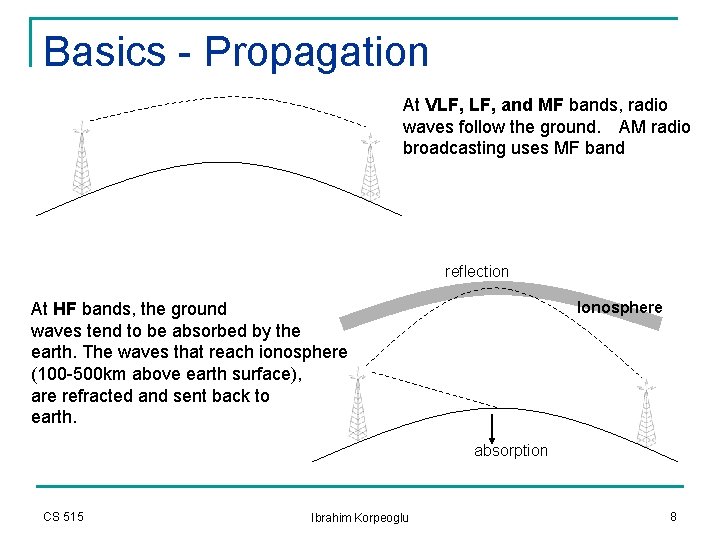
Basics - Propagation At VLF, and MF bands, radio waves follow the ground. AM radio broadcasting uses MF band reflection Ionosphere At HF bands, the ground waves tend to be absorbed by the earth. The waves that reach ionosphere (100 -500 km above earth surface), are refracted and sent back to earth. absorption CS 515 Ibrahim Korpeoglu 8
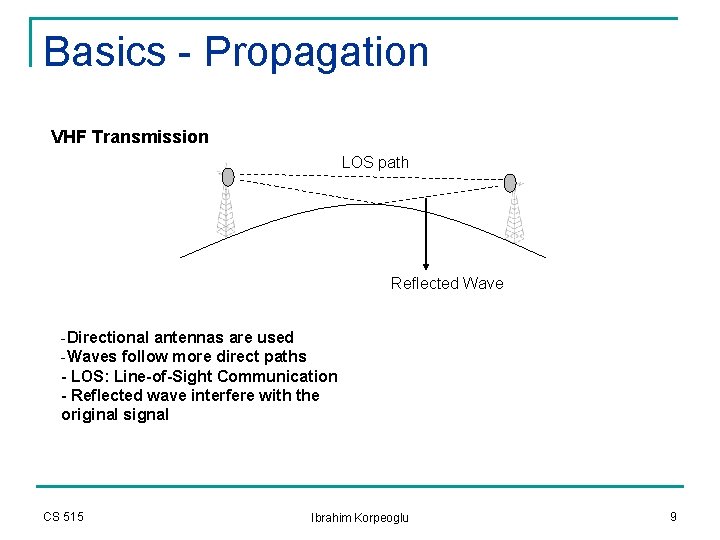
Basics - Propagation VHF Transmission LOS path Reflected Wave -Directional antennas are used -Waves follow more direct paths - LOS: Line-of-Sight Communication - Reflected wave interfere with the original signal CS 515 Ibrahim Korpeoglu 9
Basics - Propagation n Waves behave more like light at higher frequencies n n n Difficulty in passing obstacles More direct paths They behave more like radio at lower frequencies n CS 515 Can pass obstacles Ibrahim Korpeoglu 10
Propagation Models n n We are interested in propagation characteristics and models for waves with frequencyy in range: few MHz to a few GHz Modeling radio channel is important for: n Determining the coverage area of a transmitter § § n Finding modulation and coding schemes to improve the channel quality § CS 515 Determine the transmitter power requirement Determine the battery lifetime Determine the maximum channel capacity Ibrahim Korpeoglu 11
Radio Propagation Models n Transmission path between sender and receiver could be n n n Line-of-Sight (LOS) Obstructed by buildings, mountains and foliage Even speed of motion effects the fading characteristics of the channel CS 515 Ibrahim Korpeoglu 12
Radio Propagation Mechanisms n The physical mechanisms that govern radio propagation are complex and diverse, but generally attributed to the following three factors 1. 2. 3. q Reflection n CS 515 Reflection Diffraction Scattering Occurs when waves impinges upon an obstruction that is much larger in size compared to the wavelength of the signal Example: reflections from earth and buildings These reflections may interfere with the original signal constructively or destructively Ibrahim Korpeoglu 13
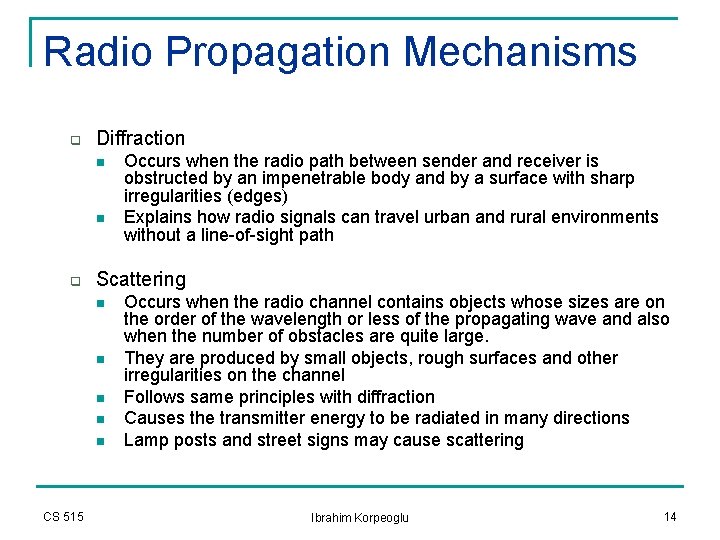
Radio Propagation Mechanisms q Diffraction n n q Scattering n n n CS 515 Occurs when the radio path between sender and receiver is obstructed by an impenetrable body and by a surface with sharp irregularities (edges) Explains how radio signals can travel urban and rural environments without a line-of-sight path Occurs when the radio channel contains objects whose sizes are on the order of the wavelength or less of the propagating wave and also when the number of obstacles are quite large. They are produced by small objects, rough surfaces and other irregularities on the channel Follows same principles with diffraction Causes the transmitter energy to be radiated in many directions Lamp posts and street signs may cause scattering Ibrahim Korpeoglu 14
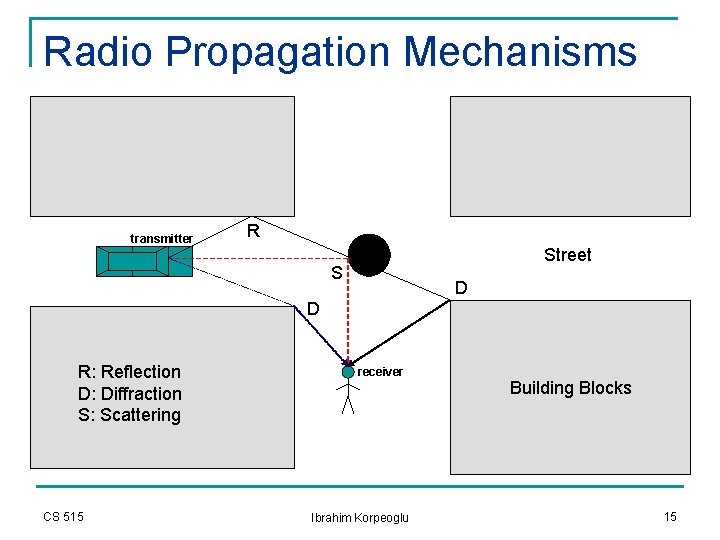
Radio Propagation Mechanisms transmitter R Street S D D R: Reflection D: Diffraction S: Scattering CS 515 receiver Ibrahim Korpeoglu Building Blocks 15
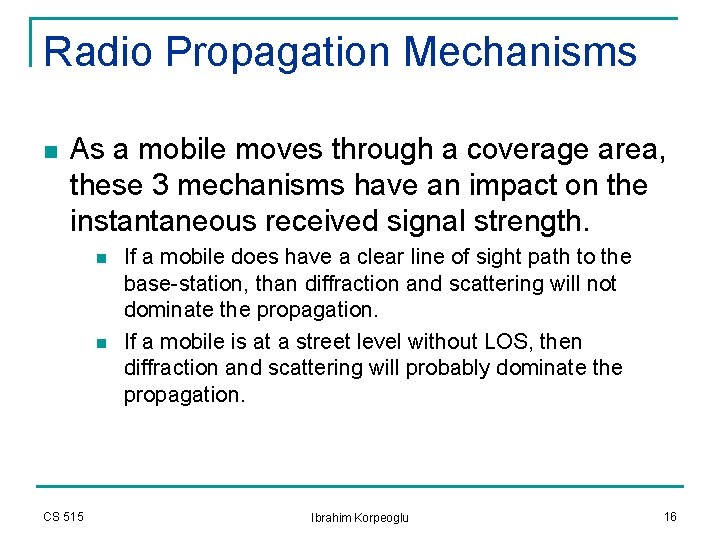
Radio Propagation Mechanisms n As a mobile moves through a coverage area, these 3 mechanisms have an impact on the instantaneous received signal strength. n n CS 515 If a mobile does have a clear line of sight path to the base-station, than diffraction and scattering will not dominate the propagation. If a mobile is at a street level without LOS, then diffraction and scattering will probably dominate the propagation. Ibrahim Korpeoglu 16
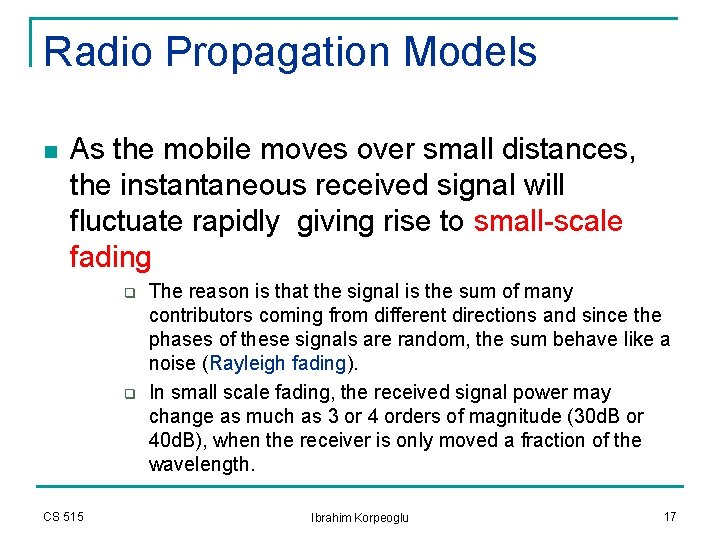
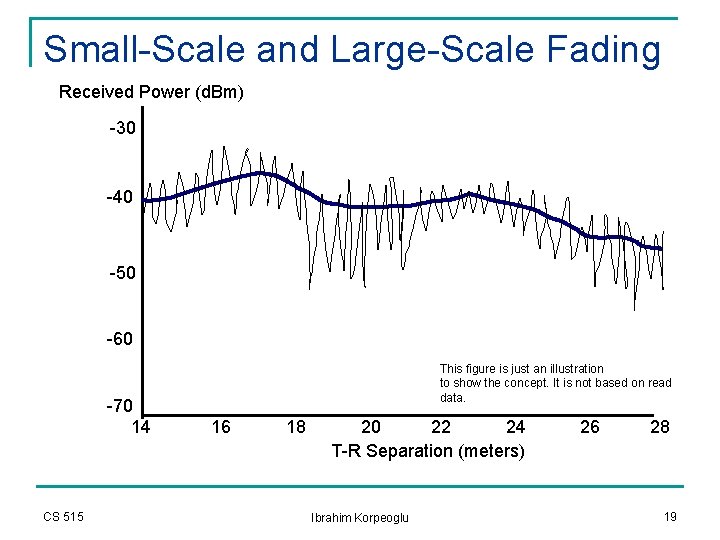
Radio Propagation Models n As the mobile moves over small distances, the instantaneous received signal will fluctuate rapidly giving rise to small-scale fading q q CS 515 The reason is that the signal is the sum of many contributors coming from different directions and since the phases of these signals are random, the sum behave like a noise (Rayleigh fading). In small scale fading, the received signal power may change as much as 3 or 4 orders of magnitude (30 d. B or 40 d. B), when the receiver is only moved a fraction of the wavelength. Ibrahim Korpeoglu 17
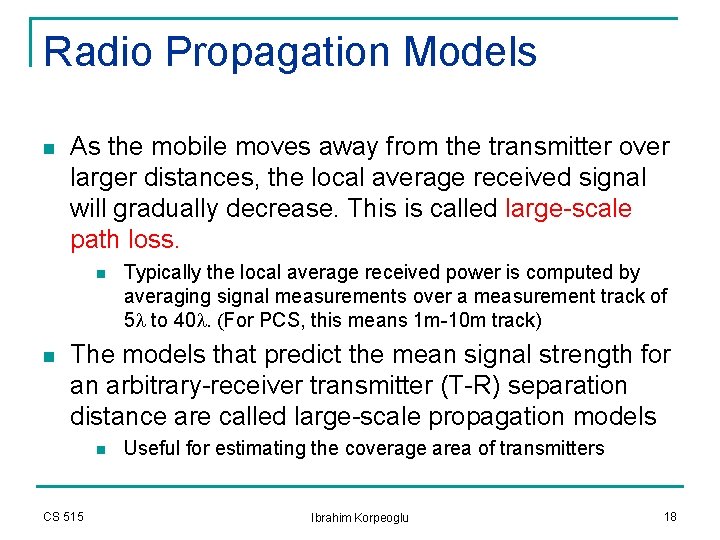
Radio Propagation Models n As the mobile moves away from the transmitter over larger distances, the local average received signal will gradually decrease. This is called large-scale path loss. n n Typically the local average received power is computed by averaging signal measurements over a measurement track of 5 l to 40 l. (For PCS, this means 1 m-10 m track) The models that predict the mean signal strength for an arbitrary-receiver transmitter (T-R) separation distance are called large-scale propagation models n CS 515 Useful for estimating the coverage area of transmitters Ibrahim Korpeoglu 18
Small-Scale and Large-Scale Fading Received Power (d. Bm) -30 -40 -50 -60 -70 14 CS 515 This figure is just an illustration to show the concept. It is not based on read data. 16 18 20 22 24 T-R Separation (meters) Ibrahim Korpeoglu 26 28 19
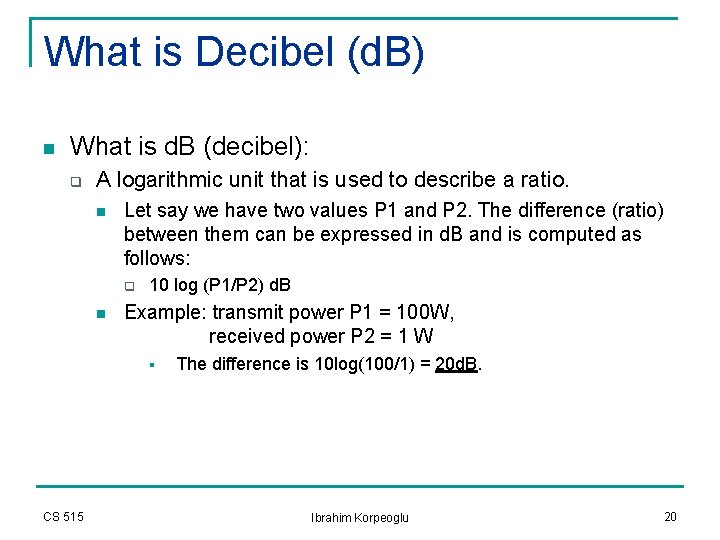
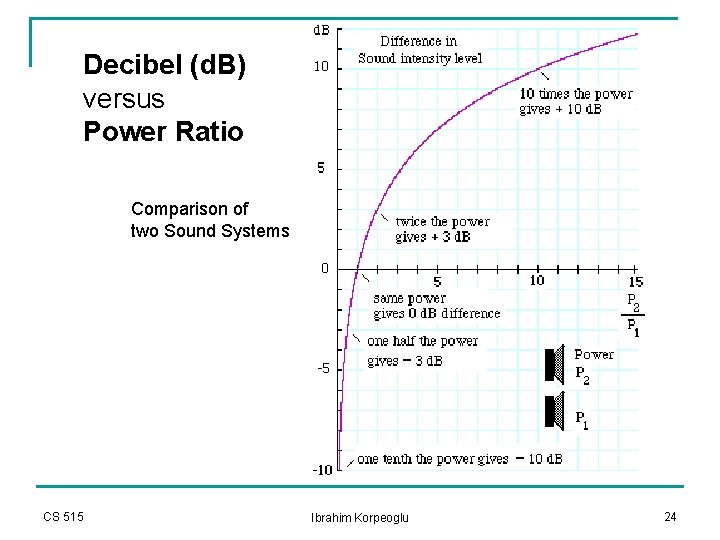
What is Decibel (d. B) n What is d. B (decibel): q A logarithmic unit that is used to describe a ratio. n Let say we have two values P 1 and P 2. The difference (ratio) between them can be expressed in d. B and is computed as follows: q n 10 log (P 1/P 2) d. B Example: transmit power P 1 = 100 W, received power P 2 = 1 W § CS 515 The difference is 10 log(100/1) = 20 d. B. Ibrahim Korpeoglu 20
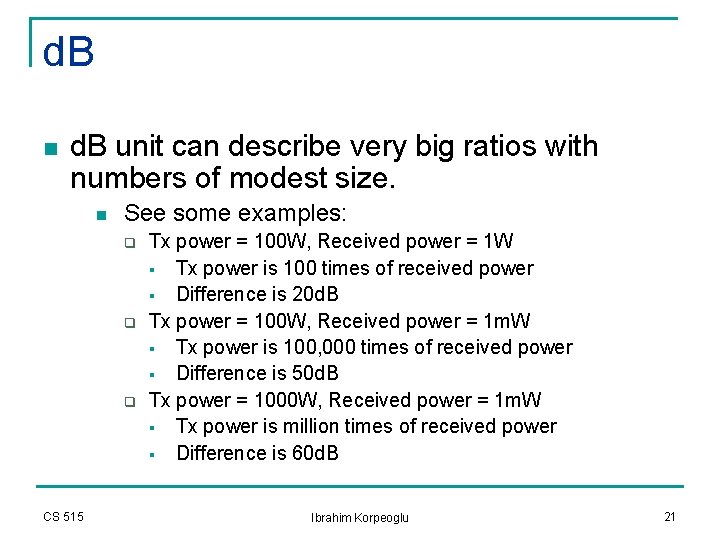
d. B n d. B unit can describe very big ratios with numbers of modest size. n See some examples: q q q CS 515 Tx power = 100 W, Received power = 1 W § Tx power is 100 times of received power § Difference is 20 d. B Tx power = 100 W, Received power = 1 m. W § Tx power is 100, 000 times of received power § Difference is 50 d. B Tx power = 1000 W, Received power = 1 m. W § Tx power is million times of received power § Difference is 60 d. B Ibrahim Korpeoglu 21
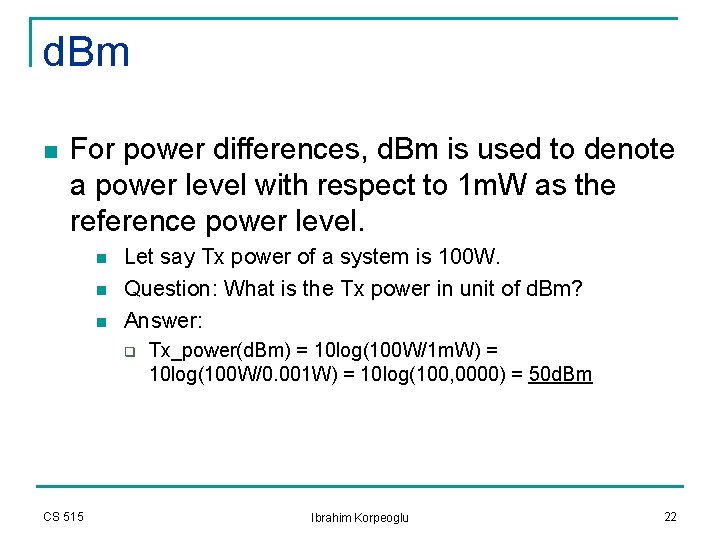
d. Bm n For power differences, d. Bm is used to denote a power level with respect to 1 m. W as the reference power level. n n n Let say Tx power of a system is 100 W. Question: What is the Tx power in unit of d. Bm? Answer: q CS 515 Tx_power(d. Bm) = 10 log(100 W/1 m. W) = 10 log(100 W/0. 001 W) = 10 log(100, 0000) = 50 d. Bm Ibrahim Korpeoglu 22
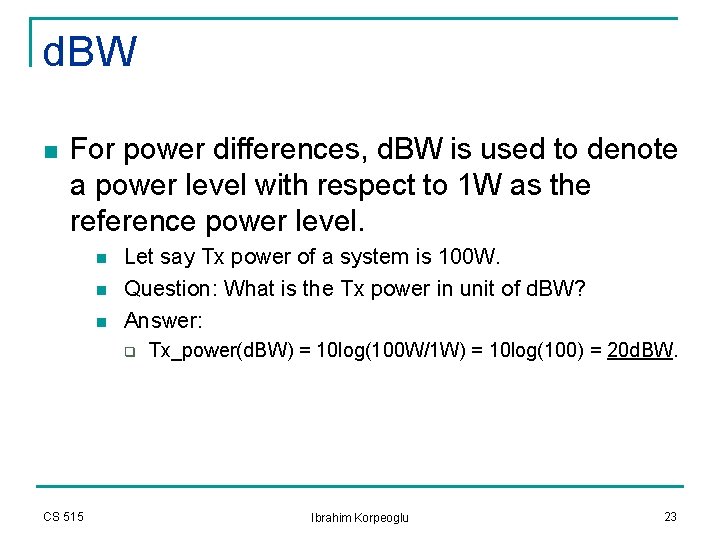
d. BW n For power differences, d. BW is used to denote a power level with respect to 1 W as the reference power level. n n n Let say Tx power of a system is 100 W. Question: What is the Tx power in unit of d. BW? Answer: q CS 515 Tx_power(d. BW) = 10 log(100 W/1 W) = 10 log(100) = 20 d. BW. Ibrahim Korpeoglu 23
Decibel (d. B) versus Power Ratio Comparison of two Sound Systems CS 515 Ibrahim Korpeoglu 24
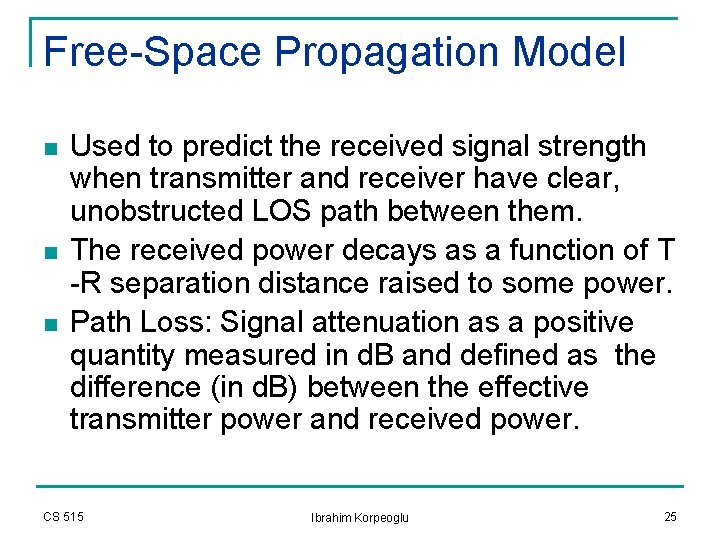
Free-Space Propagation Model n n n Used to predict the received signal strength when transmitter and receiver have clear, unobstructed LOS path between them. The received power decays as a function of T -R separation distance raised to some power. Path Loss: Signal attenuation as a positive quantity measured in d. B and defined as the difference (in d. B) between the effective transmitter power and received power. CS 515 Ibrahim Korpeoglu 25
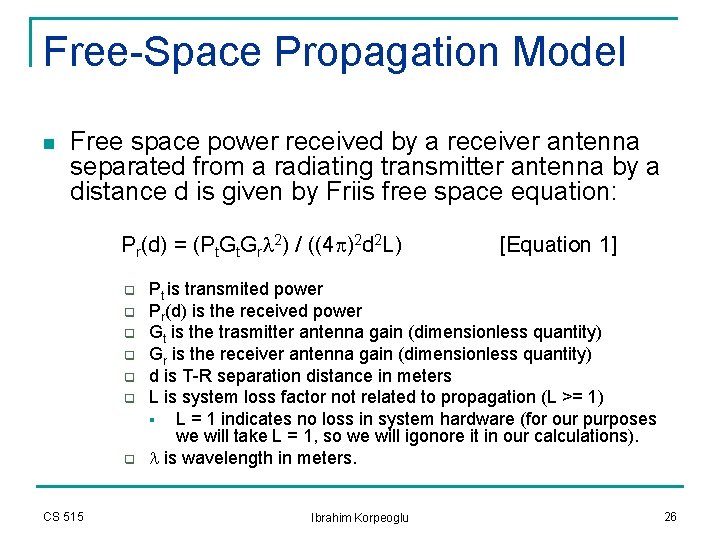
Free-Space Propagation Model n Free space power received by a receiver antenna separated from a radiating transmitter antenna by a distance d is given by Friis free space equation: Pr(d) = (Pt. Grl 2) / ((4 p)2 d 2 L) q q q q CS 515 [Equation 1] Pt is transmited power Pr(d) is the received power Gt is the trasmitter antenna gain (dimensionless quantity) Gr is the receiver antenna gain (dimensionless quantity) d is T-R separation distance in meters L is system loss factor not related to propagation (L >= 1) § L = 1 indicates no loss in system hardware (for our purposes we will take L = 1, so we will igonore it in our calculations). l is wavelength in meters. Ibrahim Korpeoglu 26
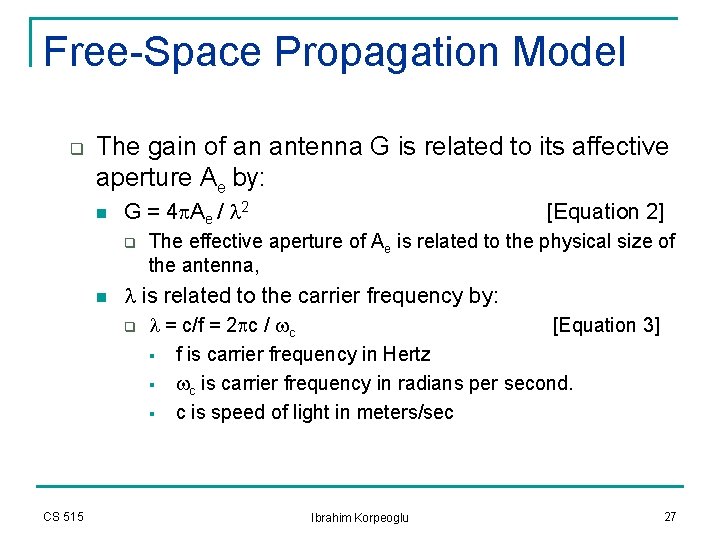
Free-Space Propagation Model q The gain of an antenna G is related to its affective aperture Ae by: n G = 4 p. Ae / l 2 q n The effective aperture of Ae is related to the physical size of the antenna, l is related to the carrier frequency by: q CS 515 [Equation 2] l = c/f = 2 pc / wc [Equation 3] § f is carrier frequency in Hertz § wc is carrier frequency in radians per second. § c is speed of light in meters/sec Ibrahim Korpeoglu 27
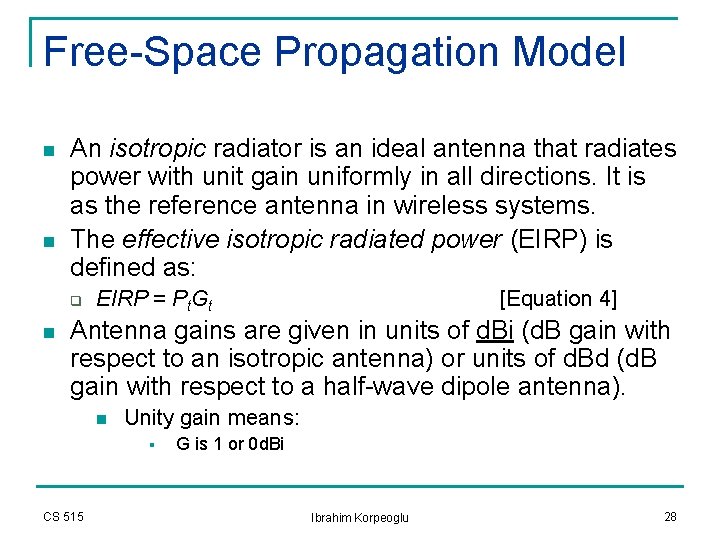
Free-Space Propagation Model n n An isotropic radiator is an ideal antenna that radiates power with unit gain uniformly in all directions. It is as the reference antenna in wireless systems. The effective isotropic radiated power (EIRP) is defined as: q n EIRP = Pt. Gt [Equation 4] Antenna gains are given in units of d. Bi (d. B gain with respect to an isotropic antenna) or units of d. Bd (d. B gain with respect to a half-wave dipole antenna). n Unity gain means: § CS 515 G is 1 or 0 d. Bi Ibrahim Korpeoglu 28
Free-Space Propagation Model n Path loss, which represents signal attenuation as positive quantity measured in d. B, is defined as the difference (in d. B) between the effective transmitted power and the received power. PL(d. B) = 10 log (Pt/Pr) = -10 log[(Gt. Grl 2)/(4 p)2 d 2] [Equation 5] (You can drive this from equation 1) q If antennas have unity gains (exclude them) PL(d. B) = 10 log (Pt/Pr) = -10 log[l 2/(4 p)2 d 2] CS 515 Ibrahim Korpeoglu [Equation 6] 29
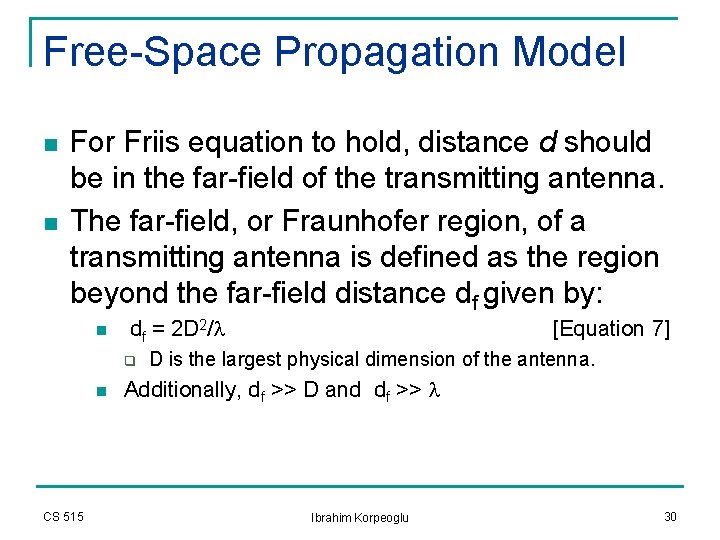
Free-Space Propagation Model n n For Friis equation to hold, distance d should be in the far-field of the transmitting antenna. The far-field, or Fraunhofer region, of a transmitting antenna is defined as the region beyond the far-field distance df given by: n df = 2 D 2/l q n CS 515 [Equation 7] D is the largest physical dimension of the antenna. Additionally, df >> D and df >> l Ibrahim Korpeoglu 30
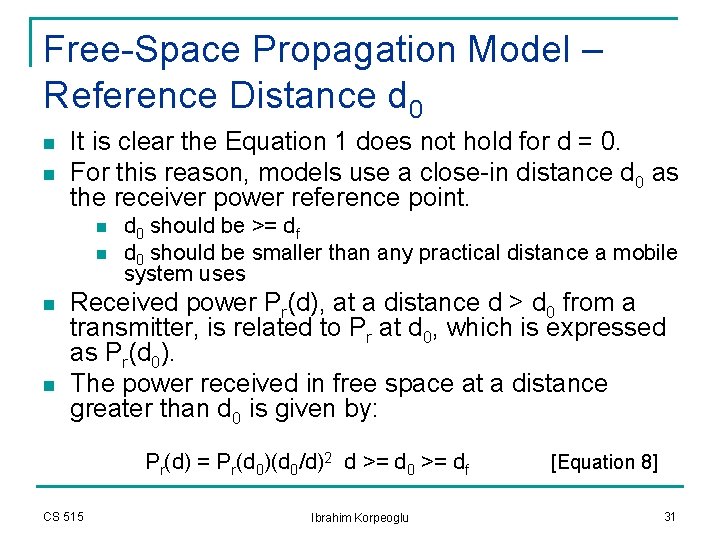
Free-Space Propagation Model – Reference Distance d 0 n n It is clear the Equation 1 does not hold for d = 0. For this reason, models use a close-in distance d 0 as the receiver power reference point. n n d 0 should be >= df d 0 should be smaller than any practical distance a mobile system uses Received power Pr(d), at a distance d > d 0 from a transmitter, is related to Pr at d 0, which is expressed as Pr(d 0). The power received in free space at a distance greater than d 0 is given by: Pr(d) = Pr(d 0)(d 0/d)2 d >= d 0 >= df CS 515 Ibrahim Korpeoglu [Equation 8] 31
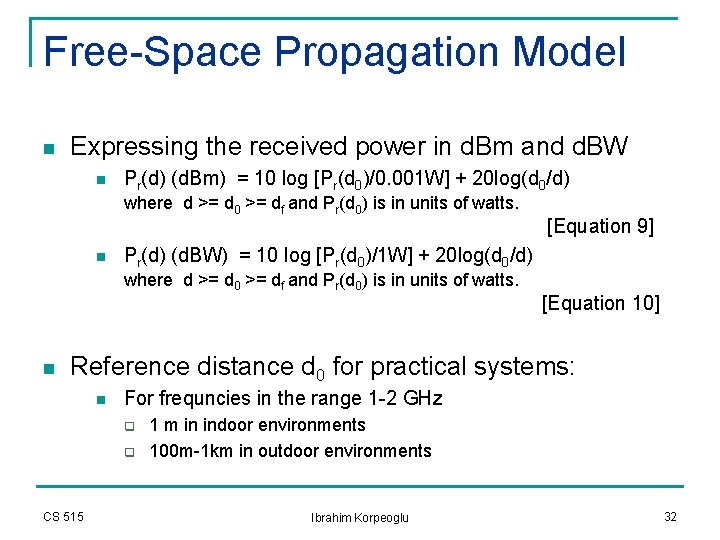
Free-Space Propagation Model n Expressing the received power in d. Bm and d. BW n Pr(d) (d. Bm) = 10 log [Pr(d 0)/0. 001 W] + 20 log(d 0/d) where d >= d 0 >= df and Pr(d 0) is in units of watts. n Pr(d) (d. BW) = 10 log [Pr(d 0)/1 W] + 20 log(d 0/d) where d >= d 0 >= df and Pr(d 0) is in units of watts. n [Equation 9] [Equation 10] Reference distance d 0 for practical systems: n For frequncies in the range 1 -2 GHz q q CS 515 1 m in indoor environments 100 m-1 km in outdoor environments Ibrahim Korpeoglu 32
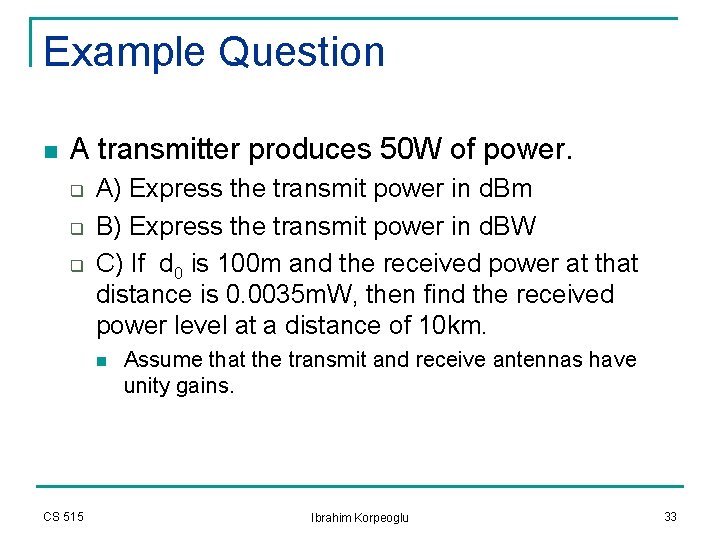
Example Question n A transmitter produces 50 W of power. q q q A) Express the transmit power in d. Bm B) Express the transmit power in d. BW C) If d 0 is 100 m and the received power at that distance is 0. 0035 m. W, then find the received power level at a distance of 10 km. n CS 515 Assume that the transmit and receive antennas have unity gains. Ibrahim Korpeoglu 33
Solution n A) q q n Pt(W) is 50 W. Pt(d. Bm) = 10 log[Pt(m. W)/1 m. W)] Pt(d. Bm) = 10 log(50 x 1000) Pt(d. Bm) = 47 d. Bm B) q CS 515 Pt(d. BW) = 10 log[Pt(W)/1 W)] Pt(d. BW) = 10 log(50) Pt(d. BW) = 17 d. BW Ibrahim Korpeoglu 34
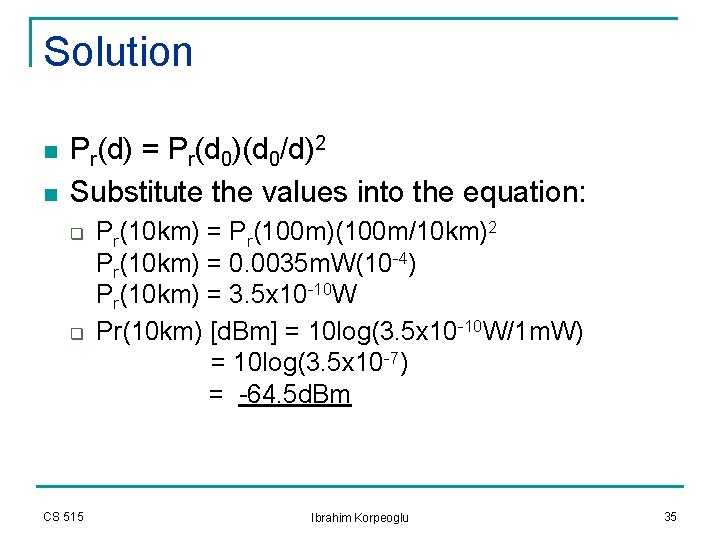
Solution n n Pr(d) = Pr(d 0)(d 0/d)2 Substitute the values into the equation: q q CS 515 Pr(10 km) = Pr(100 m)(100 m/10 km)2 Pr(10 km) = 0. 0035 m. W(10 -4) Pr(10 km) = 3. 5 x 10 -10 W Pr(10 km) [d. Bm] = 10 log(3. 5 x 10 -10 W/1 m. W) = 10 log(3. 5 x 10 -7) = -64. 5 d. Bm Ibrahim Korpeoglu 35
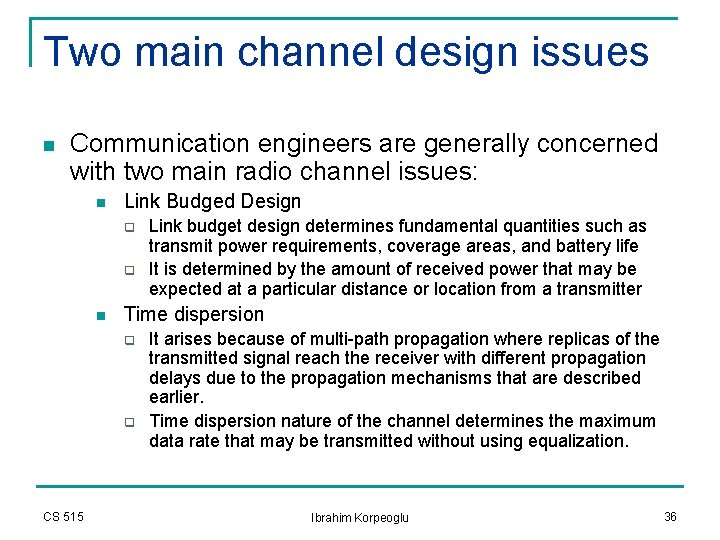
Two main channel design issues n Communication engineers are generally concerned with two main radio channel issues: n Link Budged Design q q n Time dispersion q q CS 515 Link budget design determines fundamental quantities such as transmit power requirements, coverage areas, and battery life It is determined by the amount of received power that may be expected at a particular distance or location from a transmitter It arises because of multi-path propagation where replicas of the transmitted signal reach the receiver with different propagation delays due to the propagation mechanisms that are described earlier. Time dispersion nature of the channel determines the maximum data rate that may be transmitted without using equalization. Ibrahim Korpeoglu 36
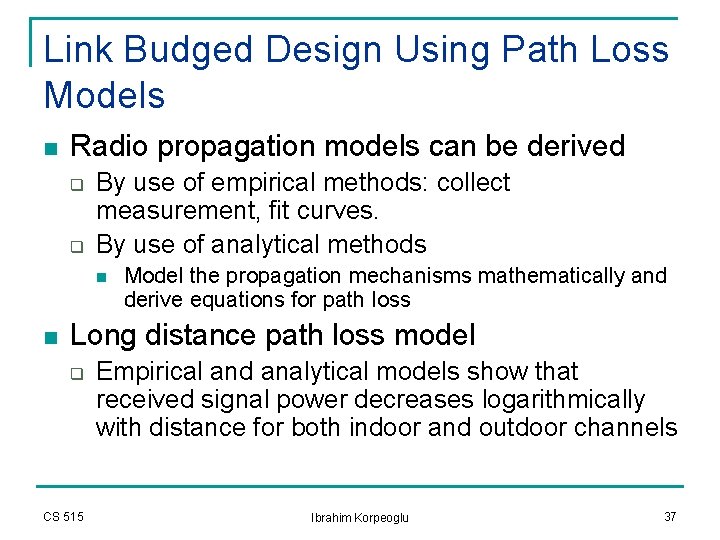
Link Budged Design Using Path Loss Models n Radio propagation models can be derived q q By use of empirical methods: collect measurement, fit curves. By use of analytical methods n n Model the propagation mechanisms mathematically and derive equations for path loss Long distance path loss model q CS 515 Empirical and analytical models show that received signal power decreases logarithmically with distance for both indoor and outdoor channels Ibrahim Korpeoglu 37
Announcements q q q CS 515 Please download the homework from the course webpage again. I made some important corrrections and modifications! I recommend that you read Chapter 4 of the book and “radio propagation paper” in parallel. Start early doing the homework! The last night before deadline may be loo late!!!. I put some links about math and statistics resources on the course webpage. I put a Z table on the webpage. Q-table and Z-table are related as follows: Q_table(z) = 0. 5 - Z_table(z) Ibrahim Korpeoglu 38
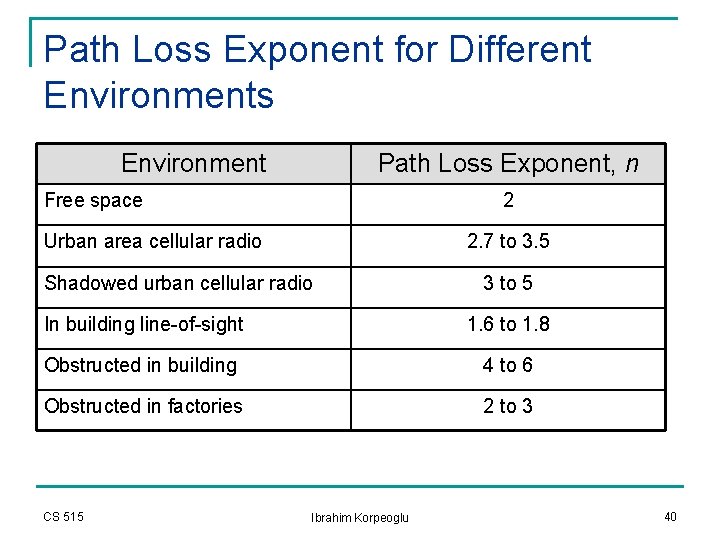
Long distance path loss model n The average large-scale path loss for an arbitrary TR separation is expressed as a function of distance by using a path loss exponent n: n CS 515 Equation 11 The value of n depends on the propagation environment: for free space it is 2; when obstructions are present it has a larger value. Ibrahim Korpeoglu 39
Path Loss Exponent for Different Environments Environment Path Loss Exponent, n Free space 2 Urban area cellular radio 2. 7 to 3. 5 Shadowed urban cellular radio 3 to 5 In building line-of-sight 1. 6 to 1. 8 Obstructed in building 4 to 6 Obstructed in factories 2 to 3 CS 515 Ibrahim Korpeoglu 40
Selection of free space reference distance n In large coverage cellular systems q n In microcellular systems q n 1 km reference distances are commonly used Much smaller distances are used: such as 100 m or 1 m. The reference distance should always be in the far-field of the antenna so that near-field effects do not alter the reference path loss. CS 515 Ibrahim Korpeoglu 41
Log-normal Shadowing n n n Equation 11 does not consider the fact the surrounding environment may be vastly different at two locations having the same TR separation This leads to measurements that are different than the predicted values obtained using the above equation. Measurements show that for any value d, the path loss PL(d) in d. Bm at a particular location is random and distributed normally. CS 515 Ibrahim Korpeoglu 42
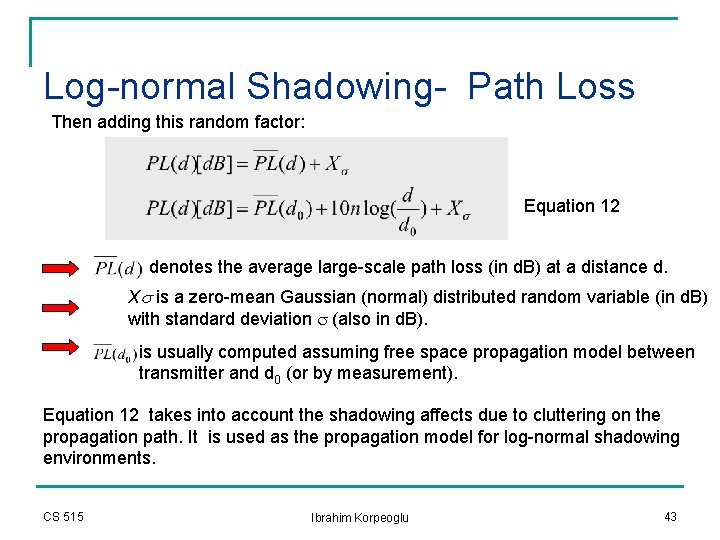
Log-normal Shadowing- Path Loss Then adding this random factor: Equation 12 denotes the average large-scale path loss (in d. B) at a distance d. Xs is a zero-mean Gaussian (normal) distributed random variable (in d. B) with standard deviation s (also in d. B). is usually computed assuming free space propagation model between transmitter and d 0 (or by measurement). Equation 12 takes into account the shadowing affects due to cluttering on the propagation path. It is used as the propagation model for log-normal shadowing environments. CS 515 Ibrahim Korpeoglu 43
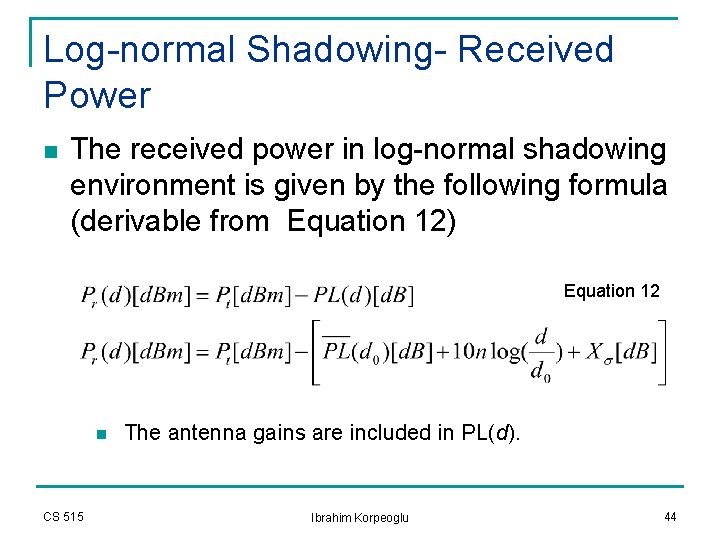
Log-normal Shadowing- Received Power n The received power in log-normal shadowing environment is given by the following formula (derivable from Equation 12) Equation 12 n CS 515 The antenna gains are included in PL(d). Ibrahim Korpeoglu 44
Log-normal Shadowing, n and s n n The log-normal shadowing model indicates the received power at a distance d is normally distributed with a distance dependent mean and with a standard deviation of s In practice the values of n and s are computed from measured data using linear regression so that the difference between the measured data and estimated path losses are minimized in a mean square error sense. CS 515 Ibrahim Korpeoglu 45
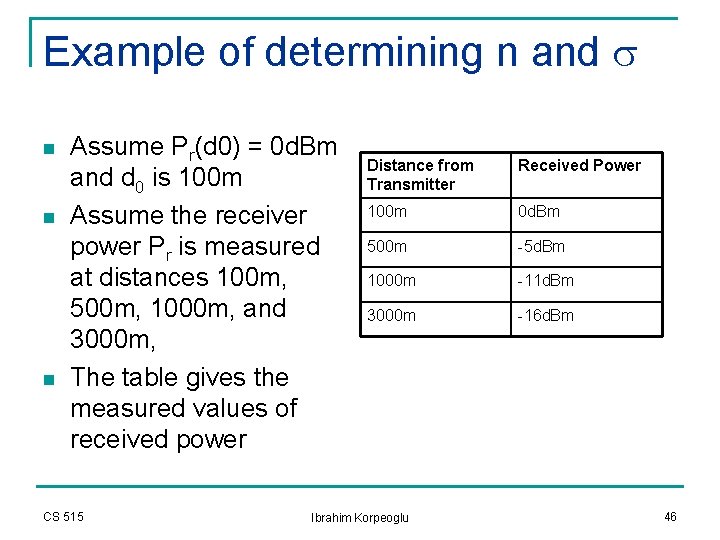
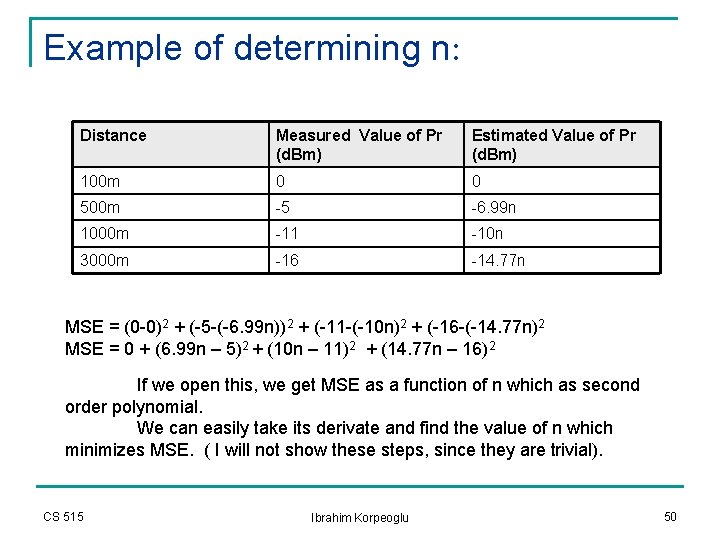
Example of determining n and s n n n Assume Pr(d 0) = 0 d. Bm and d 0 is 100 m Assume the receiver power Pr is measured at distances 100 m, 500 m, 1000 m, and 3000 m, The table gives the measured values of received power CS 515 Distance from Transmitter Received Power 100 m 0 d. Bm 500 m -5 d. Bm 1000 m -11 d. Bm 3000 m -16 d. Bm Ibrahim Korpeoglu 46
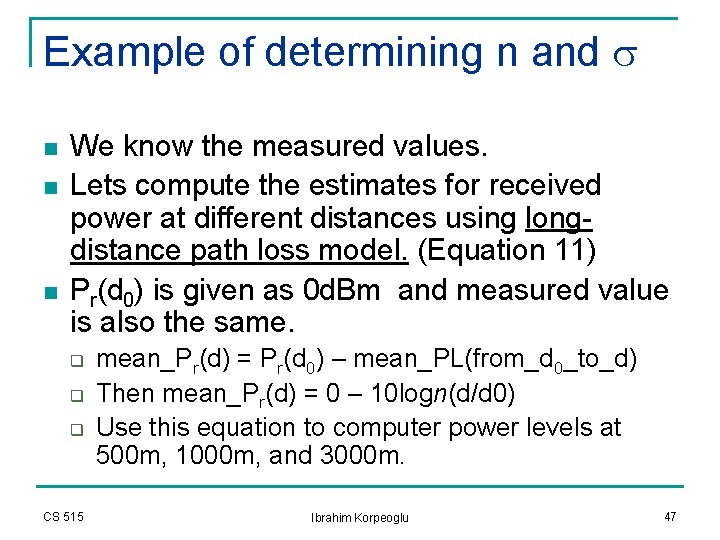
Example of determining n and s n n n We know the measured values. Lets compute the estimates for received power at different distances using longdistance path loss model. (Equation 11) Pr(d 0) is given as 0 d. Bm and measured value is also the same. q q q CS 515 mean_Pr(d) = Pr(d 0) – mean_PL(from_d 0_to_d) Then mean_Pr(d) = 0 – 10 logn(d/d 0) Use this equation to computer power levels at 500 m, 1000 m, and 3000 m. Ibrahim Korpeoglu 47
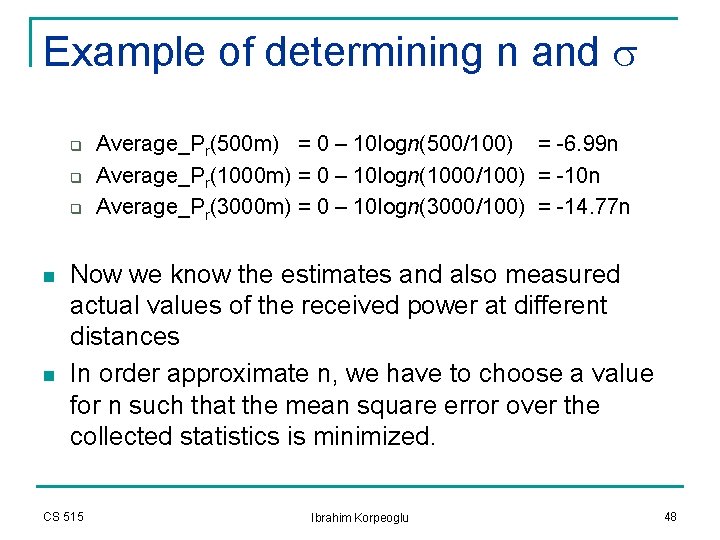
Example of determining n and s q q q n n Average_Pr(500 m) = 0 – 10 logn(500/100) = -6. 99 n Average_Pr(1000 m) = 0 – 10 logn(1000/100) = -10 n Average_Pr(3000 m) = 0 – 10 logn(3000/100) = -14. 77 n Now we know the estimates and also measured actual values of the received power at different distances In order approximate n, we have to choose a value for n such that the mean square error over the collected statistics is minimized. CS 515 Ibrahim Korpeoglu 48
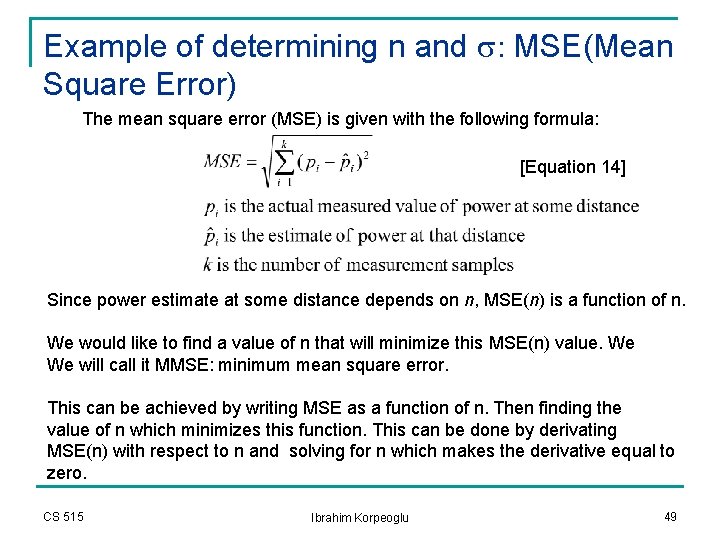
Example of determining n and s: MSE(Mean Square Error) The mean square error (MSE) is given with the following formula: [Equation 14] Since power estimate at some distance depends on n, MSE(n) is a function of n. We would like to find a value of n that will minimize this MSE(n) value. We We will call it MMSE: minimum mean square error. This can be achieved by writing MSE as a function of n. Then finding the value of n which minimizes this function. This can be done by derivating MSE(n) with respect to n and solving for n which makes the derivative equal to zero. CS 515 Ibrahim Korpeoglu 49
Example of determining n: Distance Measured Value of Pr (d. Bm) Estimated Value of Pr (d. Bm) 100 m 0 0 500 m -5 -6. 99 n 1000 m -11 -10 n 3000 m -16 -14. 77 n MSE = (0 -0)2 + (-5 -(-6. 99 n))2 + (-11 -(-10 n)2 + (-16 -(-14. 77 n)2 MSE = 0 + (6. 99 n – 5)2 + (10 n – 11)2 + (14. 77 n – 16)2 If we open this, we get MSE as a function of n which as second order polynomial. We can easily take its derivate and find the value of n which minimizes MSE. ( I will not show these steps, since they are trivial). CS 515 Ibrahim Korpeoglu 50
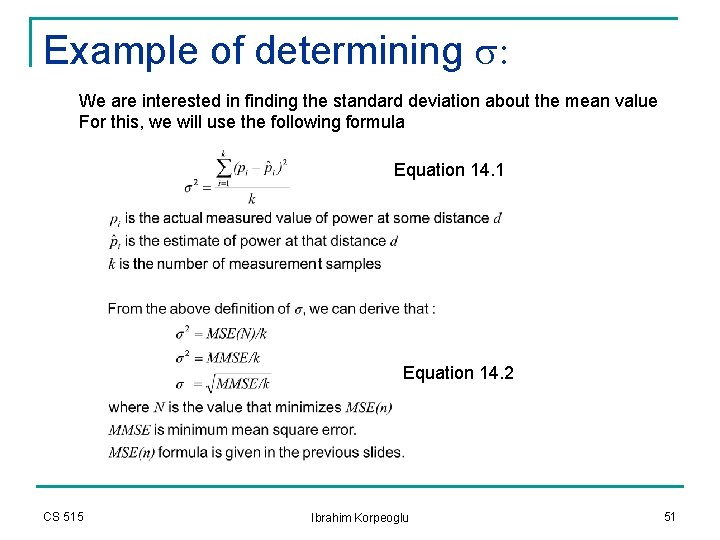
Example of determining s: We are interested in finding the standard deviation about the mean value For this, we will use the following formula Equation 14. 1 Equation 14. 2 CS 515 Ibrahim Korpeoglu 51
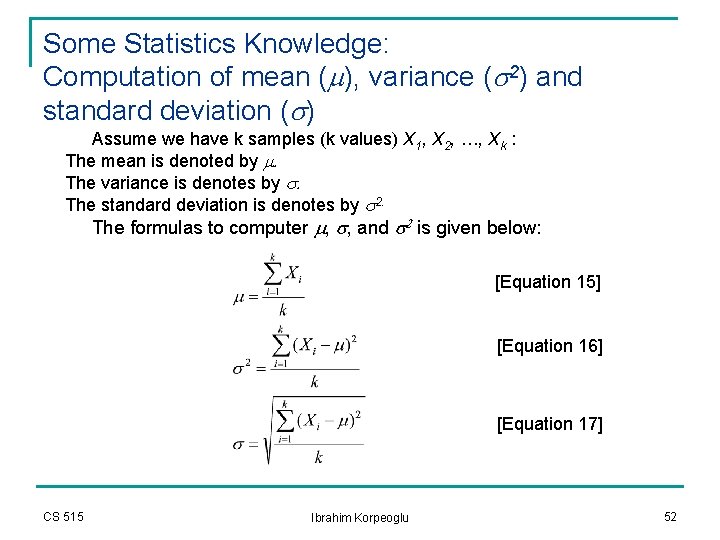
Some Statistics Knowledge: Computation of mean (m), variance (s 2) and standard deviation (s) Assume we have k samples (k values) X 1, X 2, …, Xk : The mean is denoted by m. The variance is denotes by s. The standard deviation is denotes by s 2. The formulas to computer m, s, and s 2 is given below: [Equation 15] [Equation 16] [Equation 17] CS 515 Ibrahim Korpeoglu 52
Path loss and Received Power n In log normal shadowing environment: n n PL(d) (path loss) and Pr(d) (received power at a distance d) are random variables with a normal distribution in d. B about a distance dependent mean. Sometime we are interested in answering following kind of questions: n n CS 515 What is mean received Pr(d) power (mean_Pr(d))at a distance d from a transmitter What is the probability that the receiver power Pr(d) (expressed in d. B power units) at distance d is above (or below) some fixed value g (again expressed in d. B power units such as d. Bm or d. BW). Ibrahim Korpeoglu 53
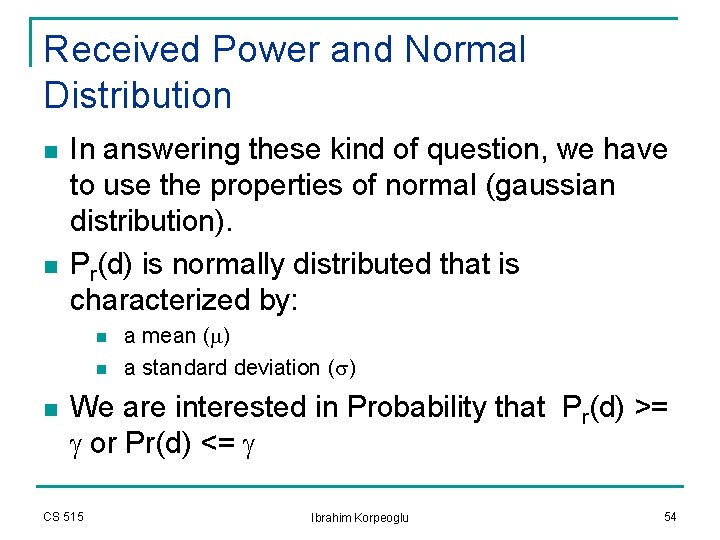
Received Power and Normal Distribution n n In answering these kind of question, we have to use the properties of normal (gaussian distribution). Pr(d) is normally distributed that is characterized by: n n n a mean (m) a standard deviation (s) We are interested in Probability that Pr(d) >= g or Pr(d) <= g CS 515 Ibrahim Korpeoglu 54
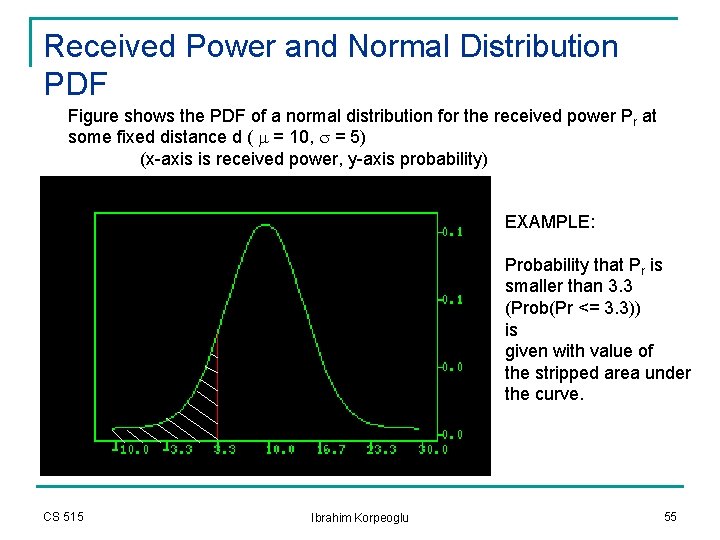
Received Power and Normal Distribution PDF Figure shows the PDF of a normal distribution for the received power Pr at some fixed distance d ( m = 10, s = 5) (x-axis is received power, y-axis probability) EXAMPLE: Probability that Pr is smaller than 3. 3 (Prob(Pr <= 3. 3)) is given with value of the stripped area under the curve. CS 515 Ibrahim Korpeoglu 55
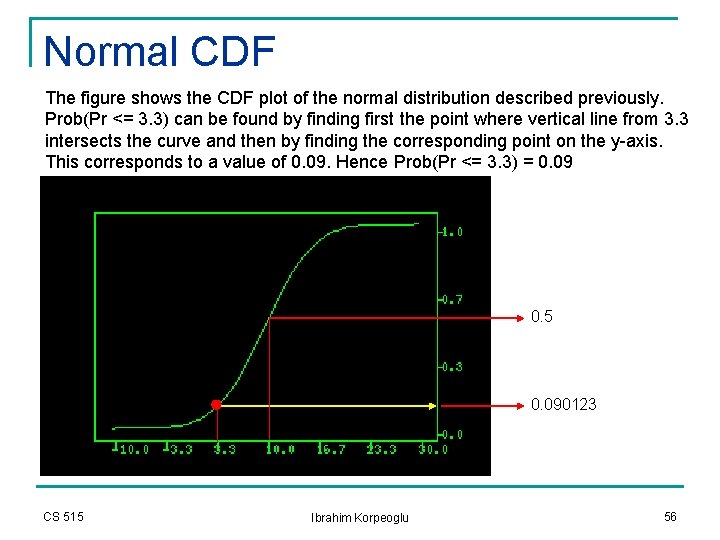
Normal CDF The figure shows the CDF plot of the normal distribution described previously. Prob(Pr <= 3. 3) can be found by finding first the point where vertical line from 3. 3 intersects the curve and then by finding the corresponding point on the y-axis. This corresponds to a value of 0. 09. Hence Prob(Pr <= 3. 3) = 0. 09 0. 5 0. 090123 CS 515 Ibrahim Korpeoglu 56
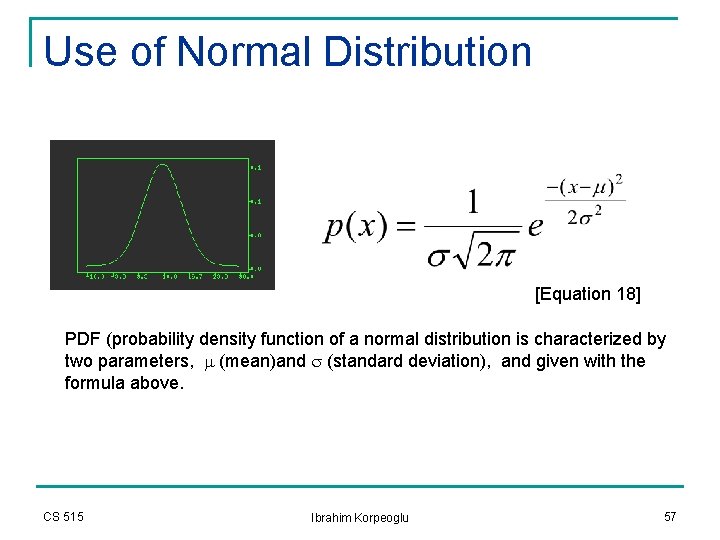
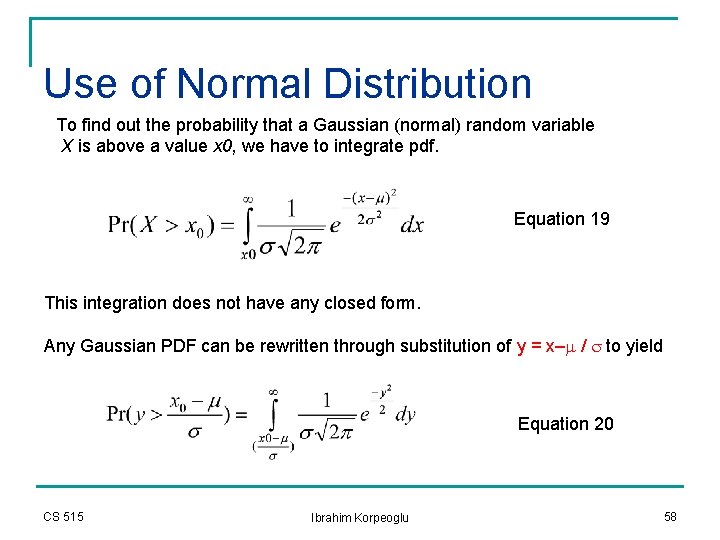
Use of Normal Distribution [Equation 18] PDF (probability density function of a normal distribution is characterized by two parameters, m (mean)and s (standard deviation), and given with the formula above. CS 515 Ibrahim Korpeoglu 57
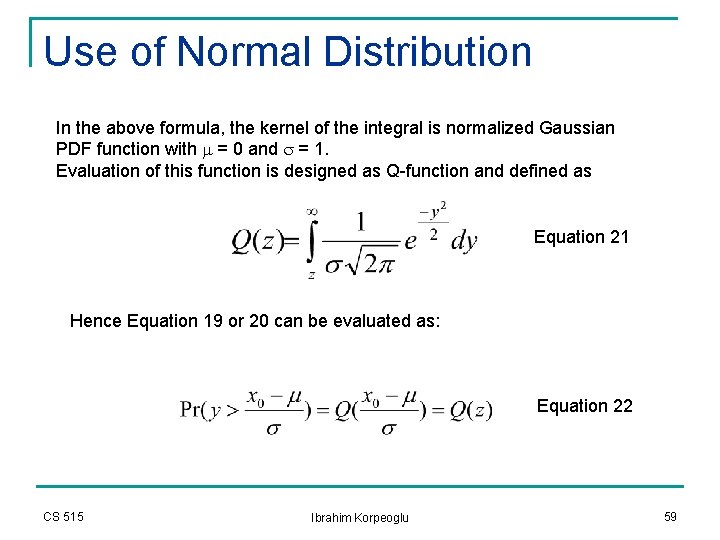
Use of Normal Distribution To find out the probability that a Gaussian (normal) random variable X is above a value x 0, we have to integrate pdf. Equation 19 This integration does not have any closed form. Any Gaussian PDF can be rewritten through substitution of y = x–m / s to yield Equation 20 CS 515 Ibrahim Korpeoglu 58
Use of Normal Distribution In the above formula, the kernel of the integral is normalized Gaussian PDF function with m = 0 and s = 1. Evaluation of this function is designed as Q-function and defined as Equation 21 Hence Equation 19 or 20 can be evaluated as: Equation 22 CS 515 Ibrahim Korpeoglu 59
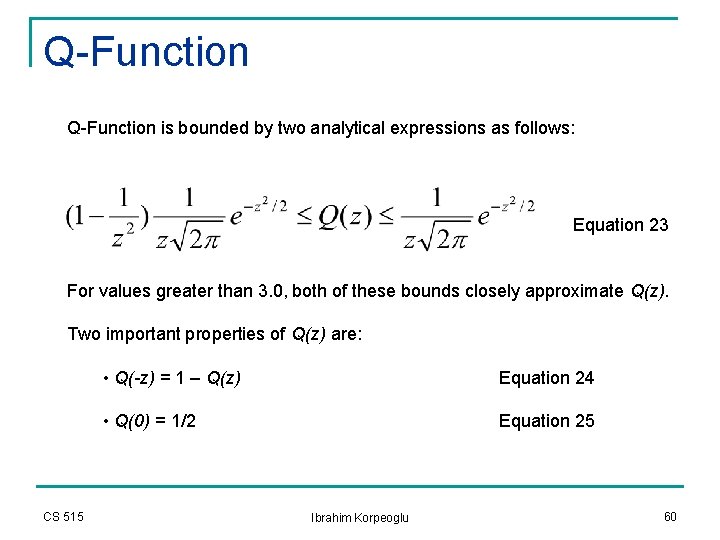
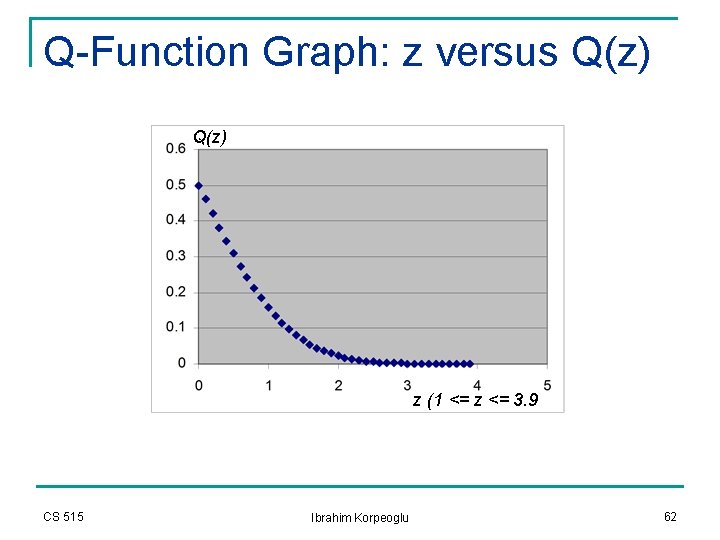
Q-Function is bounded by two analytical expressions as follows: Equation 23 For values greater than 3. 0, both of these bounds closely approximate Q(z). Two important properties of Q(z) are: CS 515 • Q(-z) = 1 – Q(z) Equation 24 • Q(0) = 1/2 Equation 25 Ibrahim Korpeoglu 60
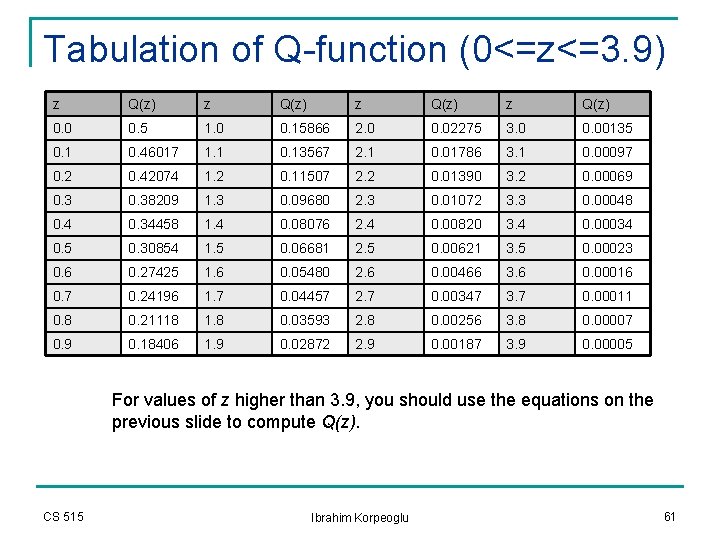
Tabulation of Q-function (0<=z<=3. 9) z Q(z) 0. 0 0. 5 1. 0 0. 15866 2. 0 0. 02275 3. 0 0. 00135 0. 1 0. 46017 1. 1 0. 13567 2. 1 0. 01786 3. 1 0. 00097 0. 2 0. 42074 1. 2 0. 11507 2. 2 0. 01390 3. 2 0. 00069 0. 38209 1. 3 0. 09680 2. 3 0. 01072 3. 3 0. 00048 0. 4 0. 34458 1. 4 0. 08076 2. 4 0. 00820 3. 4 0. 00034 0. 5 0. 30854 1. 5 0. 06681 2. 5 0. 00621 3. 5 0. 00023 0. 6 0. 27425 1. 6 0. 05480 2. 6 0. 00466 3. 6 0. 00016 0. 7 0. 24196 1. 7 0. 04457 2. 7 0. 00347 3. 7 0. 00011 0. 8 0. 21118 1. 8 0. 03593 2. 8 0. 00256 3. 8 0. 00007 0. 9 0. 18406 1. 9 0. 02872 2. 9 0. 00187 3. 9 0. 00005 For values of z higher than 3. 9, you should use the equations on the previous slide to compute Q(z). CS 515 Ibrahim Korpeoglu 61
Q-Function Graph: z versus Q(z) z (1 <= z <= 3. 9 CS 515 Ibrahim Korpeoglu 62
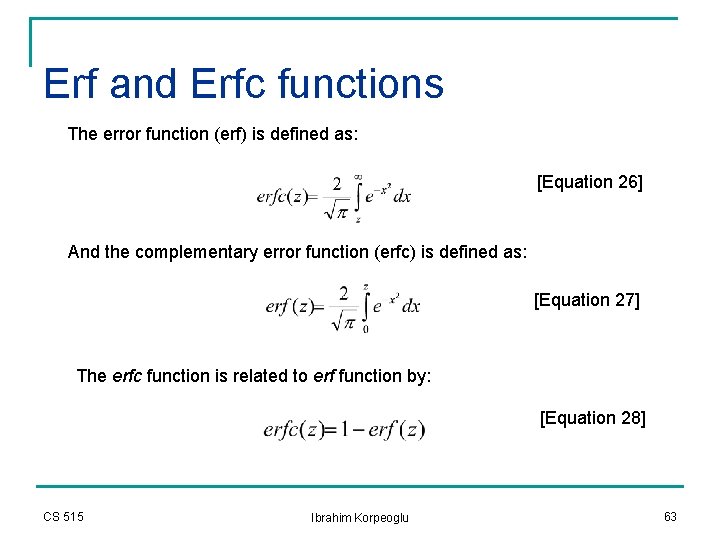
Erf and Erfc functions The error function (erf) is defined as: [Equation 26] And the complementary error function (erfc) is defined as: [Equation 27] The erfc function is related to erf function by: [Equation 28] CS 515 Ibrahim Korpeoglu 63
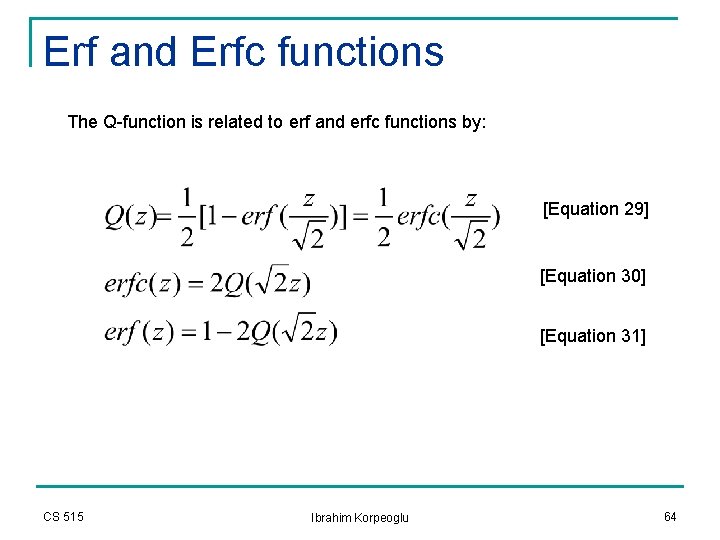
Erf and Erfc functions The Q-function is related to erf and erfc functions by: [Equation 29] [Equation 30] [Equation 31] CS 515 Ibrahim Korpeoglu 64
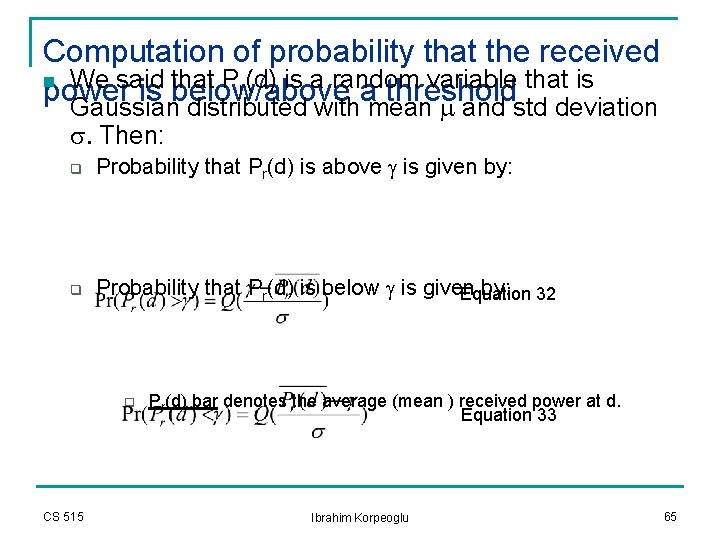
Computation of probability that the received n We said that Pr(d) is a random variable that is power is below/above a threshold Gaussian distributed with mean m and std deviation s. Then: q Probability that Pr(d) is above g is given by: q Probability that Pr(d) is below g is given by: 32 Equation q CS 515 Pr(d) bar denotes the average (mean ) received power at d. Equation 33 Ibrahim Korpeoglu 65
Percentage of Coverage Area n We are interested in the following problem n n q Given a circular coverage area with radius R from a base station Given a desired threshold power level. Find out n U(g), the percentage of useful service area q CS 515 i. e the percentage of area with a received signal that is equal or greater than g, given a known likelihood of coverage at the cell boundary Ibrahim Korpeoglu 66
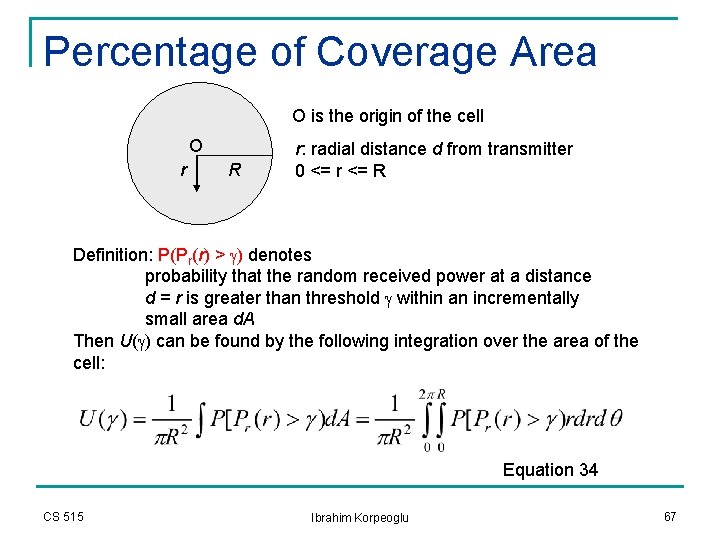
Percentage of Coverage Area O is the origin of the cell O r R r: radial distance d from transmitter 0 <= r <= R Definition: P(Pr(r) > g) denotes probability that the random received power at a distance d = r is greater than threshold g within an incrementally small area d. A Then U(g) can be found by the following integration over the area of the cell: Equation 34 CS 515 Ibrahim Korpeoglu 67
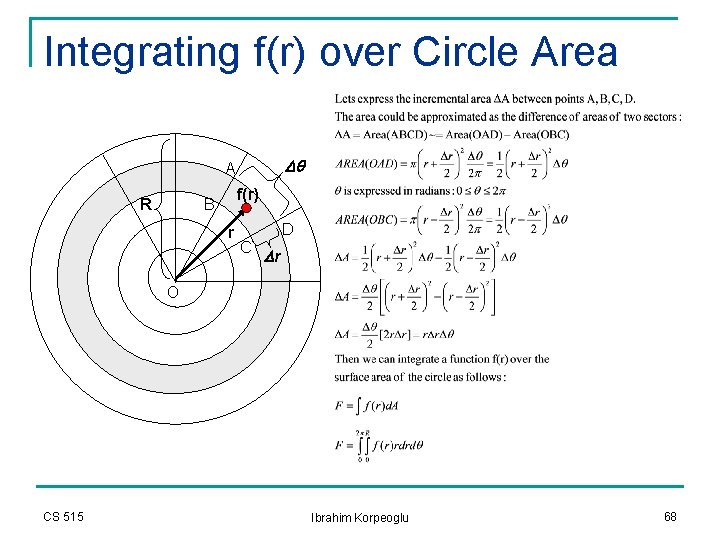
Integrating f(r) over Circle Area Dq A R f(r) B r D C Dr O CS 515 Ibrahim Korpeoglu 68
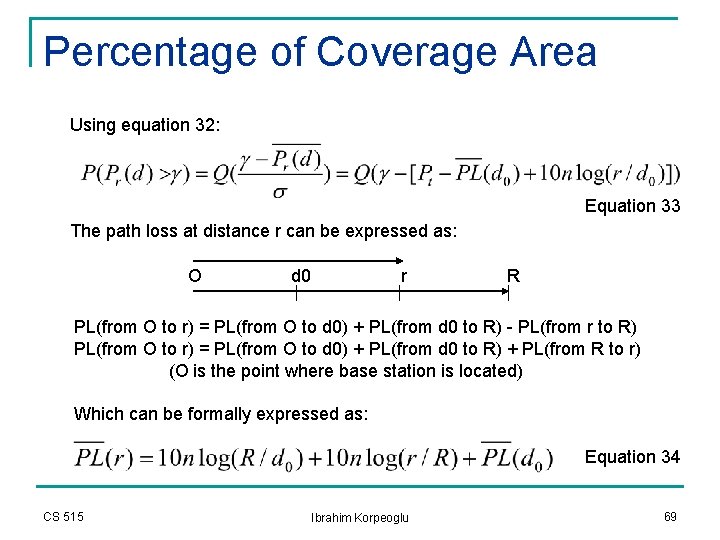
Percentage of Coverage Area Using equation 32: Equation 33 The path loss at distance r can be expressed as: O d 0 r R PL(from O to r) = PL(from O to d 0) + PL(from d 0 to R) - PL(from r to R) PL(from O to r) = PL(from O to d 0) + PL(from d 0 to R) + PL(from R to r) (O is the point where base station is located) Which can be formally expressed as: Equation 34 CS 515 Ibrahim Korpeoglu 69
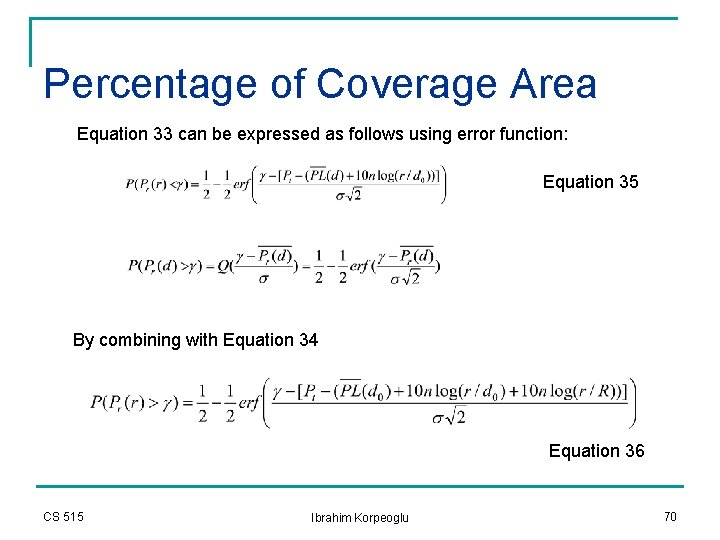
Percentage of Coverage Area Equation 33 can be expressed as follows using error function: Equation 35 By combining with Equation 34 Equation 36 CS 515 Ibrahim Korpeoglu 70
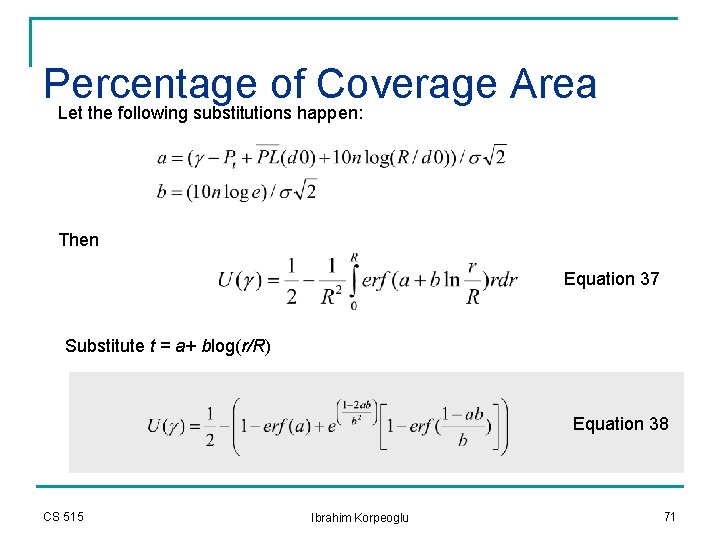
Percentage of Coverage Area Let the following substitutions happen: Then Equation 37 Substitute t = a+ blog(r/R) Equation 38 CS 515 Ibrahim Korpeoglu 71
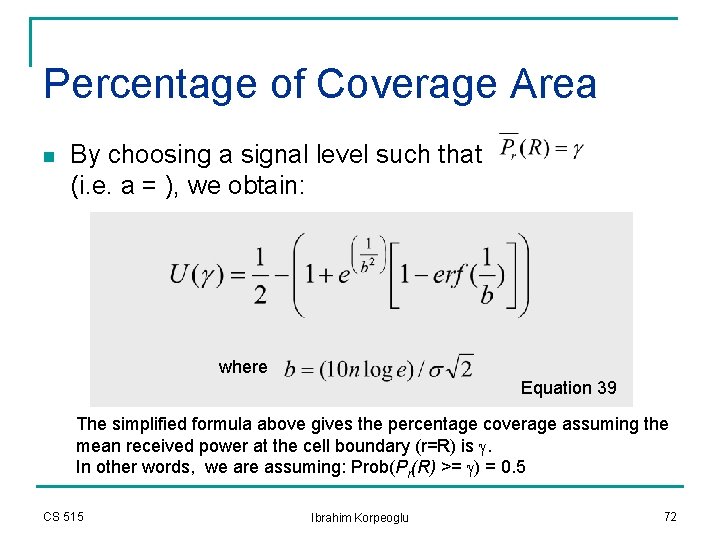
Percentage of Coverage Area n By choosing a signal level such that (i. e. a = ), we obtain: where Equation 39 The simplified formula above gives the percentage coverage assuming the mean received power at the cell boundary (r=R) is g. In other words, we are assuming: Prob(Pr(R) >= g) = 0. 5 CS 515 Ibrahim Korpeoglu 72
Indoor and Outdoor Propagation
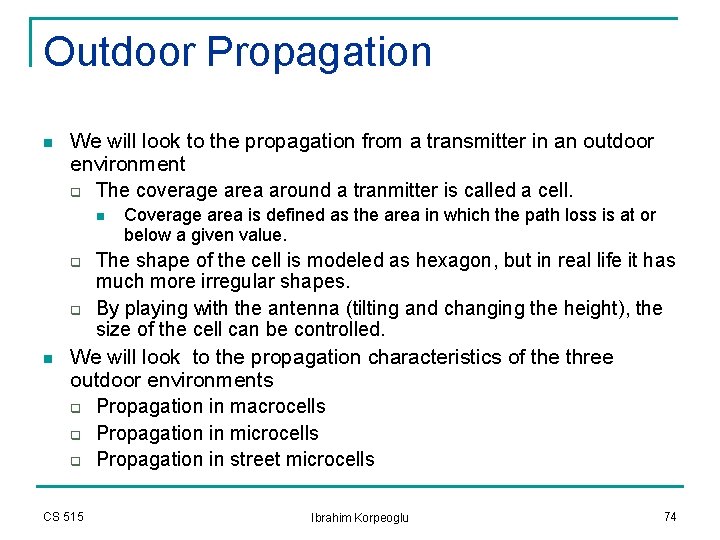
Outdoor Propagation n We will look to the propagation from a transmitter in an outdoor environment q The coverage area around a tranmitter is called a cell. n q q n Coverage area is defined as the area in which the path loss is at or below a given value. The shape of the cell is modeled as hexagon, but in real life it has much more irregular shapes. By playing with the antenna (tilting and changing the height), the size of the cell can be controlled. We will look to the propagation characteristics of the three outdoor environments q Propagation in macrocells q Propagation in microcells q Propagation in street microcells CS 515 Ibrahim Korpeoglu 74
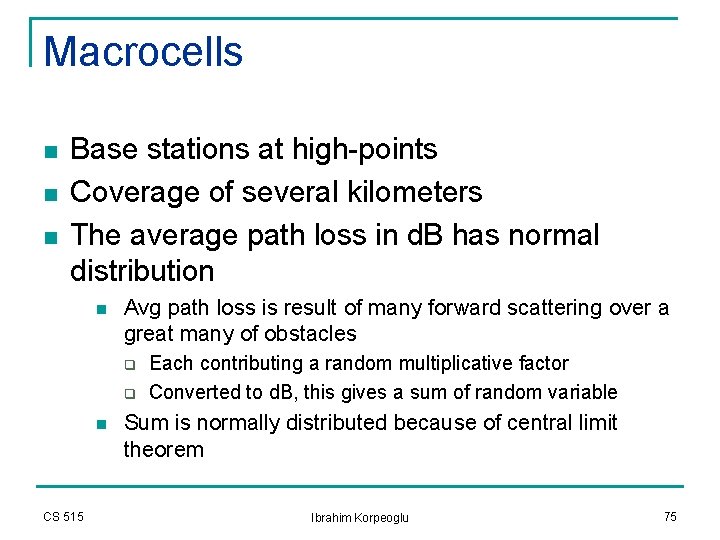
Macrocells n n n Base stations at high-points Coverage of several kilometers The average path loss in d. B has normal distribution n Avg path loss is result of many forward scattering over a great many of obstacles q q n CS 515 Each contributing a random multiplicative factor Converted to d. B, this gives a sum of random variable Sum is normally distributed because of central limit theorem Ibrahim Korpeoglu 75
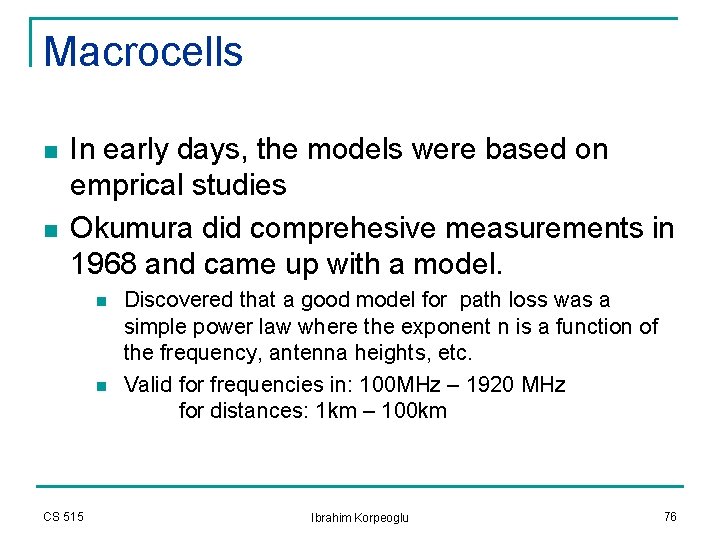
Macrocells n n In early days, the models were based on emprical studies Okumura did comprehesive measurements in 1968 and came up with a model. n n CS 515 Discovered that a good model for path loss was a simple power law where the exponent n is a function of the frequency, antenna heights, etc. Valid for frequencies in: 100 MHz – 1920 MHz for distances: 1 km – 100 km Ibrahim Korpeoglu 76
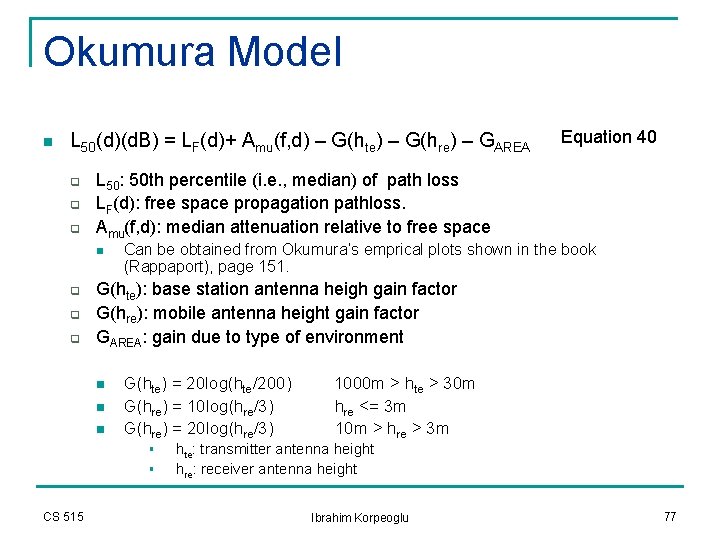
Okumura Model n L 50(d)(d. B) = LF(d)+ Amu(f, d) – G(hte) – G(hre) – GAREA q q q L 50: 50 th percentile (i. e. , median) of path loss LF(d): free space propagation pathloss. Amu(f, d): median attenuation relative to free space n q q q Can be obtained from Okumura’s emprical plots shown in the book (Rappaport), page 151. G(hte): base station antenna heigh gain factor G(hre): mobile antenna height gain factor GAREA: gain due to type of environment n n n G(hte) = 20 log(hte/200) G(hre) = 10 log(hre/3) G(hre) = 20 log(hre/3) § § CS 515 Equation 40 1000 m > hte > 30 m hre <= 3 m 10 m > hre > 3 m hte: transmitter antenna height hre: receiver antenna height Ibrahim Korpeoglu 77
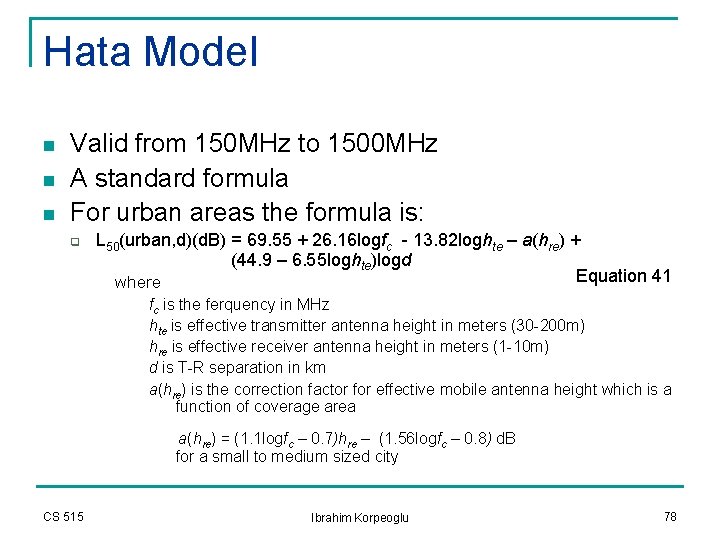
Hata Model n n n Valid from 150 MHz to 1500 MHz A standard formula For urban areas the formula is: q L 50(urban, d)(d. B) = 69. 55 + 26. 16 logfc - 13. 82 loghte – a(hre) + (44. 9 – 6. 55 loghte)logd Equation 41 where fc is the ferquency in MHz hte is effective transmitter antenna height in meters (30 -200 m) hre is effective receiver antenna height in meters (1 -10 m) d is T-R separation in km a(hre) is the correction factor for effective mobile antenna height which is a function of coverage area a(hre) = (1. 1 logfc – 0. 7)hre – (1. 56 logfc – 0. 8) d. B for a small to medium sized city CS 515 Ibrahim Korpeoglu 78
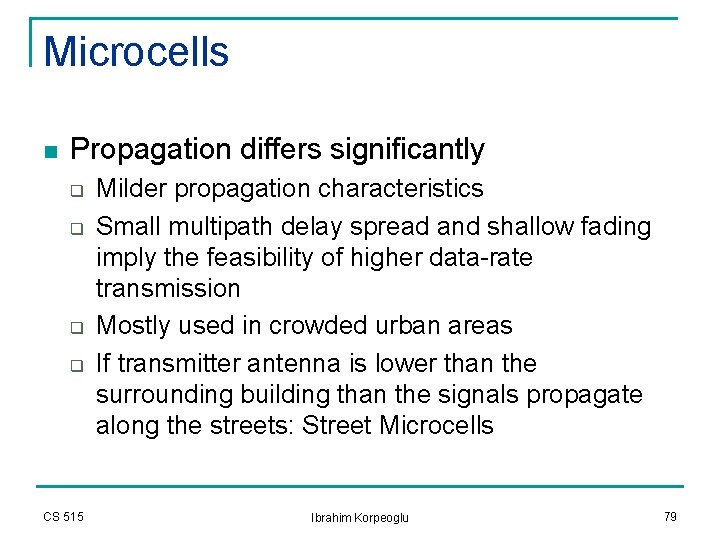
Microcells n Propagation differs significantly q q CS 515 Milder propagation characteristics Small multipath delay spread and shallow fading imply the feasibility of higher data-rate transmission Mostly used in crowded urban areas If transmitter antenna is lower than the surrounding building than the signals propagate along the streets: Street Microcells Ibrahim Korpeoglu 79
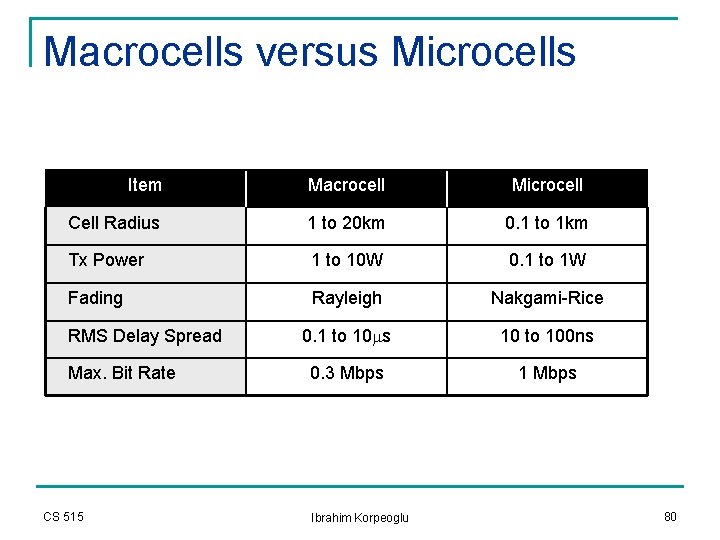
Macrocells versus Microcells Item Macrocell Microcell Cell Radius 1 to 20 km 0. 1 to 1 km Tx Power 1 to 10 W 0. 1 to 1 W Fading Rayleigh Nakgami-Rice 0. 1 to 10 ms 10 to 100 ns 0. 3 Mbps 1 Mbps RMS Delay Spread Max. Bit Rate CS 515 Ibrahim Korpeoglu 80
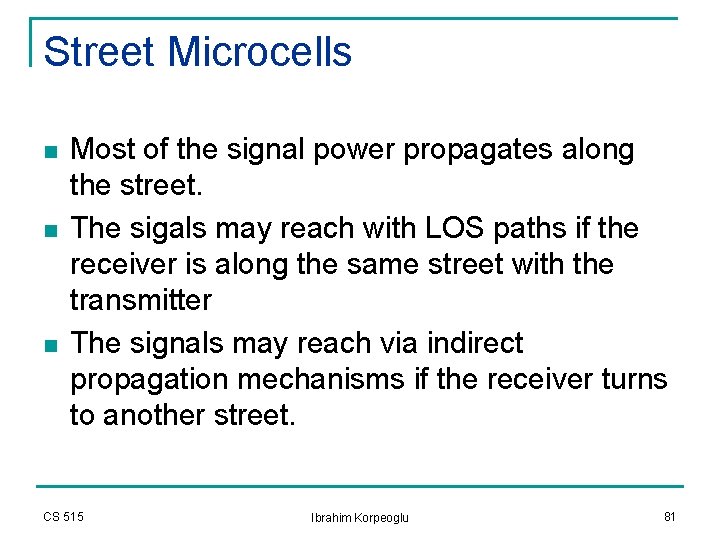
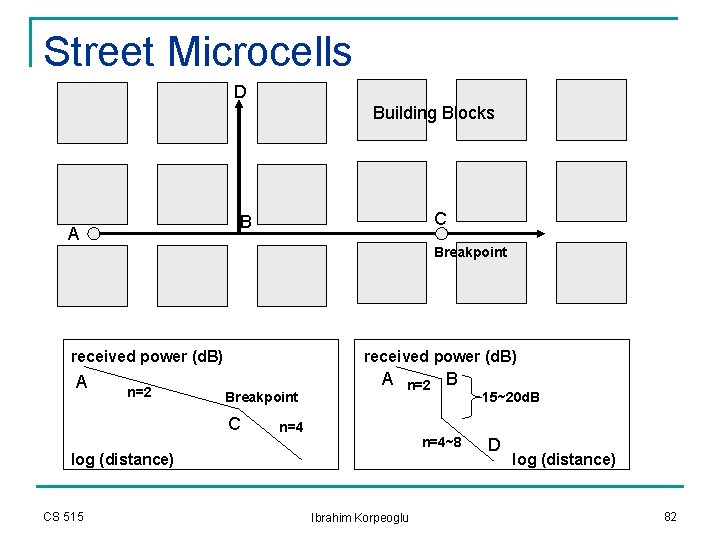
Street Microcells n n n Most of the signal power propagates along the street. The sigals may reach with LOS paths if the receiver is along the same street with the transmitter The signals may reach via indirect propagation mechanisms if the receiver turns to another street. CS 515 Ibrahim Korpeoglu 81
Street Microcells D Building Blocks C B A Breakpoint received power (d. B) A n=2 received power (d. B) A Breakpoint C n=2 n=4~8 log (distance) CS 515 B Ibrahim Korpeoglu 15~20 d. B D log (distance) 82
Indoor Propagation n Indoor channels are different from traditional mobile radio channels in two different ways: n n n The distances covered are much smaller The variablity of the environment is much greater for a much smaller range of T-R separation distances. The propagation inside a building is influenced by: n n n CS 515 Layout of the building Construction materials Building type: sports arena, residential home, factory, . . . Ibrahim Korpeoglu 83
Indoor Propagation n Indoor propagation is domited by the same mechanisms as outdoor: reflection, scattering, diffraction. q However, conditions are much more variable n n Doors/windows open or not The mounting place of antenna: desk, ceiling, etc. The level of floors Indoor channels are classified as q q CS 515 Line-of-sight (LOS) Obstructed (OBS) with varying degrees of clutter. Ibrahim Korpeoglu 84
Indoor Propagation n Buiding types n n n n CS 515 Residential homes in suburban areas Residential homes in urban areas Traditional office buildings with fixed walls (hard partitions) Open plan buildings with movable wall panels (soft partitions) Factory buildings Grocery stores Retail stores Sport arenas Ibrahim Korpeoglu 85
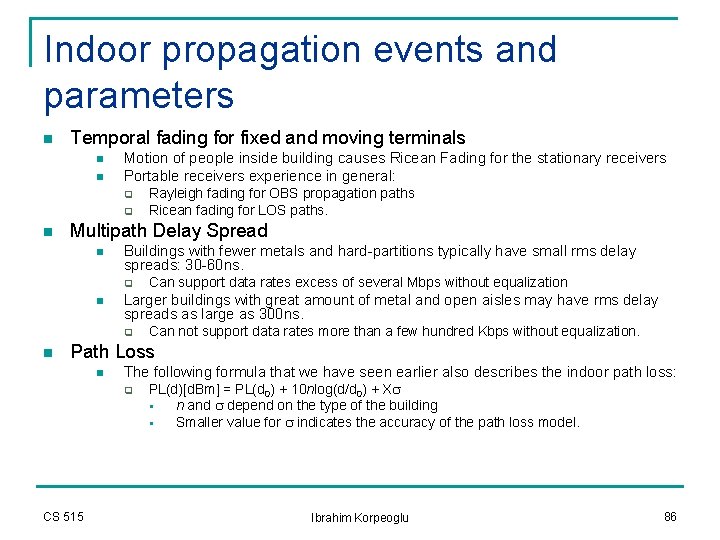
Indoor propagation events and parameters n Temporal fading for fixed and moving terminals n n Motion of people inside building causes Ricean Fading for the stationary receivers Portable receivers experience in general: q q n Multipath Delay Spread n Buildings with fewer metals and hard-partitions typically have small rms delay spreads: 30 -60 ns. q n Can support data rates excess of several Mbps without equalization Larger buildings with great amount of metal and open aisles may have rms delay spreads as large as 300 ns. q n Rayleigh fading for OBS propagation paths Ricean fading for LOS paths. Can not support data rates more than a few hundred Kbps without equalization. Path Loss n The following formula that we have seen earlier also describes the indoor path loss: q CS 515 PL(d)[d. Bm] = PL(d 0) + 10 nlog(d/d 0) + Xs § n and s depend on the type of the building § Smaller value for s indicates the accuracy of the path loss model. Ibrahim Korpeoglu 86
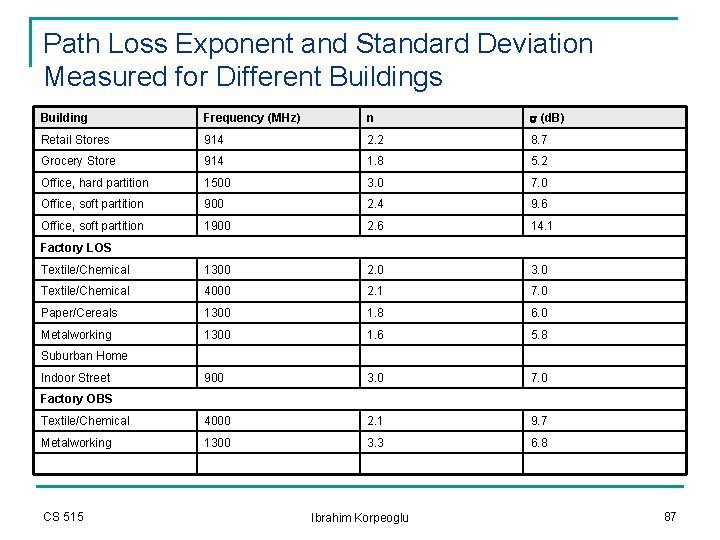
Path Loss Exponent and Standard Deviation Measured for Different Buildings Building Frequency (MHz) n s (d. B) Retail Stores 914 2. 2 8. 7 Grocery Store 914 1. 8 5. 2 Office, hard partition 1500 3. 0 7. 0 Office, soft partition 900 2. 4 9. 6 Office, soft partition 1900 2. 6 14. 1 Textile/Chemical 1300 2. 0 3. 0 Textile/Chemical 4000 2. 1 7. 0 Paper/Cereals 1300 1. 8 6. 0 Metalworking 1300 1. 6 5. 8 900 3. 0 7. 0 Textile/Chemical 4000 2. 1 9. 7 Metalworking 1300 3. 3 6. 8 Factory LOS Suburban Home Indoor Street Factory OBS CS 515 Ibrahim Korpeoglu 87
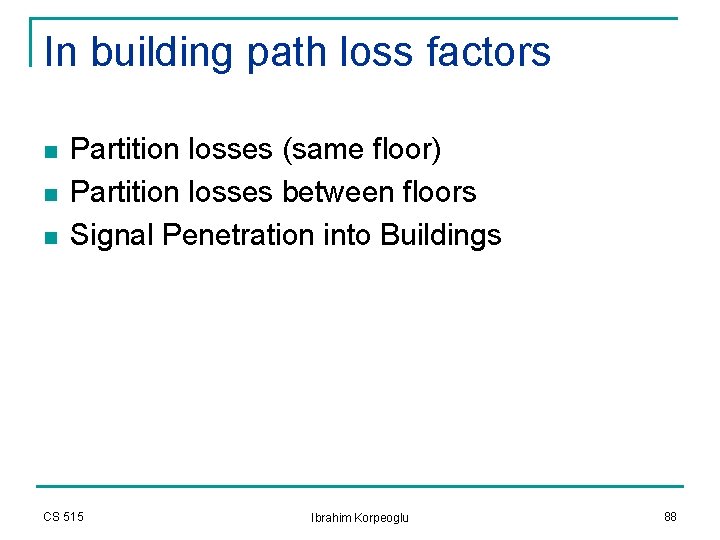
In building path loss factors n n n Partition losses (same floor) Partition losses between floors Signal Penetration into Buildings CS 515 Ibrahim Korpeoglu 88
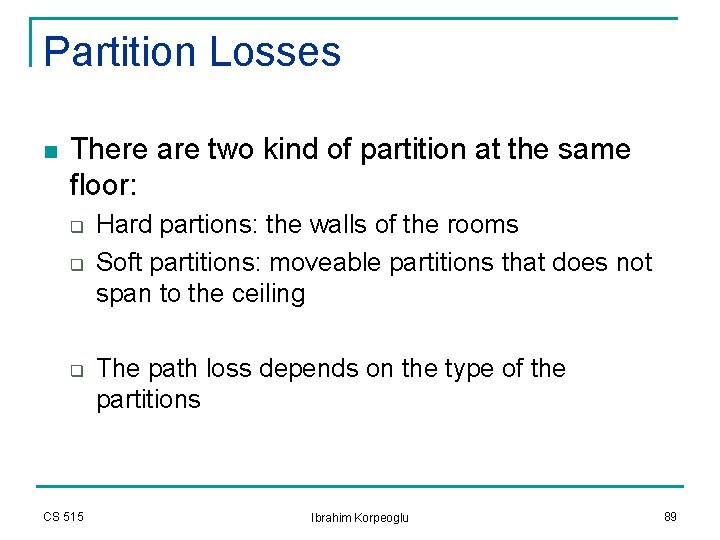
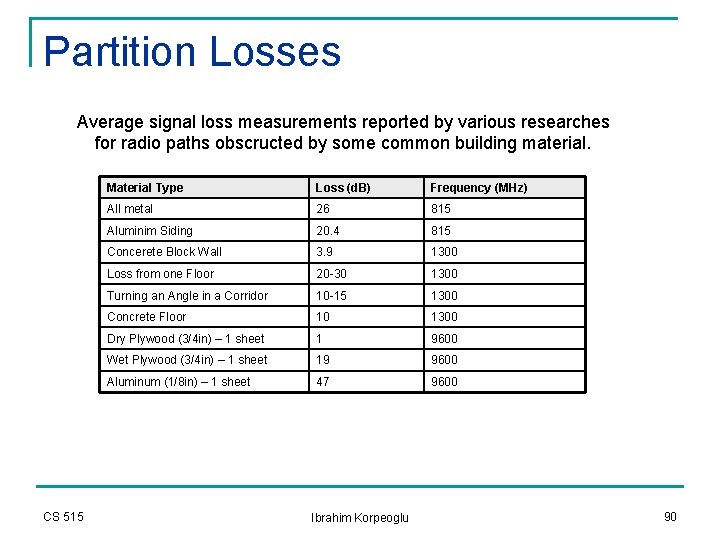
Partition Losses n There are two kind of partition at the same floor: q q q CS 515 Hard partions: the walls of the rooms Soft partitions: moveable partitions that does not span to the ceiling The path loss depends on the type of the partitions Ibrahim Korpeoglu 89
Partition Losses Average signal loss measurements reported by various researches for radio paths obscructed by some common building material. CS 515 Material Type Loss (d. B) Frequency (MHz) All metal 26 815 Aluminim Siding 20. 4 815 Concerete Block Wall 3. 9 1300 Loss from one Floor 20 -30 1300 Turning an Angle in a Corridor 10 -15 1300 Concrete Floor 10 1300 Dry Plywood (3/4 in) – 1 sheet 1 9600 Wet Plywood (3/4 in) – 1 sheet 19 9600 Aluminum (1/8 in) – 1 sheet 47 9600 Ibrahim Korpeoglu 90
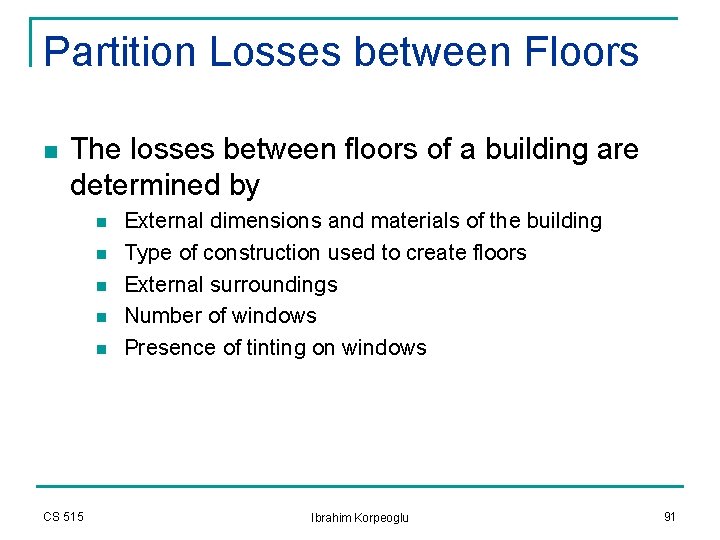
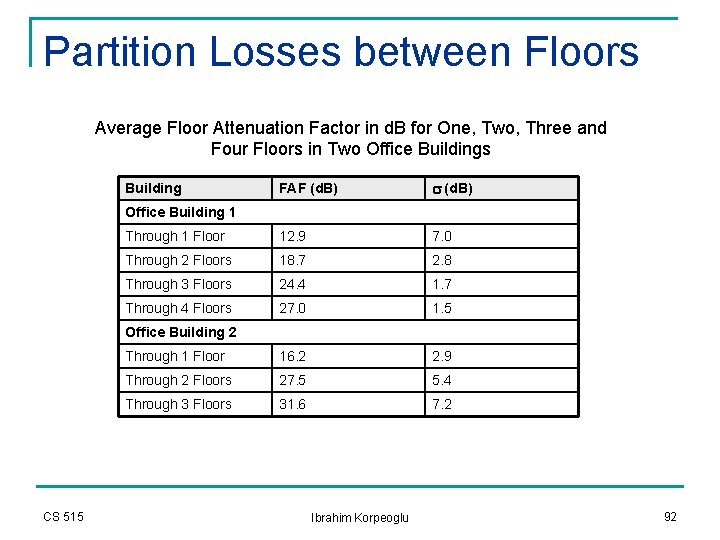
Partition Losses between Floors n The losses between floors of a building are determined by n n n CS 515 External dimensions and materials of the building Type of construction used to create floors External surroundings Number of windows Presence of tinting on windows Ibrahim Korpeoglu 91
Partition Losses between Floors Average Floor Attenuation Factor in d. B for One, Two, Three and Four Floors in Two Office Buildings FAF (d. B) s (d. B) Through 1 Floor 12. 9 7. 0 Through 2 Floors 18. 7 2. 8 Through 3 Floors 24. 4 1. 7 Through 4 Floors 27. 0 1. 5 Through 1 Floor 16. 2 2. 9 Through 2 Floors 27. 5 5. 4 Through 3 Floors 31. 6 7. 2 Building Office Building 1 Office Building 2 CS 515 Ibrahim Korpeoglu 92
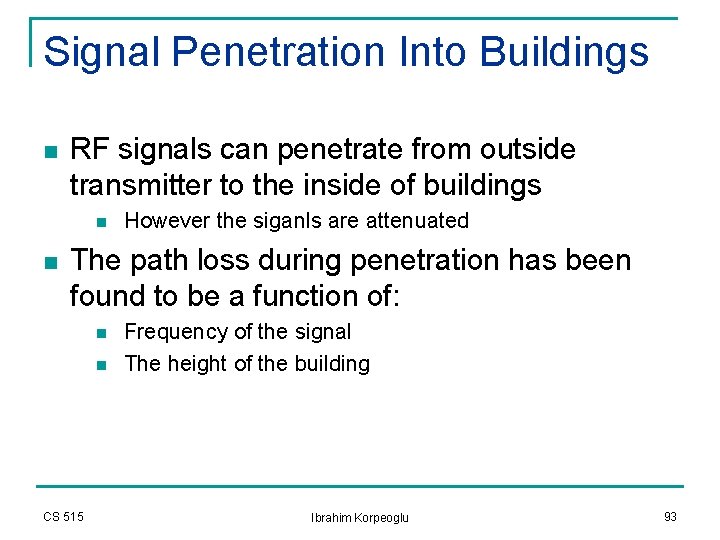
Signal Penetration Into Buildings n RF signals can penetrate from outside transmitter to the inside of buildings n n However the siganls are attenuated The path loss during penetration has been found to be a function of: n n CS 515 Frequency of the signal The height of the building Ibrahim Korpeoglu 93
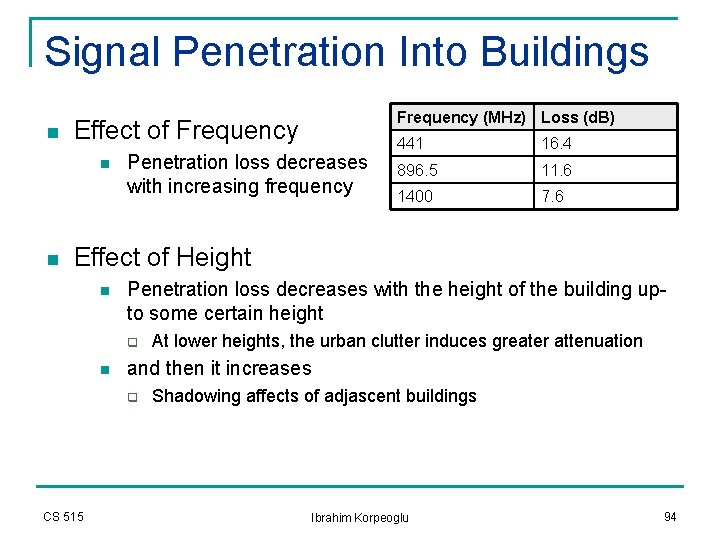
Signal Penetration Into Buildings n Effect of Frequency n n Frequency (MHz) Loss (d. B) Penetration loss decreases with increasing frequency 441 16. 4 896. 5 11. 6 1400 7. 6 Effect of Height n Penetration loss decreases with the height of the building upto some certain height q n and then it increases q CS 515 At lower heights, the urban clutter induces greater attenuation Shadowing affects of adjascent buildings Ibrahim Korpeoglu 94
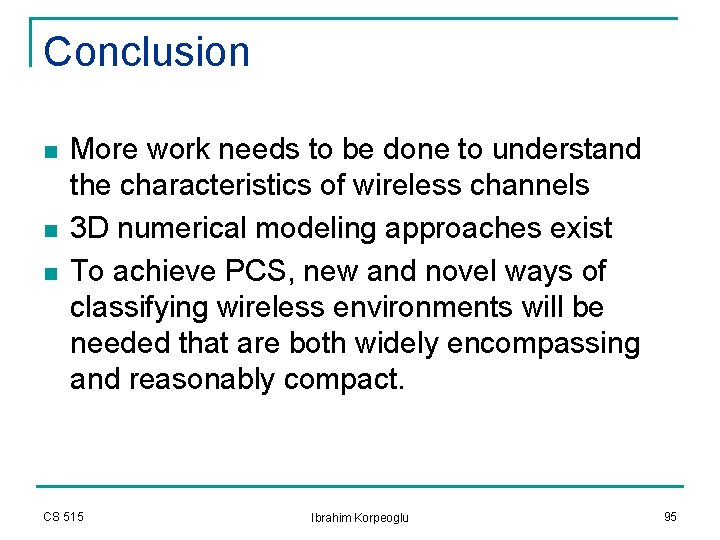
Conclusion n More work needs to be done to understand the characteristics of wireless channels 3 D numerical modeling approaches exist To achieve PCS, new and novel ways of classifying wireless environments will be needed that are both widely encompassing and reasonably compact. CS 515 Ibrahim Korpeoglu 95