
Radiation dosimetry for animals and plants Jordi Vives



- Slides: 48
Radiation dosimetry for animals and plants Jordi Vives i Batlle Centre for Ecology and Hydrology, Lancaster, 1 st – 3 rd April 2014 www. ceh. ac. uk/PROTECT
Lecture plan ¥ Key concepts ¥ ¥ ERICA approach to absorbed fraction calculation ¥ ¥ ¥ Reference habitats, organisms and shapes, Monte Carlo approach, sphericity, dependence with energy / size ERICA DCCs for internal and external exposure ¥ ¥ Radioactivity, kerma, absorbed dose, units, radiation weighting factor, absorbed fraction, dose conversion coefficient (DCC) Internal and external DCC formulae, energy / size dependency, allometric scaling Comparing ERICA with other tools Special cases ¥ Gases, inhomogeneous sources, non-equilibrium www. radioecology-exchange. org
Introduction www. radioecology-exchange. org
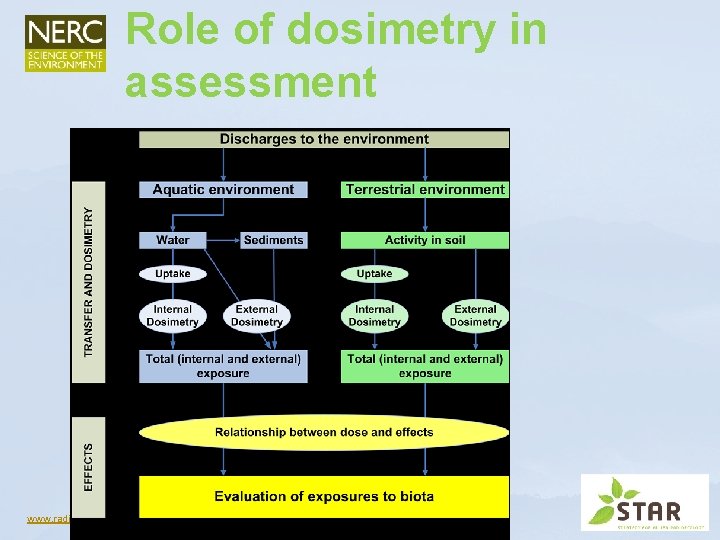
Role of dosimetry in assessment www. radioecology-exchange. org
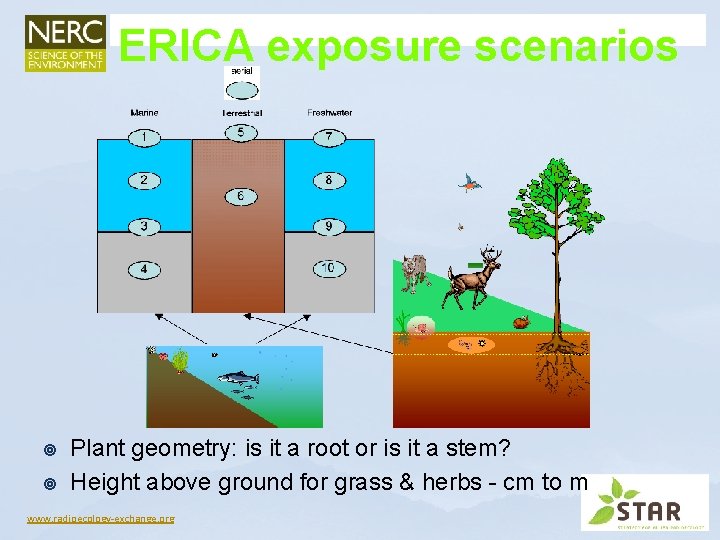
ERICA exposure scenarios ¥ ¥ Plant geometry: is it a root or is it a stem? Height above ground for grass & herbs - cm to m www. radioecology-exchange. org
Key concepts www. radioecology-exchange. org
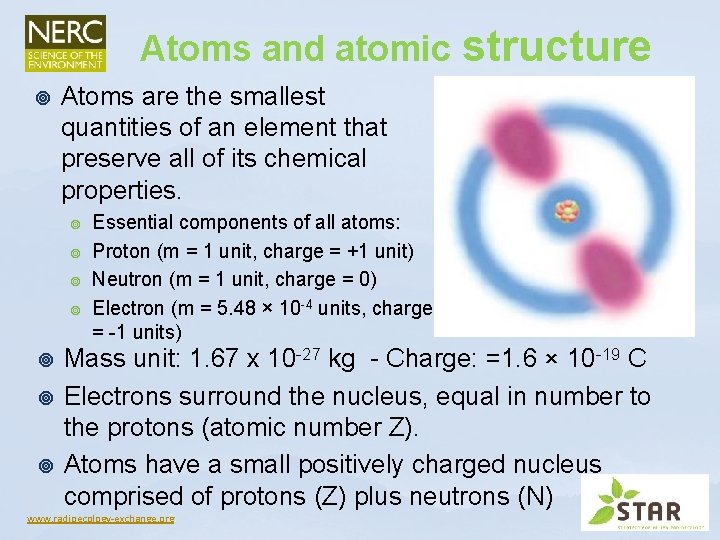
Atoms and atomic structure ¥ Atoms are the smallest quantities of an element that preserve all of its chemical properties. ¥ ¥ ¥ ¥ Essential components of all atoms: Proton (m = 1 unit, charge = +1 unit) Neutron (m = 1 unit, charge = 0) Electron (m = 5. 48 × 10 -4 units, charge = -1 units) Mass unit: 1. 67 x 10 -27 kg - Charge: =1. 6 × 10 -19 C Electrons surround the nucleus, equal in number to the protons (atomic number Z). Atoms have a small positively charged nucleus comprised of protons (Z) plus neutrons (N) www. radioecology-exchange. org
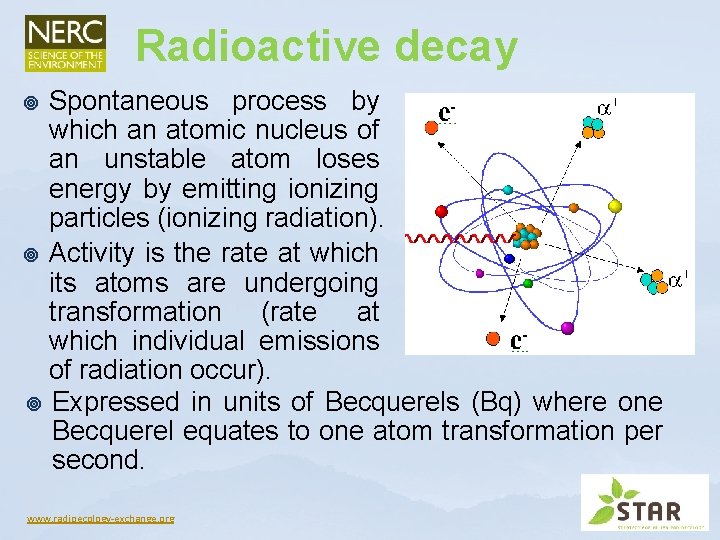
Radioactive decay Spontaneous process by which an atomic nucleus of an unstable atom loses energy by emitting ionizing particles (ionizing radiation). ¥ Activity is the rate at which its atoms are undergoing transformation (rate at which individual emissions of radiation occur). ¥ Expressed in units of Becquerels (Bq) where one Becquerel equates to one atom transformation per second. ¥ www. radioecology-exchange. org
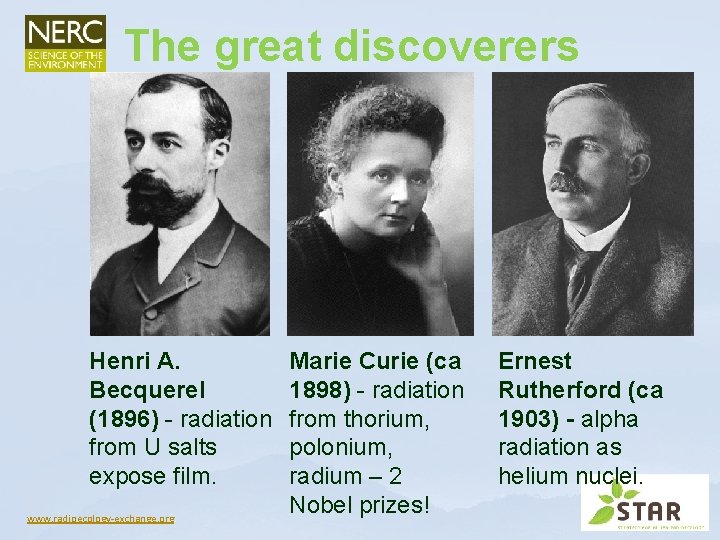
The great discoverers Henri A. Becquerel (1896) - radiation from U salts expose film. www. radioecology-exchange. org Marie Curie (ca 1898) - radiation from thorium, polonium, radium – 2 Nobel prizes! Ernest Rutherford (ca 1903) - alpha radiation as helium nuclei.
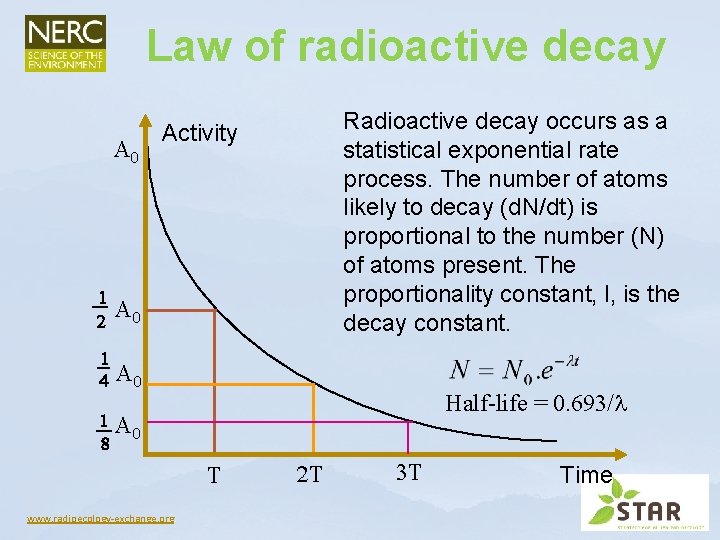
Law of radioactive decay Radioactive decay occurs as a statistical exponential rate process. The number of atoms likely to decay (d. N/dt) is proportional to the number (N) of atoms present. The proportionality constant, l, is the decay constant. Activity Half-life = 0. 693/ www. radioecology-exchange. org Time
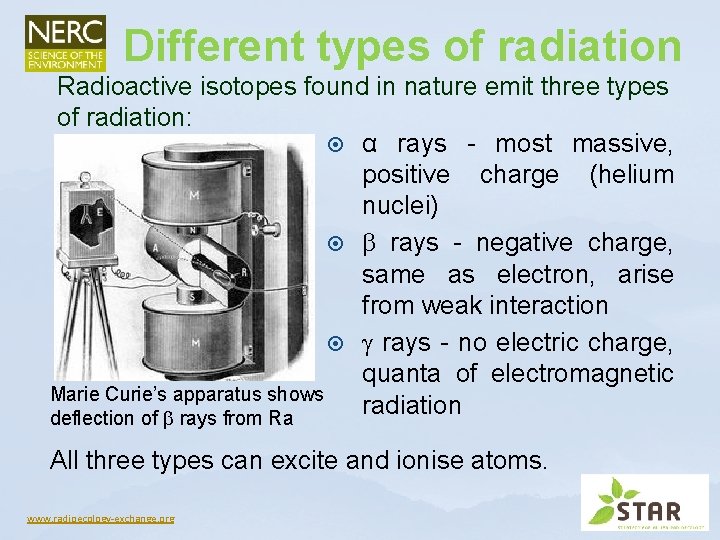
Different types of radiation Radioactive isotopes found in nature emit three types of radiation: α rays - most massive, positive charge (helium nuclei) rays - negative charge, same as electron, arise from weak interaction rays - no electric charge, quanta of electromagnetic Marie Curie’s apparatus shows radiation deflection of rays from Ra All three types can excite and ionise atoms. www. radioecology-exchange. org
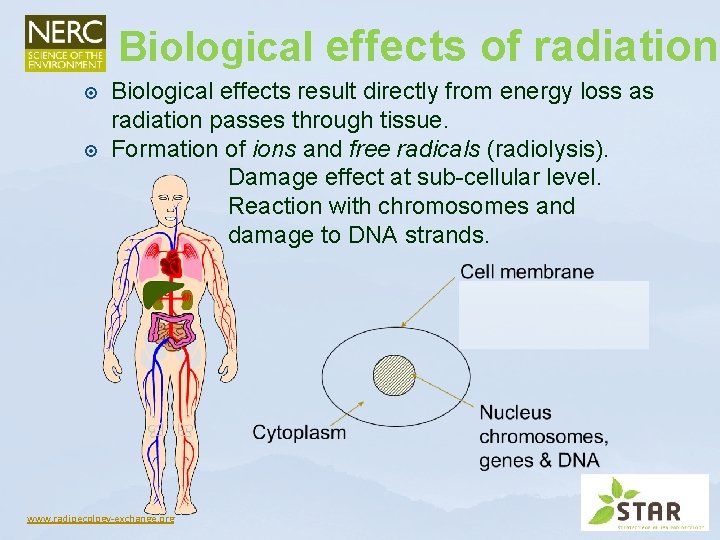
Biological effects of radiation Biological effects result directly from energy loss as radiation passes through tissue. Formation of ions and free radicals (radiolysis). Damage effect at sub-cellular level. Reaction with chromosomes and damage to DNA strands. www. radioecology-exchange. org
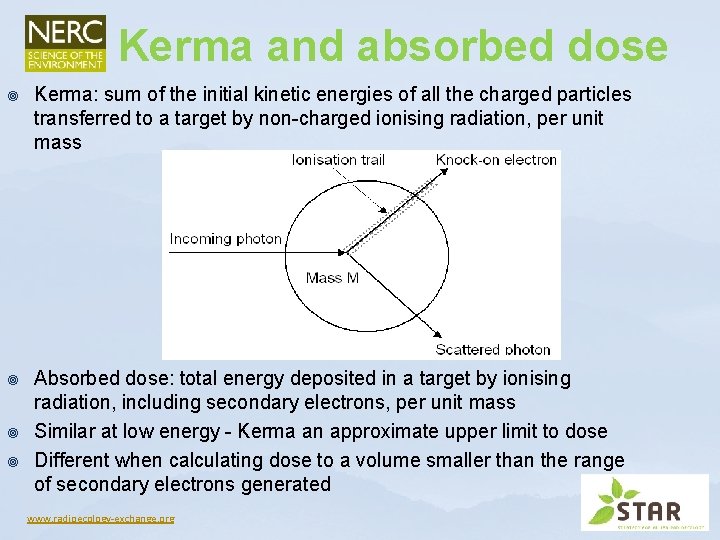
Kerma and absorbed dose ¥ Kerma: sum of the initial kinetic energies of all the charged particles transferred to a target by non-charged ionising radiation, per unit mass ¥ Absorbed dose: total energy deposited in a target by ionising radiation, including secondary electrons, per unit mass Similar at low energy - Kerma an approximate upper limit to dose Different when calculating dose to a volume smaller than the range of secondary electrons generated ¥ ¥ www. radioecology-exchange. org
Units and their significance ¥ Units of absorbed dose (Grays) = Energy deposited (J kg-1) ¥ Only small amounts of deposited energy from ionising radiation are required to produce biological harm - because of how energy is deposited (ionisation and free radical formation) ¥ For example - drinking a cup of hot coffee transfers about 700 Joules of heat energy per kg to the body. ¥ To transfer the same amount of energy from ionising radiation would involve a dose of 700 Gy - but doses in the order of 1 Gy are fatal ¥ I Gy = 1 J kg-1 = 6. 24 1015 ke. V ~ 1012 alphas www. radioecology-exchange. org
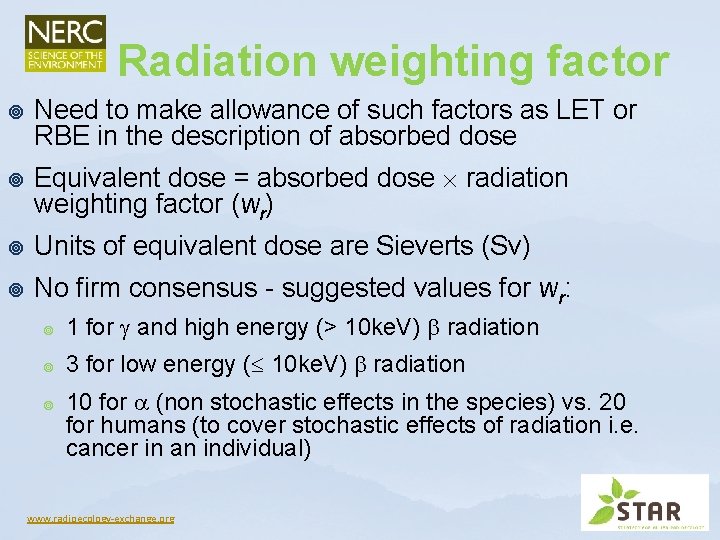
Radiation weighting factor ¥ ¥ Need to make allowance of such factors as LET or RBE in the description of absorbed dose Equivalent dose = absorbed dose radiation weighting factor (wr) ¥ Units of equivalent dose are Sieverts (Sv) ¥ No firm consensus - suggested values for wr: ¥ 1 for and high energy (> 10 ke. V) radiation ¥ 3 for low energy ( 10 ke. V) radiation ¥ 10 for (non stochastic effects in the species) vs. 20 for humans (to cover stochastic effects of radiation i. e. cancer in an individual) www. radioecology-exchange. org
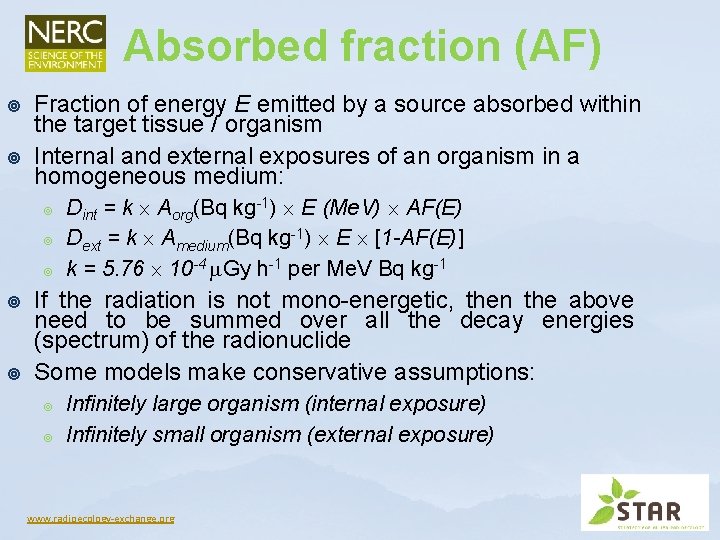
Absorbed fraction (AF) ¥ ¥ Fraction of energy E emitted by a source absorbed within the target tissue / organism Internal and external exposures of an organism in a homogeneous medium: ¥ ¥ ¥ Dint = k Aorg(Bq kg-1) E (Me. V) AF(E) Dext = k Amedium(Bq kg-1) E [1 -AF(E)] k = 5. 76 10 -4 Gy h-1 per Me. V Bq kg-1 If the radiation is not mono-energetic, then the above need to be summed over all the decay energies (spectrum) of the radionuclide Some models make conservative assumptions: ¥ ¥ Infinitely large organism (internal exposure) Infinitely small organism (external exposure) www. radioecology-exchange. org
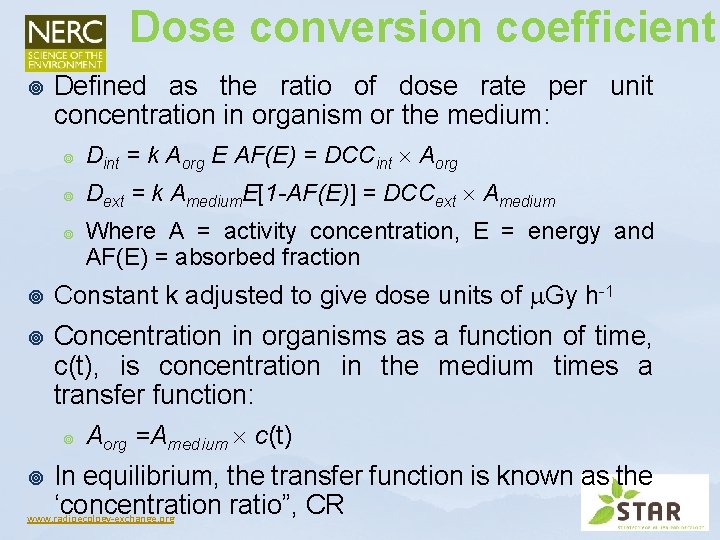
Dose conversion coefficient ¥ Defined as the ratio of dose rate per unit concentration in organism or the medium: ¥ Dint = k Aorg E AF(E) = DCCint Aorg ¥ Dext = k Amedium. E[1 -AF(E)] = DCCext Amedium ¥ Where A = activity concentration, E = energy and AF(E) = absorbed fraction ¥ Constant k adjusted to give dose units of Gy h-1 ¥ Concentration in organisms as a function of time, c(t), is concentration in the medium times a transfer function: ¥ Aorg =Amedium c(t) In equilibrium, the transfer function is known as the ‘concentration ratio”, CR www. radioecology-exchange. org ¥
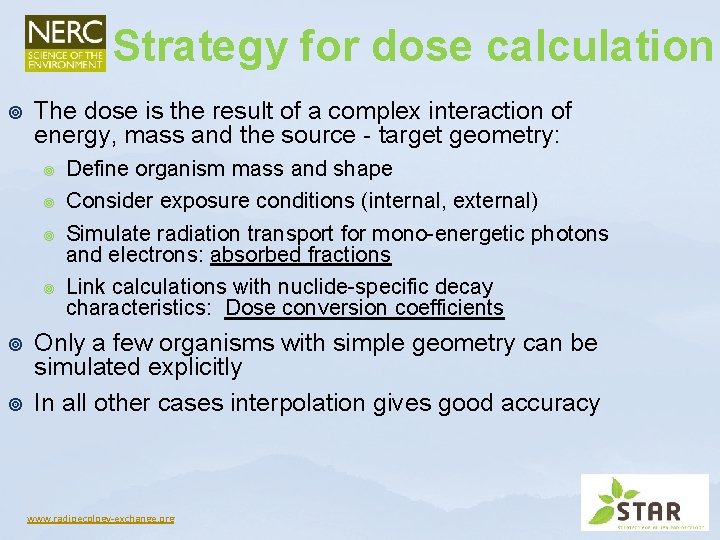
Strategy for dose calculation ¥ The dose is the result of a complex interaction of energy, mass and the source - target geometry: ¥ ¥ ¥ Define organism mass and shape Consider exposure conditions (internal, external) Simulate radiation transport for mono-energetic photons and electrons: absorbed fractions Link calculations with nuclide-specific decay characteristics: Dose conversion coefficients Only a few organisms with simple geometry can be simulated explicitly In all other cases interpolation gives good accuracy www. radioecology-exchange. org
Calculation of AFs: the ERICA approach www. radioecology-exchange. org
Reference habitats & organisms ¥ ¥ The enormous variability of biota requires the definition of reference organisms that represent: ¥ Plants and animals ¥ Different mass ranges ¥ Different habitats Exposure conditions are defined for different habitats: ¥ In soil/on soil ¥ In water/on water ¥ In sediment/interface water sediment www. radioecology-exchange. org
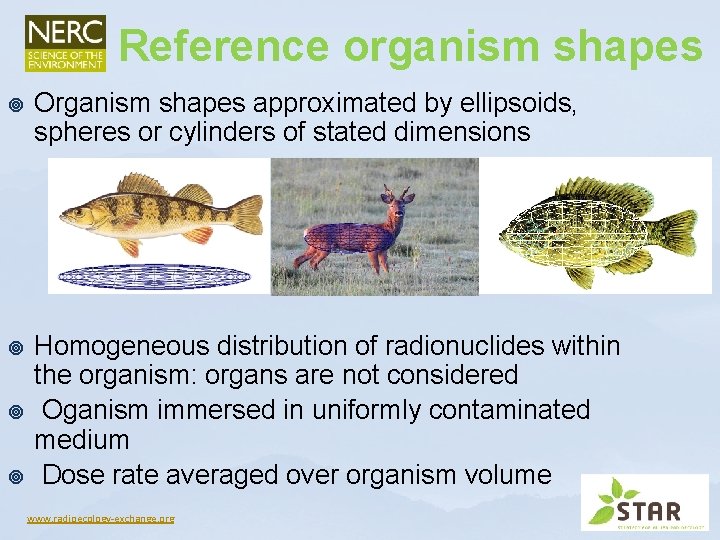
Reference organism shapes ¥ Organism shapes approximated by ellipsoids, spheres or cylinders of stated dimensions ¥ Homogeneous distribution of radionuclides within the organism: organs are not considered Oganism immersed in uniformly contaminated medium Dose rate averaged over organism volume ¥ ¥ www. radioecology-exchange. org
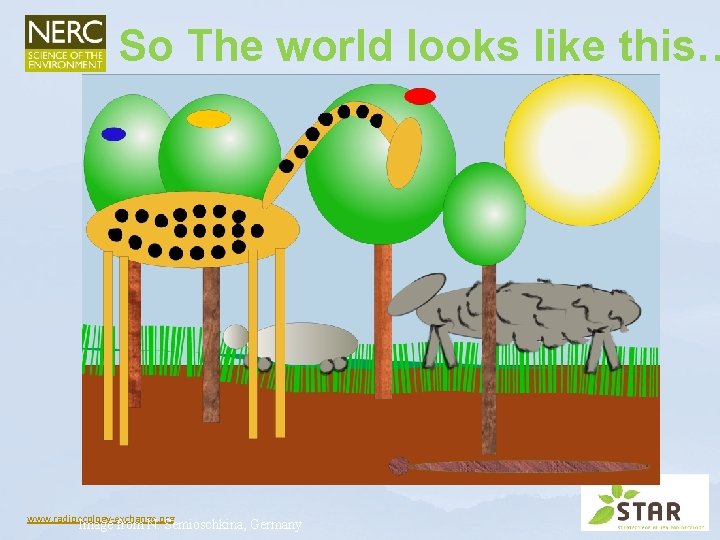
So The world looks like this… www. radioecology-exchange. org Image from N. Semioschkina, Germany
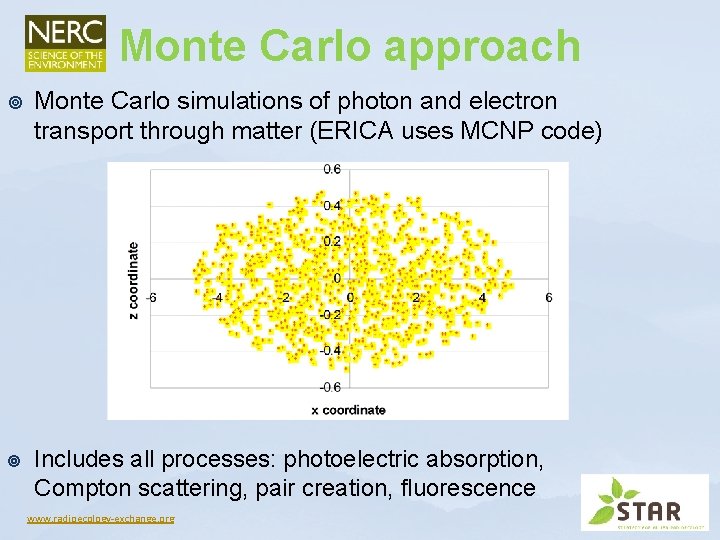
Monte Carlo approach ¥ Monte Carlo simulations of photon and electron transport through matter (ERICA uses MCNP code) ¥ Includes all processes: photoelectric absorption, Compton scattering, pair creation, fluorescence www. radioecology-exchange. org
Problems and limitations ¥ Monte Carlo calculations are very time-consuming: ¥ ¥ ¥ Therefore, a two-step method has been developed: ¥ ¥ Long range of high-energy photons in air, a large area around the organism has to be considered A large contaminated area has to be considered as source Small targets get only relatively few hits Probability ~ 1/source-target distance 2 Simulations require high number of photon tracks KERMA calculated in air from different sources on or in soil Dose to organism / dose in air ratio calculated for the different organisms and energies www. radioecology-exchange. org
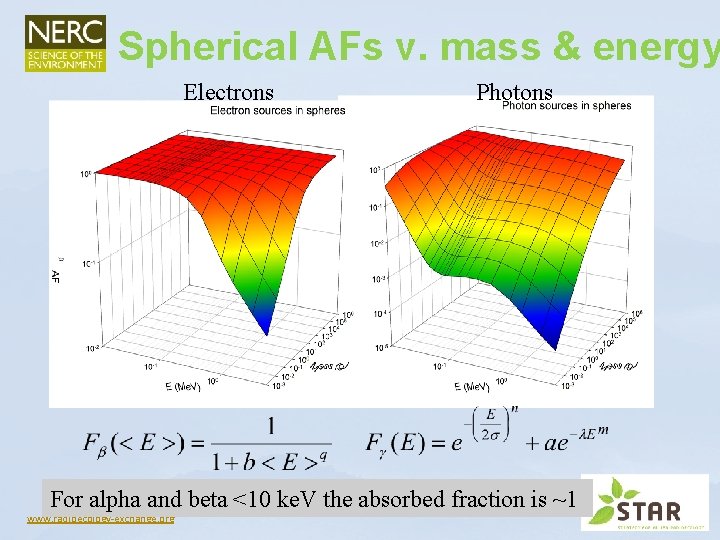
Spherical AFs v. mass & energy Electrons Photons For alpha and beta <10 ke. V the absorbed fraction is ~1 www. radioecology-exchange. org
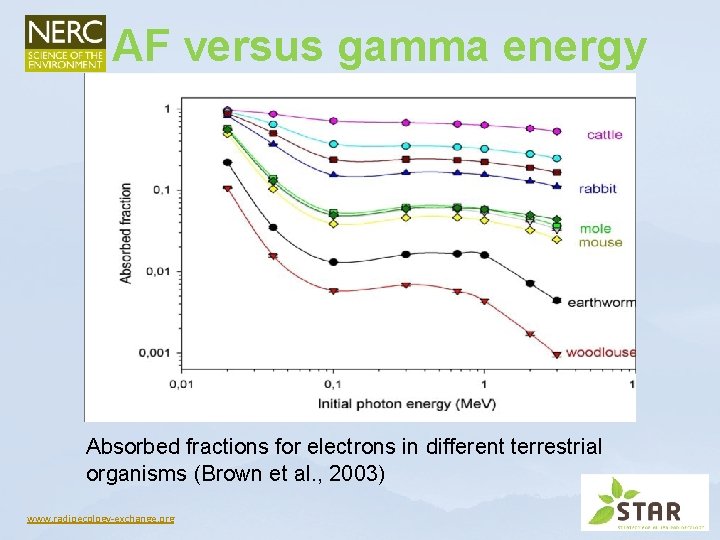
AF versus gamma energy Absorbed fractions for electrons in different terrestrial organisms (Brown et al. , 2003) www. radioecology-exchange. org
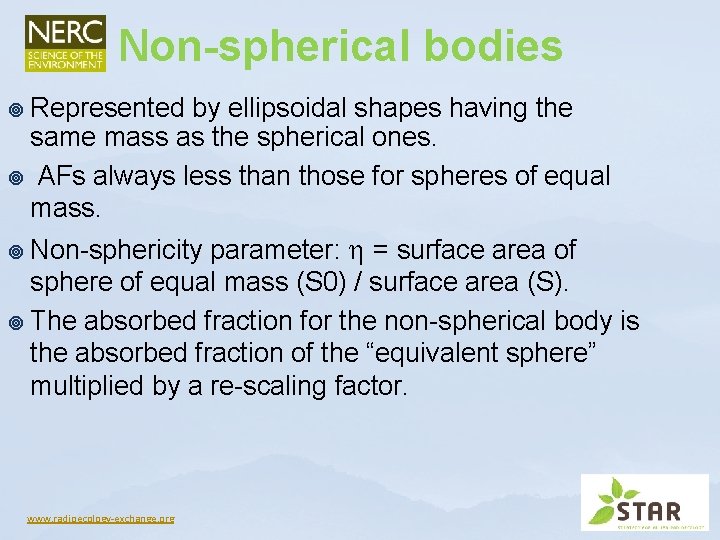
Non-spherical bodies ¥ Represented by ellipsoidal shapes having the same mass as the spherical ones. ¥ AFs always less than those for spheres of equal mass. parameter: = surface area of sphere of equal mass (S 0) / surface area (S). ¥ The absorbed fraction for the non-spherical body is the absorbed fraction of the “equivalent sphere” multiplied by a re-scaling factor. ¥ Non-sphericity www. radioecology-exchange. org
Calculation of DCCs: ERICA database www. radioecology-exchange. org
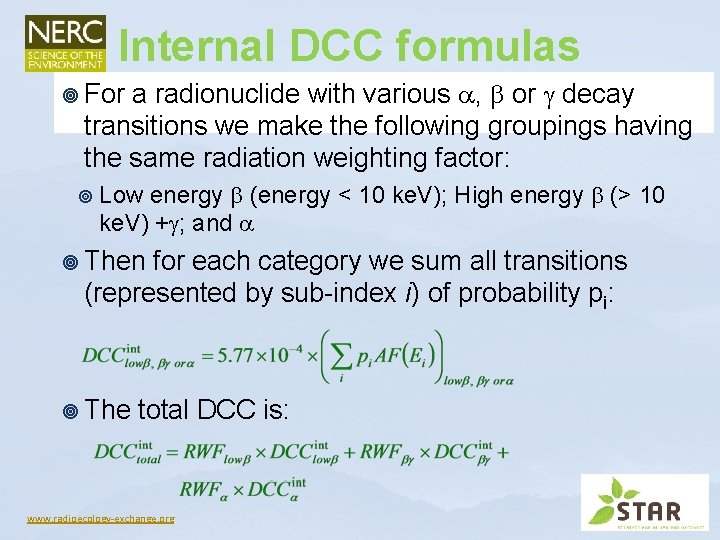
Internal DCC formulas a radionuclide with various , or decay transitions we make the following groupings having the same radiation weighting factor: ¥ For ¥ Low energy (energy < 10 ke. V); High energy (> 10 ke. V) + ; and ¥ Then for each category we sum all transitions (represented by sub-index i) of probability pi: ¥ The total DCC is: www. radioecology-exchange. org
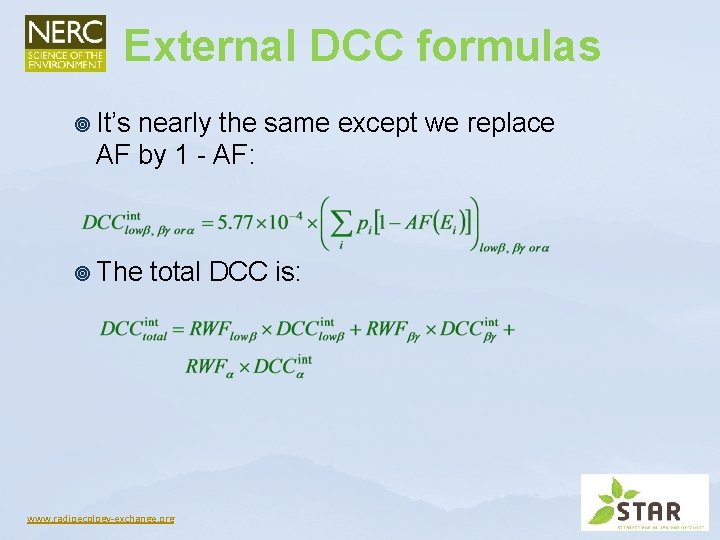
External DCC formulas ¥ It’s nearly the same except we replace AF by 1 - AF: ¥ The total DCC is: www. radioecology-exchange. org
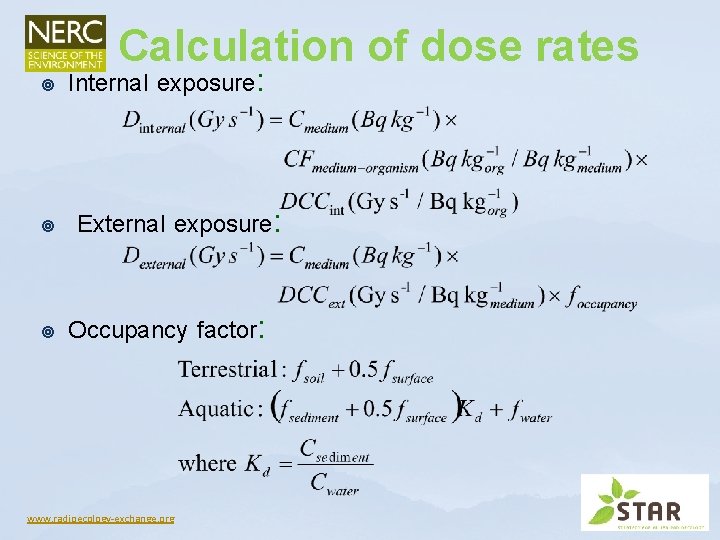
Calculation of dose rates ¥ ¥ ¥ Internal exposure: External exposure: Occupancy factor: www. radioecology-exchange. org
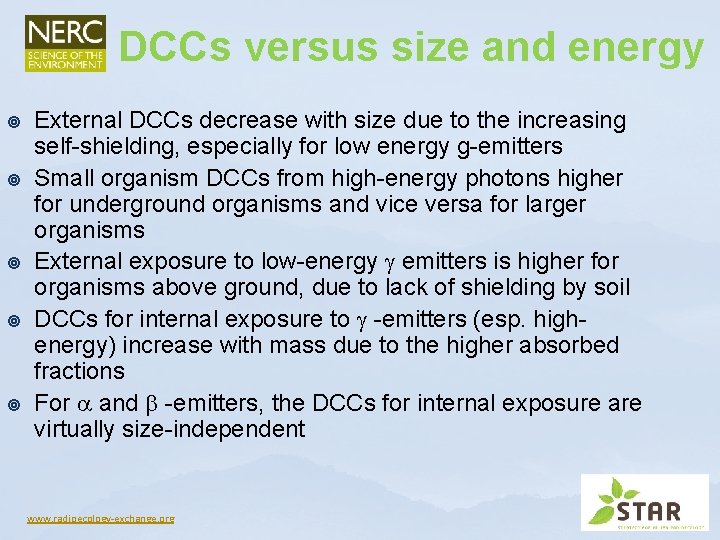
DCCs versus size and energy ¥ ¥ ¥ External DCCs decrease with size due to the increasing self-shielding, especially for low energy g-emitters Small organism DCCs from high-energy photons higher for underground organisms and vice versa for larger organisms External exposure to low-energy emitters is higher for organisms above ground, due to lack of shielding by soil DCCs for internal exposure to -emitters (esp. highenergy) increase with mass due to the higher absorbed fractions For and -emitters, the DCCs for internal exposure are virtually size-independent www. radioecology-exchange. org
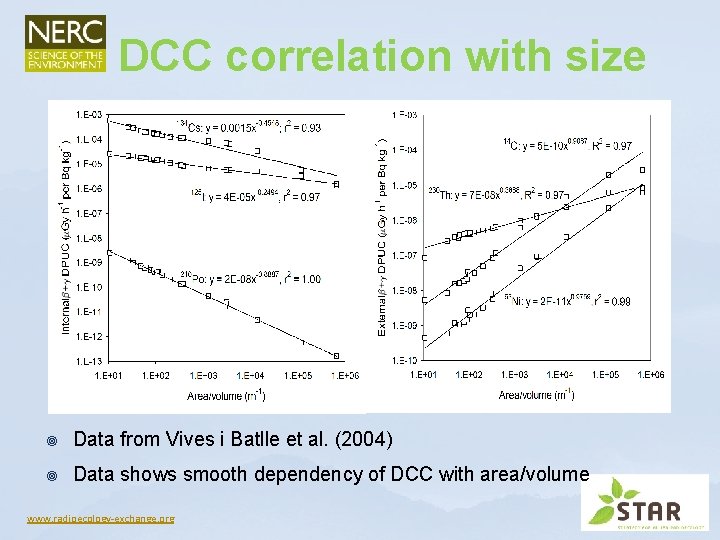
DCC correlation with size ¥ Data from Vives i Batlle et al. (2004) ¥ Data shows smooth dependency of DCC with area/volume www. radioecology-exchange. org
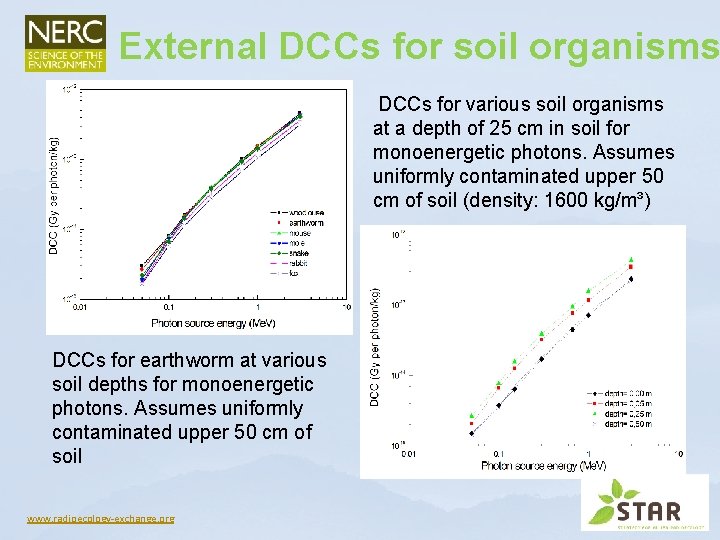
External DCCs for soil organisms DCCs for various soil organisms at a depth of 25 cm in soil for monoenergetic photons. Assumes uniformly contaminated upper 50 cm of soil (density: 1600 kg/m³) DCCs for earthworm at various soil depths for monoenergetic photons. Assumes uniformly contaminated upper 50 cm of soil www. radioecology-exchange. org
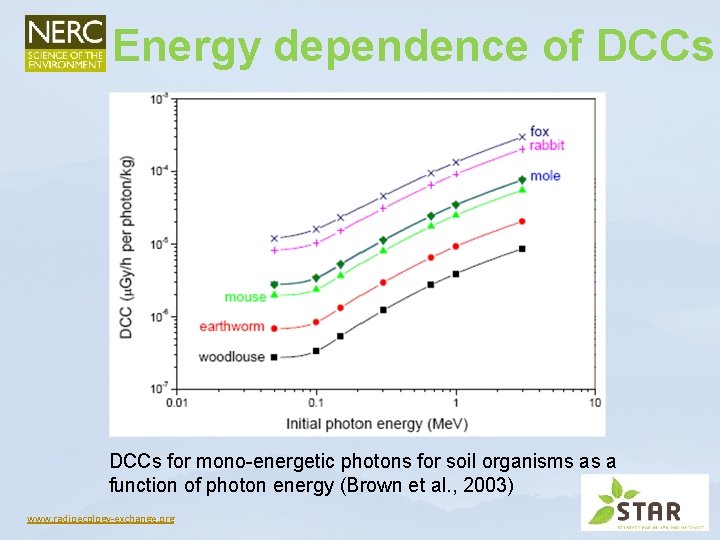
Energy dependence of DCCs for mono-energetic photons for soil organisms as a function of photon energy (Brown et al. , 2003) www. radioecology-exchange. org
Comparing ERICA with other tools www. radioecology-exchange. org
Intercomparison analysis ¥ ¥ ¥ ¥ International comparison of 7 models performed under the EMRAS project: EDEN, EA R&D 128, ERICA, Dos. Dim. Eco, EPIC-DOSES 3 D, RESRADBIOTA, SÚJB 5 ERICA runs by different users: default DCCs, ICRP, SCK-CEN, ANSTO, K-Biota 67 radionuclides and 5 ICRP RAP geometries Internal doses: mostly within 25% around mean External doses: mostly within 10% around mean There are exceptions e. g. α and soft β-emitters reflecting variability in AF estimations (3 H, 14 C…) ERICA making predictions similar to other models www. radioecology-exchange. org
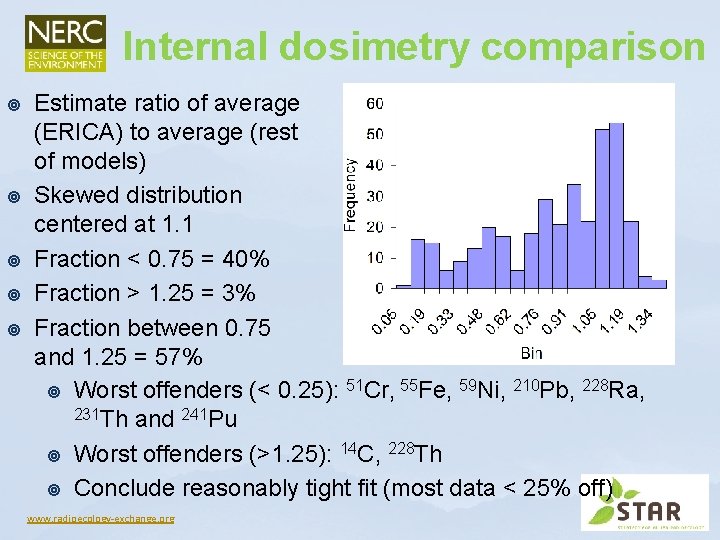
Internal dosimetry comparison ¥ ¥ ¥ Estimate ratio of average (ERICA) to average (rest of models) Skewed distribution centered at 1. 1 Fraction < 0. 75 = 40% Fraction > 1. 25 = 3% Fraction between 0. 75 and 1. 25 = 57% ¥ Worst offenders (< 0. 25): 51 Cr, 55 Fe, 59 Ni, 210 Pb, 228 Ra, 231 Th and 241 Pu ¥ Worst offenders (>1. 25): 14 C, 228 Th ¥ Conclude reasonably tight fit (most data < 25% off) www. radioecology-exchange. org
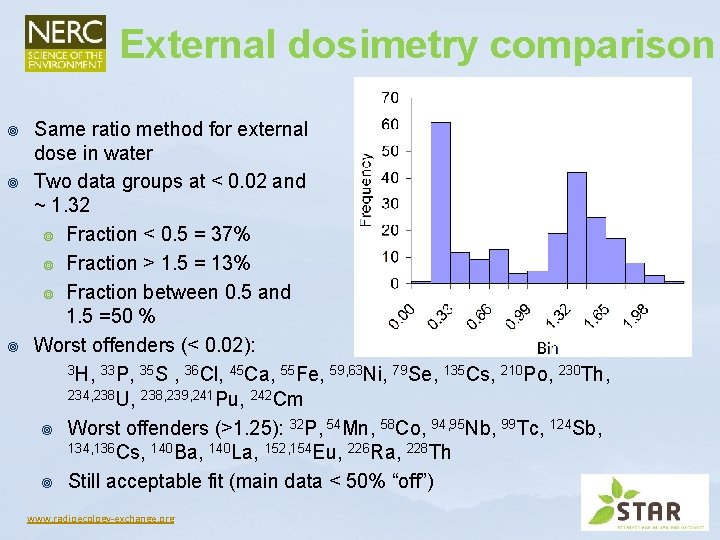
External dosimetry comparison ¥ ¥ ¥ Same ratio method for external dose in water Two data groups at < 0. 02 and ~ 1. 32 ¥ Fraction < 0. 5 = 37% ¥ Fraction > 1. 5 = 13% ¥ Fraction between 0. 5 and 1. 5 =50 % Worst offenders (< 0. 02): 3 H, 33 P, 35 S , 36 Cl, 45 Ca, 55 Fe, 59, 63 Ni, 79 Se, 135 Cs, 210 Po, 230 Th, 234, 238 U, 238, 239, 241 Pu, 242 Cm ¥ Worst offenders (>1. 25): 32 P, 54 Mn, 58 Co, 94, 95 Nb, 99 Tc, 124 Sb, 134, 136 Cs, 140 Ba, 140 La, 152, 154 Eu, 226 Ra, 228 Th ¥ Still acceptable fit (main data < 50% “off”) www. radioecology-exchange. org
Special cases outside the ERICA approach www. radioecology-exchange. org
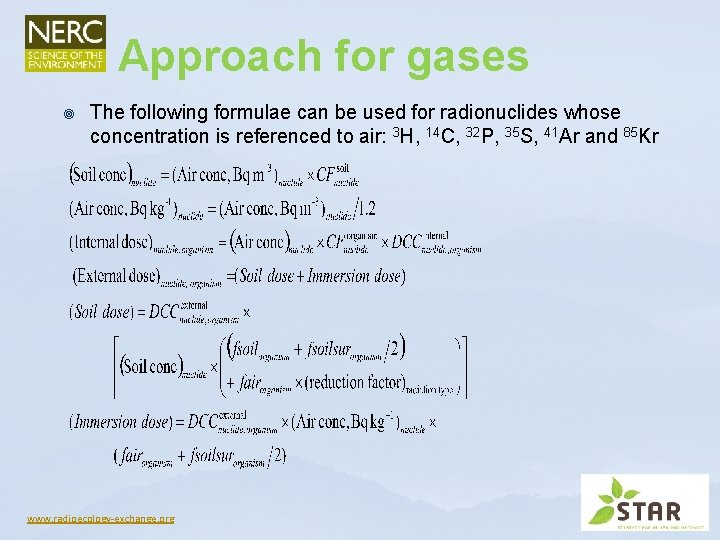
Approach for gases ¥ The following formulae can be used for radionuclides whose concentration is referenced to air: 3 H, 14 C, 32 P, 35 S, 41 Ar and 85 Kr www. radioecology-exchange. org
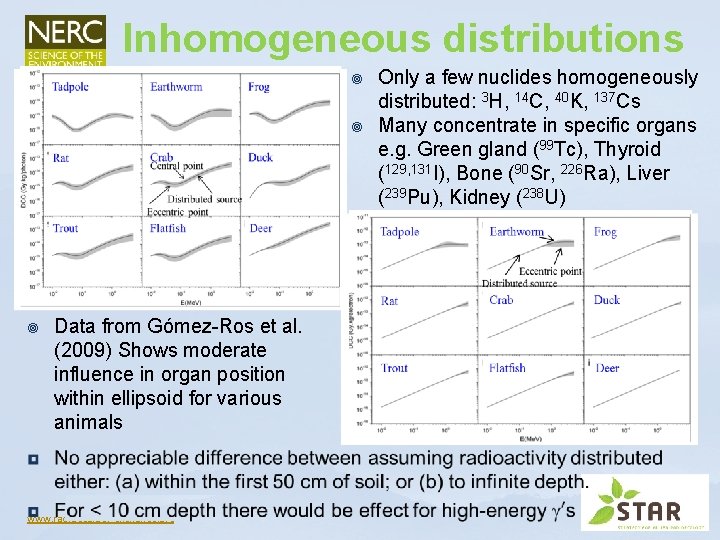
Inhomogeneous distributions ¥ ¥ ¥ Data from Gómez-Ros et al. (2009) Shows moderate influence in organ position within ellipsoid for various animals www. radioecology-exchange. org Only a few nuclides homogeneously distributed: 3 H, 14 C, 40 K, 137 Cs Many concentrate in specific organs e. g. Green gland (99 Tc), Thyroid (129, 131 I), Bone (90 Sr, 226 Ra), Liver (239 Pu), Kidney (238 U)
Argon and krypton ¥ ¥ Internal dose negligible: Ar and Kr CFs set to 0 No deposition but some migration into soil pores ¥ ¥ ¥ Assume pore air is at the same concentration as ground level air concentrations assume a free air space of 15%, density = 1500 kg m-3, so free air space = 10 -4 m 3 kg-1 & Bq m-3(air) * 10 -4 = Bq kg-1 (wet) Hence, a TF of 10 -4 for air (Bq m-3) to soil (Bq kg-1 wet) For plants and fungi occupancy factors set to 1. 0 soil, 0. 5 air (instead of 0) Biota in the subsurface soil and are exposed only to 41 Ar and 85 Kr in the air pore spaces External DCCs for fungi are those calculated for bacteria (i. e. infinite medium DCCs) www. radioecology-exchange. org
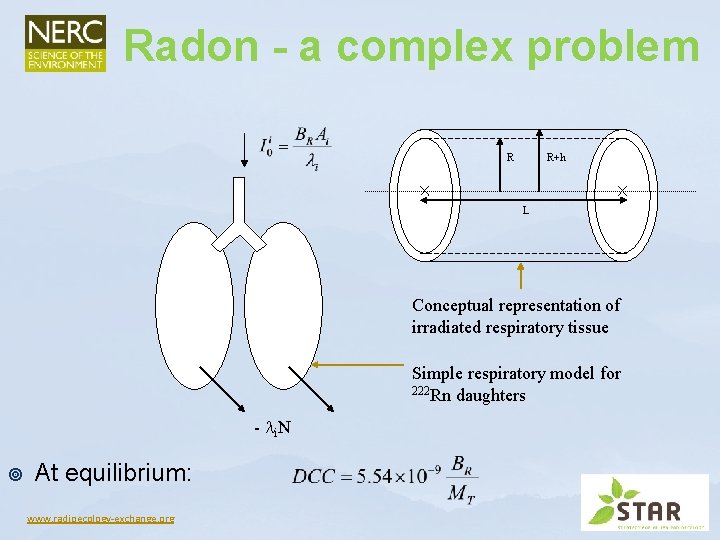
Radon - a complex problem R R+h L Conceptual representation of irradiated respiratory tissue Simple respiratory model for 222 Rn daughters - i. N ¥ At equilibrium: www. radioecology-exchange. org
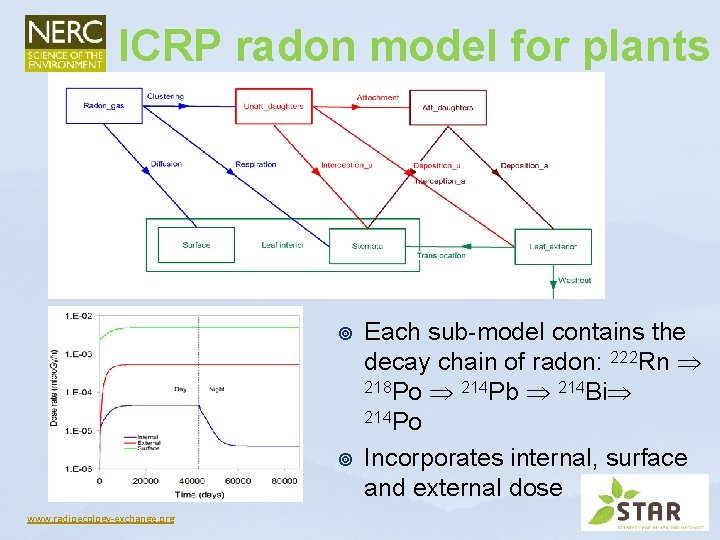
ICRP radon model for plants ¥ ¥ www. radioecology-exchange. org Each sub-model contains the decay chain of radon: 222 Rn 218 Po 214 Pb 214 Bi 214 Po Incorporates internal, surface and external dose
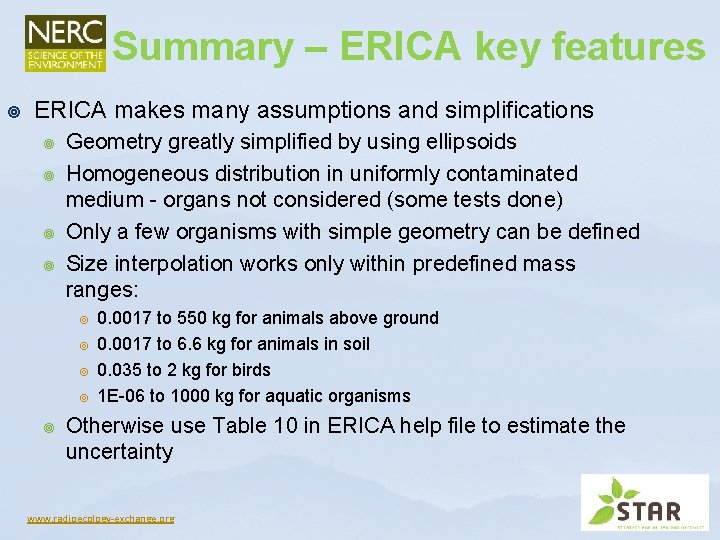
Summary – ERICA key features ¥ ERICA makes many assumptions and simplifications ¥ ¥ Geometry greatly simplified by using ellipsoids Homogeneous distribution in uniformly contaminated medium - organs not considered (some tests done) Only a few organisms with simple geometry can be defined Size interpolation works only within predefined mass ranges: ¥ ¥ ¥ 0. 0017 to 550 kg for animals above ground 0. 0017 to 6. 6 kg for animals in soil 0. 035 to 2 kg for birds 1 E-06 to 1000 kg for aquatic organisms Otherwise use Table 10 in ERICA help file to estimate the uncertainty www. radioecology-exchange. org
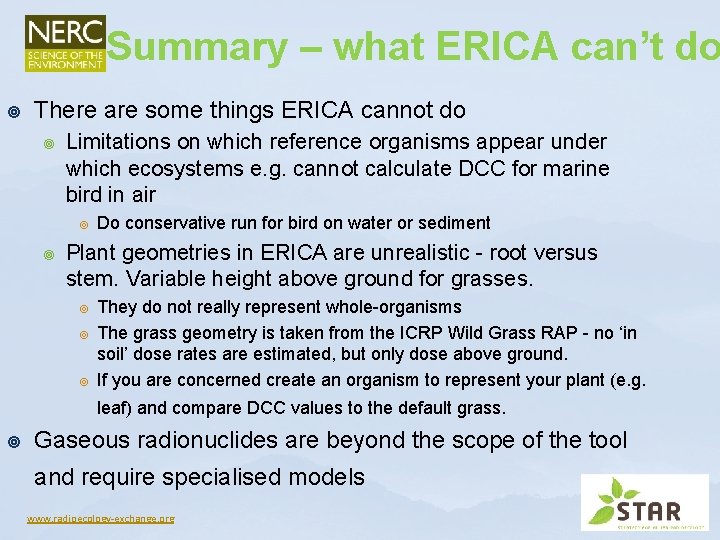
Summary – what ERICA can’t do ¥ There are some things ERICA cannot do ¥ Limitations on which reference organisms appear under which ecosystems e. g. cannot calculate DCC for marine bird in air ¥ ¥ Do conservative run for bird on water or sediment Plant geometries in ERICA are unrealistic - root versus stem. Variable height above ground for grasses. ¥ ¥ ¥ They do not really represent whole-organisms The grass geometry is taken from the ICRP Wild Grass RAP - no ‘in soil’ dose rates are estimated, but only dose above ground. If you are concerned create an organism to represent your plant (e. g. leaf) and compare DCC values to the default grass. ¥ Gaseous radionuclides are beyond the scope of the tool and require specialised models www. radioecology-exchange. org
References ¥ ¥ ¥ Brown J. , Gomez-Ros J. -M. , Jones, S. R. , Pröhl, G. , Taranenko, V. , Thørring, H. , Vives i Batlle, J. and Woodhead, D, (2003) Dosimetric models and data for assessing radiation exposures to biota. FASSET Deliverable 3 Report under Contract No FIGECT-2000 -00102, G. Pröhl (Ed. ). Gómez-Ros, J. M. , Pröhl, G. , Ulanovsky, A. and Lis, M. (2008). Uncertainties of internal dose assessment for animals and plants due to non-homogeneously distributed radionuclides. Journal of Environmental Radioactivity 99(9): 1449 -1455. Ulanovsky, A. and Pröhl, G. (2006) A practical method for assessment of dose conversion coefficients for aquatic biota. Radiation and Environmental Biophysics 45: 203 -214. Vives i Batlle, J. , Jones, S. R. and Gómez-Ros, J. M. (2004) A method for calculation of dose per unit concentration values for aquatic biota. Journal of Radiological Protection 24(4 A): A 13 -A 34. Vives i Batlle, J. , Jones, S. R. and Copplestone, D. (2008) Dosimetric Model for Biota Exposure to Inhaled Radon Daughters. Environment Agency Science Report – SC 060080, 34 pp. Vives i Batlle, J. , Barnett, C. L. , Beaugelin-Seiller, K. , Beresford, N. A. , Copplestone, D. , Horyna, J. , Hosseini, A. , Johansen, M. , Kamboj, S. , Keum, D-K. , Newsome, L. , Olyslaegers, G. , Vandenhove, H. , Vives Lynch, S. and Wood, M. (2011) Absorbed dose conversion coefficients for non-human biota: an extended inter-comparison of data. Radiation and Environmental Biophysics 50(2): 231 -251. www. radioecology-exchange. org