Radar Summary Conventional Outline C Radar Coverage in


 t")
 at a range (r) is given by: Wb =")


 u: lightspeed in")

 Pt : peak transmitted power (W)")


 of high Z centred on")


 The pulse repetition frequency (PRF) is the number of pulses")


, then")


- Slides: 182
Radar Summary Conventional
Outline C Radar Coverage in Canada C Basic Interpretation C Conventional Radar C Severe Weather Signatures on Radar C New Radar Techniques… C Verification C Wrap-up
4
North American Radar Coverage
Conventional Radar Output For the masses….
Nominal Radar Coverage with 256 km range However, in winter …
Effective Radar Coverage with 2 km echo tops Large blind swaths across the country ♫ I’m dreaming of gap-filling -band network … X Even here on the 401
Pacific Network
Prairie Network
Ontario Network
Quebec Network
Atlantic Network
Radar Data in Ontario
NWS Radar Composite Meteorologists without Borders
Conventional Radar
RADAR BEAM The beam of energy spreads out with distance, taking a shape resembling a cone just like the light beam from a coastal lighthouse.
First pulse Second pulse beam width beam axis h (pulse length in space) t (pulse length in time)
Widening Beamwidth (W b ) at a range (r) is given by: Wb = r · sin q For small angles it can be approximated as Wb » r q 200 150 100 50 r q
EM Wave Propagation Vacuum : approximately 3 * 108 m/s in a homogeneous medium - straight line - constant speed atmosphere not being homogeneous. . .
Atmospheric Interactions Refraction – beam bending Absorption – energy absorption Scattering – beam scattering Reflection – beam reflection
Refraction refractive index n=c/u n: refractive index c: lightspeed (in vacuum) u: lightspeed in medium Refractivity (N) N = (n-1) 106
Radar Propagation depends mainly on vertical refractivity gradient assumed straight line propagation under “normal” conditions: - constant standard refractive index gradient - constant radius of the earth
Radar Equation Pr : average received power (W) Pt : peak transmitted power (W) ke: G: pulse length in space (m) antenna gain qb : horizontal beam width fb : vertical beam width l : transmitted wavelength (m) |K|2: target’s refractive index r : target’s slant range (m) Z: target reflectivity factor or Ze (mm 6 m-3)
Assumptions Radar range Equation n non uniform vertical distribution n Z-R variations n beam filling n
Simpler Radar Equation Pr average received power where C is the Radar Constant K target’s refractive index Z target reflectivity factor r target’s slant range
Sampling Reflectivity Dimensions of volume elements being scanned are determined by the beam widths and pulse length. Beam width is associated with the equipment: Pulse length affects the size of conical section being sensed.
ATMOSPHERIC ATTENUATION As radiation interacts with encountered particles within a swept portion of the atmosphere, the associated energy undergoes several changes which tends to further reduce its flux along the pulsating beams. This is mainly due to: • absorption • scattering
ATMOSPHERIC ABSORPTION For microwaves, main absorbing gases are: Water vapor : • • • Oxygen : pressure temperature (inverse) absolute humidity • pressure (squared) • temperature • weaker variables: - climate - season Corrections to the order of 3 to 4 d. B (within 200 km) can be applied to precipitation measurements.
Attenuation PRF can theoretically determine a maximum unambiguous range. In practice, within a network, the useful range of weather radars would be less than 200 km. Quantitative precipitation measurements near the surface can extend to a distance of 130 km. Doppler may expand intrinsic limitations with new developments. Special requirements for long range detection of thunderstorm can also be serviced.
Hydrometeors attenuation relates to: - shape - size - composition - wavelength: @ 10 cm: rather weak @ 5 cm: acceptable (higher latitude) @ 3 cm: significant
Water mass larger water mass causes more attenuation: ice has less effect than liquid. Attenuation increases in: - more dense precipitation areas - heavier precipitation
Size Melting precipitation and larger particles such as - wet snow - hail can distort precipitation estimates. Cloud particles have little effect; it can be ignored (unless more precision required)
normal atmospheric conditions
abnormal atmospheric conditions subrefraction superrefraction ducting cool, moist air aloft warm, dry air below warm dry air aloft cool, moist air below
The Schematic Radar
Radar Sources of Error
Radar System Limitations
Non-meteorological effects
Meteorological Effects
Radar sensitivity and blockage n n n Not all radars are equal Most are retrofitted Enterprise radars with 1. 1° beam width and 4 m dishes Some are Andrews radars with 0. 65° beam width and 6 m dishes Spirit River AB, WWW, has only 1. 6° beam width! Many have obvious issues – – n differences in sensitivity between each other blockages But many have less obvious, but significant problems that only become apparent with long-term precip accums
BC 15 Day Precip Accum CAPPI 1. 5 km WWW 1015 m XPG 1118 m XSS 1829 m XSI 700 m WUJ 60 m
Prairies 30 Day Precip Accum PRECIPET
Nrn Ontario 2 Day Precip Acc CAPPI 1. 0 km Feb 16 -17 200
2 Day Precip Accum CAPPI 1. 0 km Mar 8 -9 2008 Srn Ontario
Srn Quebec N 2 Day Precip Accum CAPPI 1. 0 km Mar 8 -9 2008
Atlantic 2 Day Precip Accum CAPPI 1. 0 km Jan 28 -30 2008
Sources of Error - Radar Dome Wetting
Sources of Error n Intervening precipitation n Wet radome n Beam blocking
Attenuation: What lies beyond?
Example of Attenuation in Precipitation Wedge of attenuation Foreground Storm
Cross Section constructed along this line
60 db. Z core
Sources of Error - Cell Blocking Cell blocking
Sources of Error - Sidelobes Orographic Enhancement 3 D View of Real Beam
Sources of Error - Blocking Impacts on Precipitation Estimates ? N CP P o N ? N P N C P o Why no precipitatio n amount maximum on the peaks?
Bright Band Melting snowflakes are large bright radar targets n Reflectivity from melting snow is larger than that of the rain below or the snow above as falling snow passes through the melting layer n Huge impact on quantitative precipitation estimates n
Bright band shows up as ring (or partial ring) of high Z centred on the radar Bright band
But not on the lower elevation scan, in this case
Melting layer shows as peak in Z (note it shows up best in data for the 3. 5 degree scan. Why? )
Sources of Error - Conventional Ground Clutter
Sources of Error - Anomalous Propagation AP Strong inversions Typical early morning after clear (long) nights – fall maximum Over cold water surface – spring maximum
Sources of Error - Virga Typical of strong overrunning WCB with equally strong and dry CCB
Cross section to the southwest
Low-elevation angle Doppler Z PPI scan Let’s look at the same case observed by the Doppler scans Low level reflectivities to the west of the radar – rain?
3. 5 Degree Doppler Z PPI scan Echoes at higher altitude precede precipitation at low Levels – virga?
Sources of Error - ECHO TOP Beamwidth and Beamfilling 67
ECHO TOP Limiting by Maximum Elevation 68
ECHO TOPS - Within 36 km of the radar, echo tops will be underestimated - Within 15 km precipitation can easily go undetected - Layers of precipitation not detected: only the max tops 69
Antenna Scan Strategies n Conventional: – – – n Doppler: 24 PPI scans top down 6 RPM 24. 6 to 0. 3 degrees (0. 1 in winter) 5 minutes to complete 10 seconds per elevation angle, 6 per minute – – 3 scan angles bottom up ? much slower (0. 85 RPM) since more sample points are collected for the Doppler processing fills much of remaining 5 minutes 10 minute cycle 70
n CAPPI 1. 0 – – – n Some basic radar products CAPPI vs. PRECIP Uses conventional reflectivity scans 1 km AGL out to 100 km, then rides up the lowest PPI angle (~0. 1° winter & 0. 3 ° summer) out to 256 km Precipitation is relatively high above ground and can grow considerably between 1 km AGL and the surface PRECIP – – – Uses long range doppler reflectivity scan within 125 km of radar, including ground clutter removal Uses lowest PPI conventional reflectivity scan beyond 125 km of radar Doppler reflectivity not quite as sensitive to weak echoes Best product for seeing precipitation close to ground Therefore, Precipitation Accums (PA) from PRECIP product should be better than from CAPPI, as long as ground doesn’t absorb too much beam power
Some basic radar products CAPPI 1. 0 km vs. PRECIP product CAPPI 1. 0 10 25. 0 0 PRECIP 2. 0 0 beam height (km) 18 2 tivity c e l f e r l a vention 0. 0 0 Doppler ty reflectivi Con range (km)
PRECIP product example Boundary between doppler & conventional reflectivity scans
Gain vs Beamwidth The smaller the beamwidth, better the gain n Improved gain means higher signal strength for distant objects or small targets n – e. g. light precipitation may be detected at greater distances 74
Weather Radar Bands n The more common weather radar wavelengths and letter designations are: 75
Pulse Repetition Frequency (PRF) The pulse repetition frequency (PRF) is the number of pulses emitted by the radar per second (pps) n A pulse travelling to a target at range rmax and back will cover a distance 2 rmax n The pulse will make it back to the radar before the next pulse is emitted if: n 2 rmax=c/PRF 76
PRF and radar range Or…. rmax=c/2 PRF Thus, the higher the PRF, the lower the effective range (ignoring second-trip echos from objects located beyond rmax) n The lower the PRF, the higher the range. n 77
Rmax vs PRF 78
Rmax in selected modes The Clear Air PRF is 50 allowing greater range. 79
CONVENTIONAL RADAR DISPLAYS • PPI • CAPPI • FOUR CAPPI • MAX R • ECHO TOP • SEVERE WEATHER • CROSS SECTION STYLE: -DIAMETER CROSS SECTION -ARBITRARY CROSS SECTION 80
PPI Elevations and Angles 81
Radar beam height vs. range Height of radar beam in normal atmospheric conditions 18 25. 0 0 10 2. 0 0 am 0 e 1. 0 b 0. 0 0 2 beam height (km) Cone of silence Beam widens with range (km) Overshoots low tops
PPI Display - 0. 3 Degree Angle
PPI and CAPPI 4. 0 km CAPPI 0. 3 Degree PPI 1. 5 km CAPPI 0. 3 Degree PPI
CAPPI 85
Cross-sections - CAPPI - Echo Top
MAXR Data Display
Severe Weather Display
Damage Paths - April 20, 1996
Violet Hill LP – Low Topped Supercell
Roof
Manitoba Maple
Doppler Radar
The Doppler effect n n Classically, the Doppler effect is a frequency shift The change in frequency of a signal returned from a target owing to its radial motion relative to an observer With radar, this is measured as a shift in phase between the transmitted pulse and the backscattered microwave radiation Average radial velocity of the target is calculated from this phase shift
The Radar Waveform
Velocity Spectrum Stationary GC WX WX Moves -VN 0 +VN
Phase Shift Ambiguity A shift of ¼ wavelength is ambiguous. You don’t know if your are coming or going?
Velocity folding – Phase Shift Ambiguity Target radial velocities producing phase shifts greater than one-half wavelength (or p radians) results in velocity folding n Maximum unambiguous radial velocity Vmax (Nyquist velocity) = n (PRF X Wavelength) / 4 n This range is not adequate to describe all horizontal velocities n Nyquist velocity=1200 X 5 cm/4 = 1500 cm/sec=15 m/s=30 knots Is a Nyquist velocity of 30 knots enough?
The velocities with this storm are HUGE !!!! Quick, increase the PRF and give me a sector scan on the storm cell ! Vmax (Nyquist velocity) = (PRF X Wavelength) / 4 By increasing the PRF, velocity foldng starts at a higher radial velocity
Folded Doppler quickly reaches the maximum colour range and cycles to opposite colours = noisy, complicated fields Interpretation is challenging! Helen was right! ? ? After PRF increased Before Helen’s Demand
Doppler Dilemma n Maximum unambiguous range: n Rmax = c / 2 PRF n What is this for PRF = 1200 ? 125 km Vmax. Rmax = cl/8 n Vmax and Rmax are inversely proportional to each other, but we want to maximize both n That’s the Doppler dilemma n
How can we increase Vmax ?
Velocity Unfolding n Use two PRF’s and take the difference in the Doppler velocities ! n The difference turns out to be a unique function of the actual velocity out to much higher velocities!! n So DV and one of the velocity measurements can be used to unambiguously calculate the actual radial velocity, perhaps up to 48 m/s (almost 100 knots).
Whoa. Now that’s fast!!
Dual PRF Unfolding
Now we can see the whole storm, Bill ! That’s great, Jo. Now if only Dorothy and pigs would fly !
Example: Radial Velocity Product with Vr to 48 m/s N-S Warm Front? WLY upper level winds SELY low level winds Katabatic Cold Front?
Doppler Patterns
Doppler wind interpretation You can determine wind direction vs. height away from radar in two different directions • Go out along zero line • Draw line back to radar • Wind is perpendicular to this line, towards the red echoes
Doppler wind interpretation For any height you can attempt to determine the wind in 4 locations • Determine the two zero line winds • Look roughly 90° away for the max wind, which should be all directed along a radial In this way you can see areas of non-uniform flow • confluence, diffluence
Doppler Uniform 30 m/s wind everywhere
Doppler Display - Uniform Wind Shear Vertical Wind Shear of 13 knots per kilometre = Speed Shear only
Doppler with Directional Shear and Jet Directional Shear and Wind Maximum 20 20
Doppler with Wind Shear - Speed and Directional Direction veering with height Speed increasing with height
The Doppler Vortex
Doppler Practice Westerly Winds with only Speed shear
Doppler Practice Westerly Winds with Low Level Jet
Doppler Practice Veering Winds with no Speed shear
Doppler Practice Backing Winds with no Speed shear
Doppler Practice Low Level Veering under High Level Backing Winds - no Speed shear
Doppler Practice Wind shift line
Doppler Practice Large Scale Convergence
Doppler Practice Radar Site Divergence
Doppler Practice Radar Site Westerly Winds with only Speed shear
Doppler Practice SWLY NNELY LLJ QS Horizontal LLJ Marginal winds Backing with Height - Cold Air Advection Maybe a Cold Conveyor Belt ahead of a synoptic system…
Doppler Displays
Velocity Azimuth Display - VAD Doppler radial velocity data used to construct a wind profile in the vertical n Direction, speed (m/s) and reflectivity (d. BZ) displayed as a function of height (km) n Note: Velocity scale is fixed in range 0 -20 m/s ( i. e. most of the unfolded velocities are not used ) n
Velocity Azimuth Display - VAD n n n At a given height (h), then the radial velocity is: For a uniform flow field and assume Vw (Vertical Velocity) approximately = 0 then Best fit of a sine curve to the observations around the circle.
Velocity Azimuth Display - VAD n n Accuracy of VAD decreases with elevation angle and height. The desired horizontal wind component becomes a smaller part of the radial wind component actually measure. Errors in the radial component has a bigger impact on the accuracy of the horizontal wind
VAD Example
A new Velocity Azimuth Display LOLAA sees winds far from radar 3. 5° scan sees winds closer in to radar – behaves most like a “profiler”
Doppler Spectra Width n n Spread of the Doppler Power Spectrum the spread, range of terminal fall speeds of the scatterers (more pronounced for rain than for snow) spectra for rain spectra for snow n n n turbulence of the air (upper levels in severe convection) vertical wind shear (e. g. , along a gust front) antenna motion
Doppler Image Characteristics Small Spectral Width Large Spectral Width
Spectral Width and “Doppler Display Texture” Rain Texture Snow Texture
Filtering using Doppler and Processing
Second Trip Echo – Extending the Range of the Doppler Scan Random Phase Processing extends the Doppler Range Dual PRF’s extends the Nyquist Velocity
Second Trip Echoes
Second Trip Echo The velocity signatures of second trip echoes are very noisy. These still contribute to the reflectivity signal where they should not.
Second Trip Processing
Second Trip Processing Doppler Reflectivity with Conventional CAPPI Doppler Reflectivity Processed Second Trip Echoes Doppler Reflectivity with Second Trip Echoes
Long Range Z 142
Long Range Radial Velocity 143
Doppler Wind Shifts B A The angle of viewing is very important and determines what one sees!
Operational Applications
Doppler Wind Shift
Doppler Wind Shift 30 minutes later Cold Front
Rain rate vs. Snow rate n Radar equation for precipitation power returned refractive index factor targets radar constant n range reflectivity factor K 2 is 0. 93 for water and 0. 197 for ice
Rain rate vs. Snow rate n Reflectivity Z is empirically related to rain rate R in the form : Z = a. R n In b Canada we use Marshall-Palmer (stratiform rain) : 1. 6 Z = 200 R But these are not n U. S. NEXRAD : valid in all situations 1. 4 Z = 300 R
Rain Rate vs Snow Rate Snow being depicted using the Rain Z-R Relationship Snow depicted using the Snow Z-R Relationship Normal CAPPI height is 1. 5 km - precipitation intensities are given in a mm/hr scale Cold season (snow expected) CAPPI height is lowered to 1. 0 km better look at low level features that are significant in winter storms and may be missed at 1. 5 k
Bird Migration and Radar
Radar Detection of a Lake Breeze
“Clear” Air Radar Returns
“Clear” Air Radar Returns and Lake Breeze
“Clear” Air Thunderstorm Outflow Gust
Anomalous Propagation of the Radar Beam Only Real Weather AP and Real Weather The Doppler Velocity View
Severe Weather Signatures on Radar
Radar Observation of Hail or Very Heavy Precipitation The spikes signature is associated with hail or heavy rain. It results from the radar beam being reflected from the hail or rain in the thunderstorm, then reflecting from the surface then back to the thunderstorm and then back to the radar… a longer path. . .
”Hail spikes" from the Carvel Radar near Edmonton
Hail Spikes & Side Lobe MAXR Echo Top
Hail Hazards Map
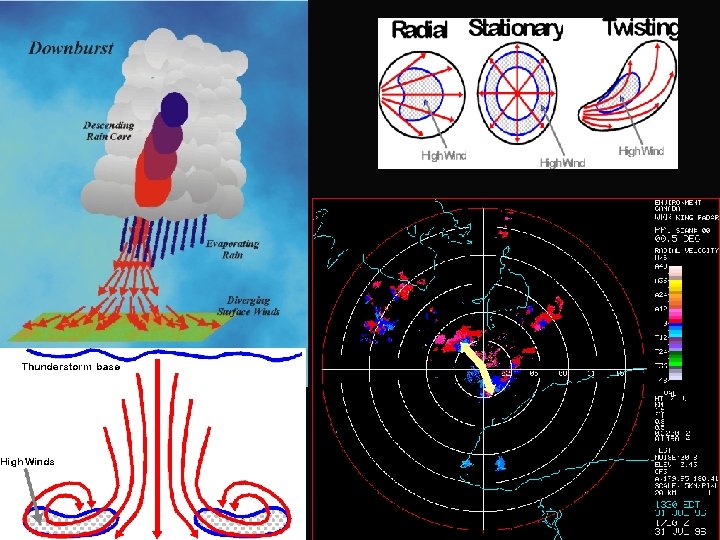
1. 3 km 4 km 0. 5 Doppler Velocity 1. 5 Doppler Velocity Rotating Downbursts on Descent Cyclonic rotation 11 km 3. 5 Doppler Velocity
A December Squall Line with Rear Inflow Jet
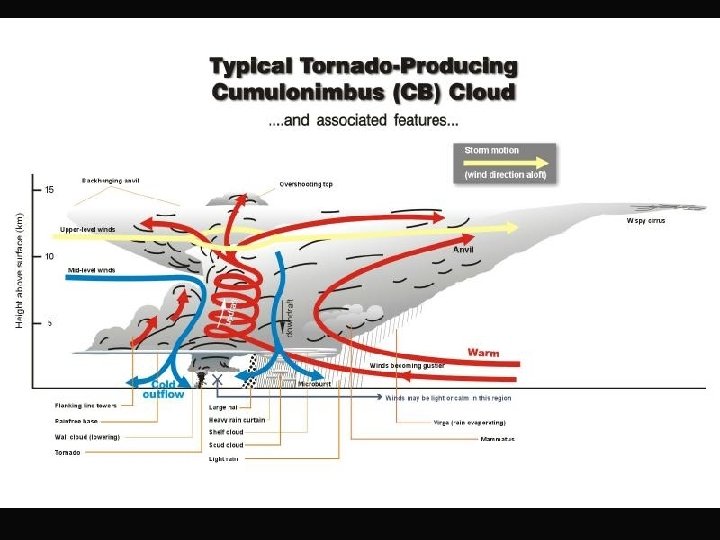
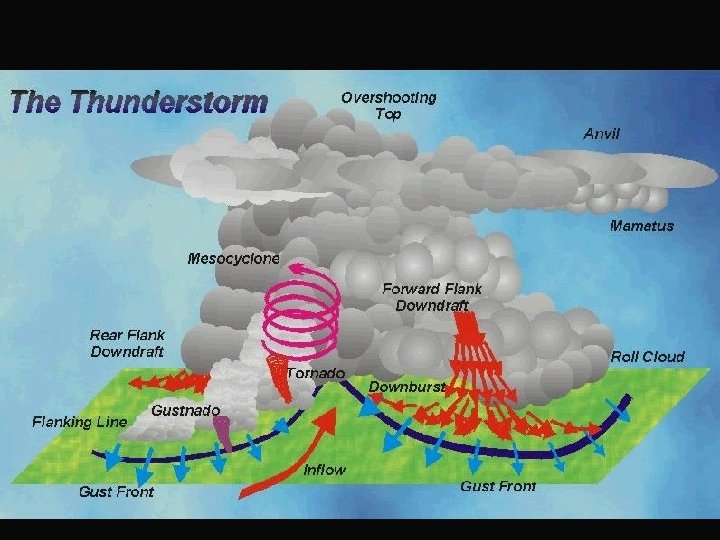
Severe Thunderstorm Processes
3. 5 Degree Doppler Close-up View 0. 5 Degree PPI Reflectivity Display 0. 5 Degree PPI Doppler Velocity Mesocyclone on Reflectivity Display 3. 5 Degree PPI Doppler Velocity
0. 5 and 3. 5 Degree PPI Doppler
New Radar Techniques E Bistatic Radar… multiple antennas for radiating and reception to get two components of the wind… needs GPS
Bistatic Doppler Radar Real Wind X Radar B Radar A GPS …. Radar A and Radar B location GPS …. Point X location Solve for the Real wind knowing the geometry and the Radar A and Radar B radial components. .
Wrap-up C Radar Coverage in Canada C Basic Interpretation C Conventional Radar C Severe Weather Signatures on Radar C New Radar Techniques… C Wrap-up
Severe Weather Climatology - All Event Types Summer Students Watchers Doppler CANWARN
Severe Weather Climatology - Tornado Number Watchers Doppler CANWARN Tornado Vs Downbursts Summer Students
Message Number Trends Goal - Minimum Number of Messages with the Best Verification. . . Event Observation Emphasis Diagnosis Emphasis
Event-Based Watch Verification Scores Better
Event-Based Warning Verification Scores Better
Lead Time in 1999 Better
Trends in Lead Time Better
Let’s Recap. . . Radar Coverage in Canada Basic Interpretation Conventional Radar Doppler Radar Severe Weather Signatures on Radar New Radar Techniques… Verification Wrap-up Questions?