R Squared www radicalmath orgPowerpointsRSquared ppt r 944


- Slides: 13
R Squared www. radicalmath. org/Powerpoints/RSquared. ppt
r = -. 944
y-hat = -0. 9402 x + 43. 721 y-hat = -0. 8141 x + 9. 1332 if x = 15, y-hat = ? if x = 6, y-hat = ? y-hat = -0. 9402(15) + 43. 721 y-hat = -0. 8141(6) + 9. 1332 y-hat = 29. 6195 y-hat = 4. 2486 Which value for Y is a more accurate prediction for the given X value?
To find how well the Line of Best Fit actually fits the data, we can find a number called R -Squared by using the following formula: 1 - Sum of squared distances between the actual and predicted Y values Sum of squared distances between the actual Y values and their mean
For example, here’s how to find the R Squared value for the data/graph below: X Y 3 40 10 35 11 30 15 32 22 19 22 26 23 24 28 22 28 18 35 6 Equation for Line of Best Fit: Correlation = -. 94 y-hat =. 94 x + 43. 7
Equation for Line of Best Fit: X Y 3 40 10 35 11 30 15 32 22 19 22 26 23 24 28 22 28 18 35 6 Mean: Predicted Y Value Error Sum: Error Squared y-hat =. 94 x + 43. 7 Distance between Y values and their mean Sum: Mean distances squared
Equation for Line of Best Fit: y-hat =. 94 x + 43. 7 Error Squared Distance between Y values and their mean Mean distances squared X Y Predicted Y Value 3 40 40. 88 . 77 14. 8 219. 04 10 35 34. 30 -. 70 . 49 9. 8 96. 04 11 30 33. 36 11. 29 4. 8 23. 04 15 32 29. 60 -2. 40 5. 76 6. 8 46. 24 22 19 23. 02 4. 02 16. 16 -6. 2 38. 44 22 26 23. 02 -2. 98 8. 88 . 64 23 24 22. 08 -1. 92 3. 69 -1. 2 1. 44 28 22 17. 38 -4. 62 21. 34 -3. 2 10. 24 28 18 17. 38 -. 62 . 38 -7. 2 51. 84 35 6 10. 80 4. 8 23. 04 -19. 2 368. 65 Mean: 25. 2 Sum: 91. 81 Sum: 855. 60
To calculate “R Squared”… 1 - Sum of squared distances between the actual and predicted Y values Sum of squared distances between the actual Y values and their mean 11 - 0. 11 91. 81 855. 60 =. 89
OK. Don’t kill me. Remember this was the data/graph we were finding “R Squared” for? The value we got for R Squared was. 89 Here’s a short-cut. To find R Squared… X Y 3 40 10 35 11 30 15 32 22 19 22 26 23 24 28 22 28 18 35 6 …Square r r = -. 944 r 2 = -. 944 • -. 944 r 2 =. 89
R Squared • To determine how well the regression line fits the data, we find a value called R-Squared (r 2) • To find r 2, simply square the correlation • The closer r 2 is +1, the better the line fits the data • r 2 will always be a positive number
r = -. 944 r 2 =. 89
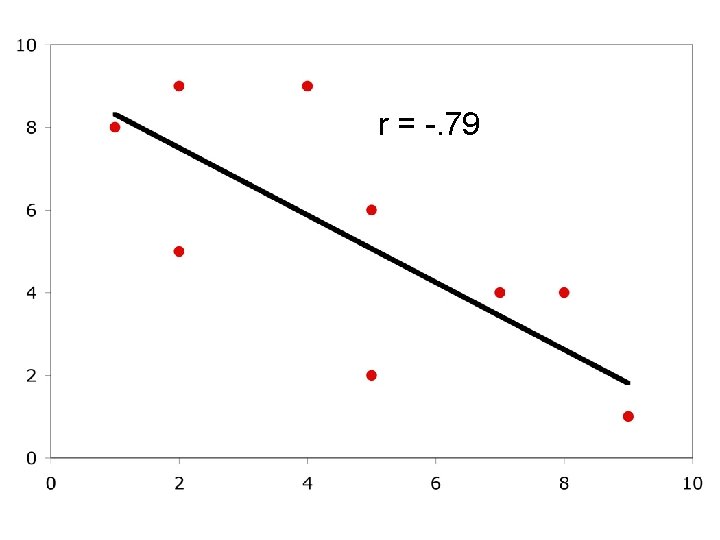
r = -. 79 r 2 =. 62