R C Bigelow Inc Bigelow Consumers are Bigelow

R. C. Bigelow, Inc.

Bigelow Consumers are. . .

Bigelow Flavored Teas Bigelow Tea represents 45% of Flavored Tea segment Source: ACNielsen Specialty Tea Category, 52 w/e January 12, 2002

Bigelow Herb Teas Bigelow Tea represents 17% of Herb Tea segment Source: ACNielsen Specialty Tea Category, 52 w/e January 12, 2002

Bigelow Green Teas Bigelow Tea represents 18% of the Green Tea segment Source: ACNielsen Specialty Tea Category, 52 w/e January 12, 2002

Bigelow Iced Teas Iced teas attract consumers to to the specialty tea category during summer months Primarily focused in southern markets but sold to Stop & Shop, Tops and Giant banners on an in/out basis

Bigelow Honey Spreads New product that now has 35% distribution and leverages the Bigelow name to a new category Unit volume has increased by 58. 5% over the latest 52 week period Bigelow Honey unit sales are up 49. 8% in Ahold Nielsen Markets over the latest 13 week period Source: ACNielsen Honey Category, 52 w/e September 29, 2001

Bigelow Dessert Coffees and Estate Teas

Total Tea Bag Category Specialty Tea 32. 0% $ 183. 8 Specialty Tea accounts for 46. 2% of the Total Tea Bag Category and has increased 83% since 1992! $ 390. 9 Black Tea 68. 0% $ 336. 1 1992 $574. 7 $ 391. 0 Black Tea 53. 8% Source: ACNielsen Total US 52 weeks ending 12/12/92 vs. 12/30/00 $ volume is in Millions Specialty Tea 46. 2. % 2000 $727. 1

Bigelow Food Service

Bigelow Leads the Market in Foodservice Traditional Foodservice Lipton 19% Office Coffee Service Market All Other 10% Bigelow 71% Bigelow 89% All Other 8% Lipton 3% The Bigelow Individual Foil Teabag works in Restaurants and Offices, as well as in Retail! Based on 2000 Poll of 100 top distributors Based on survey of top 10 Vend/OCS Distributors

Listing of Hotels Where Bigelow is the Exclusive “Specified” Specialty Tea

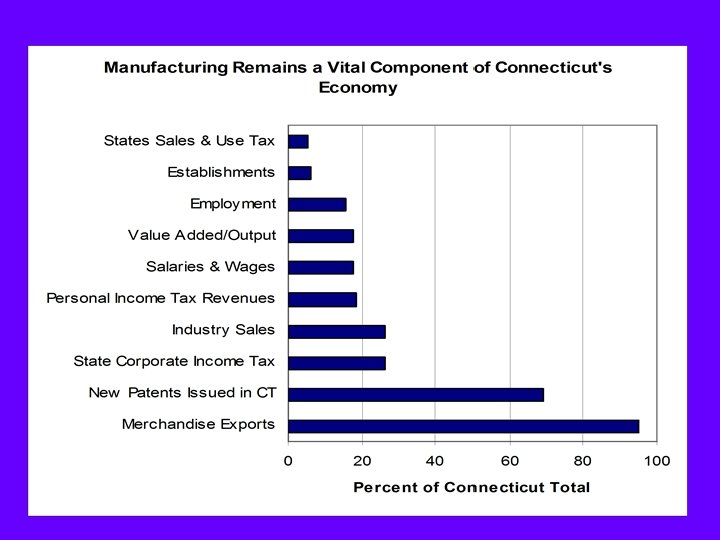
Manufacturing As a Component of the Connecticut Economy Establishments Employment Production Workers Total Annual Payroll ($billion) Average Hourly Wage ($) Value Added ($billion) Value of Shipments ($billion) Total Capital Expenditures ($billion) 5, 657 239, 720 144, 707 10. 7 16. 47 27. 1 45. 8 1. 7

Output V. Employment

Connecticut Manufacturing Employment Relative to the U. S. 1999 -200147

Employment Multipliers Industry Sector Employment Multiplier Manufacturing 2. 88 Finance, Insurance and Real Estate Transportation, Communication and Utilities Trade, Wholesale and Retail 2. 48 Services 1. 69 Government 1. 48 2. 42 1. 55

Segmentation

Competitive Ranking Weak Average Competitive Strength Strong
- Slides: 19