
R 3 S 1 1976 1980 Honeywell GCOS
- Slides: 38
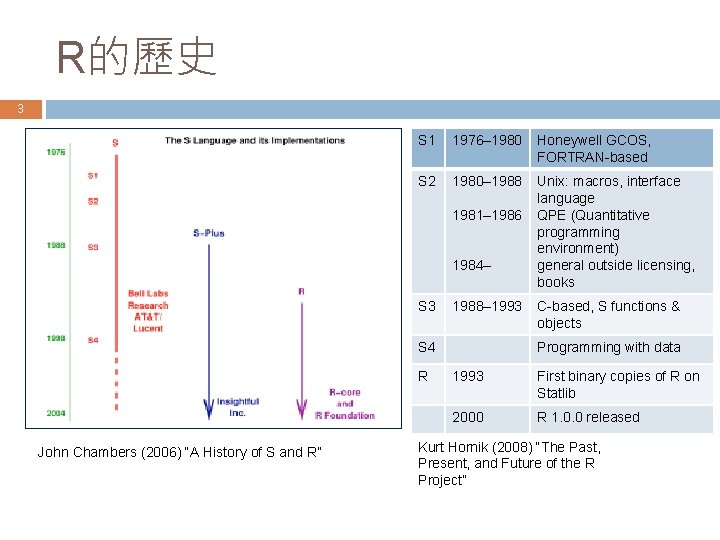
R的歷史 3 S 1 1976– 1980 Honeywell GCOS, FORTRAN-based S 2 1980– 1988 Unix: macros, interface language QPE (Quantitative programming environment) general outside licensing, books 1981– 1986 1984– S 3 1988– 1993 S 4 R John Chambers (2006) “A History of S and R” C-based, S functions & objects Programming with data 1993 First binary copies of R on Statlib 2000 R 1. 0. 0 released Kurt Hornik (2008) “The Past, Present, and Future of the R Project”
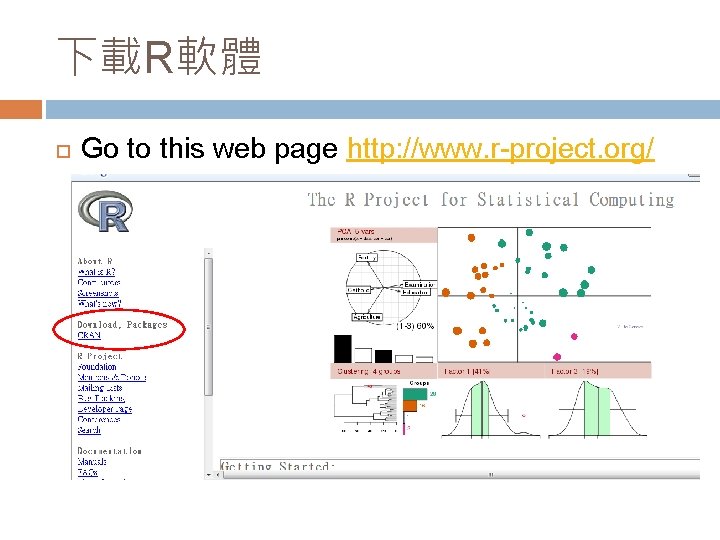
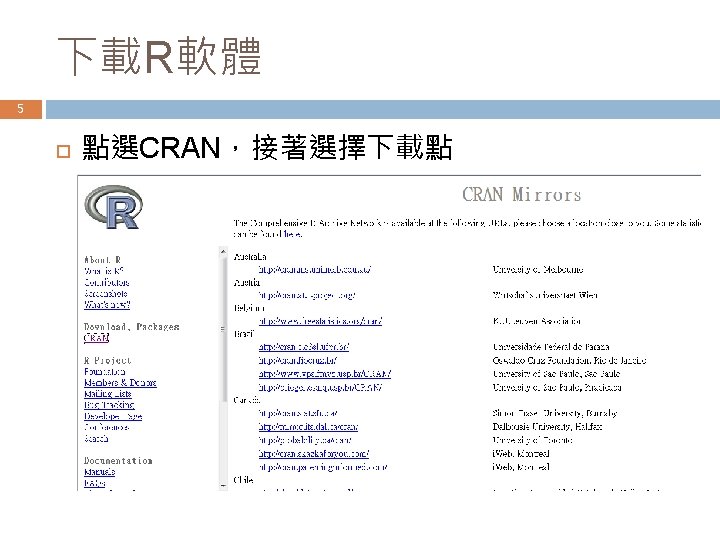
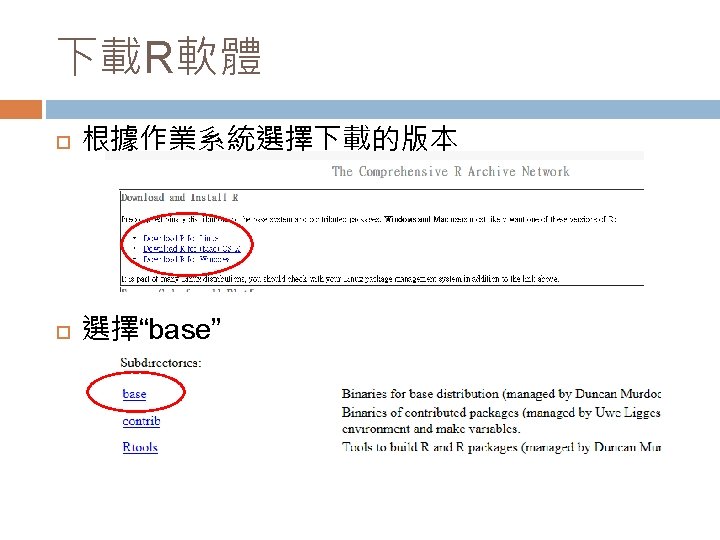
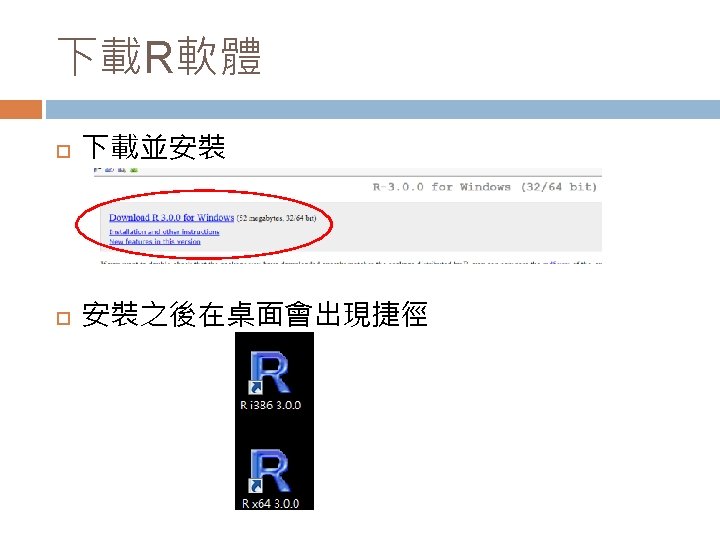
下載R軟體 Go to this web page http: //www. r-project. org/
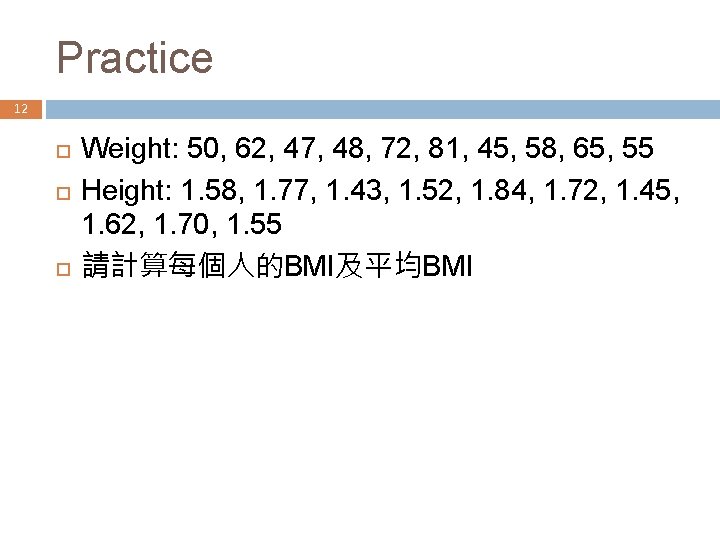
Practice 12 Weight: 50, 62, 47, 48, 72, 81, 45, 58, 65, 55 Height: 1. 58, 1. 77, 1. 43, 1. 52, 1. 84, 1. 72, 1. 45, 1. 62, 1. 70, 1. 55 請計算每個人的BMI及平均BMI
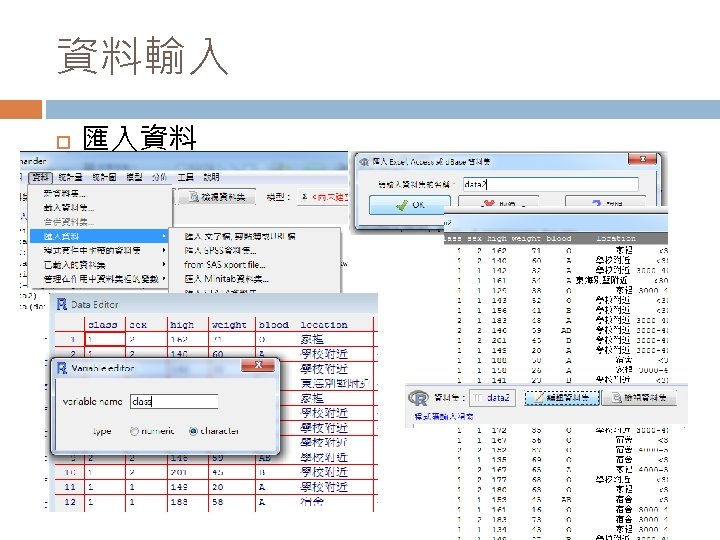
練習 請讀入EXCEL檔案“class-demo”,並將其命名 為data 2 請更改data 2中,變數class、sex為character
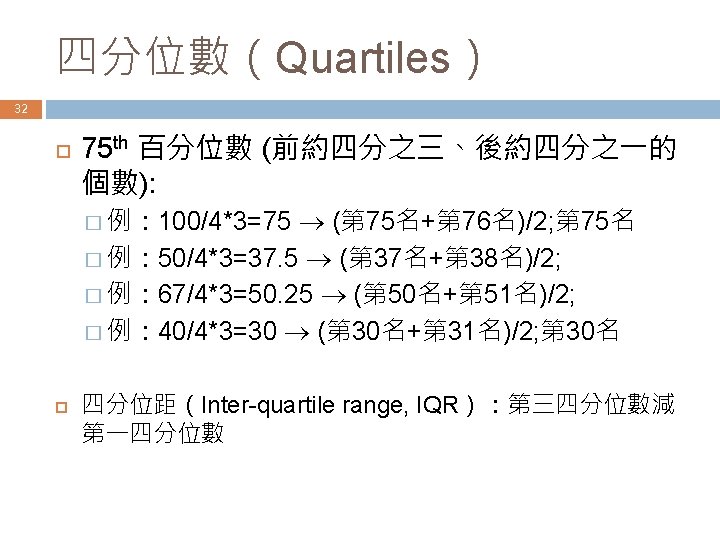
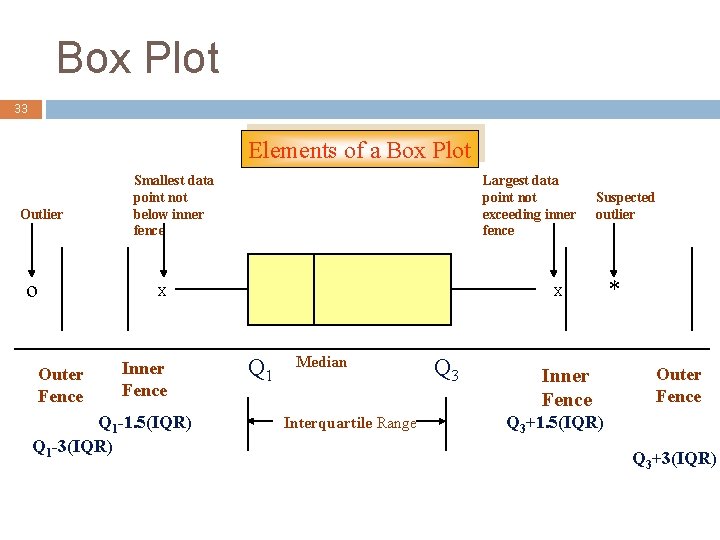
Box Plot 33 Elements of a Box Plot Outlier o Smallest data point not below inner fence Largest data point not exceeding inner fence X Outer Fence Inner Fence Q 1 -1. 5(IQR) Q 1 -3(IQR) Suspected outlier X Q 1 Median Interquartile Range Q 3 Inner Fence * Outer Fence Q 3+1. 5(IQR) Q 3+3(IQR)
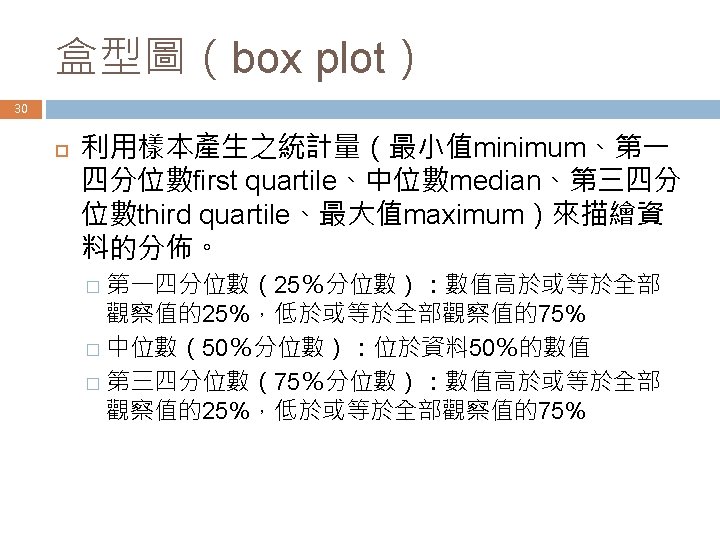
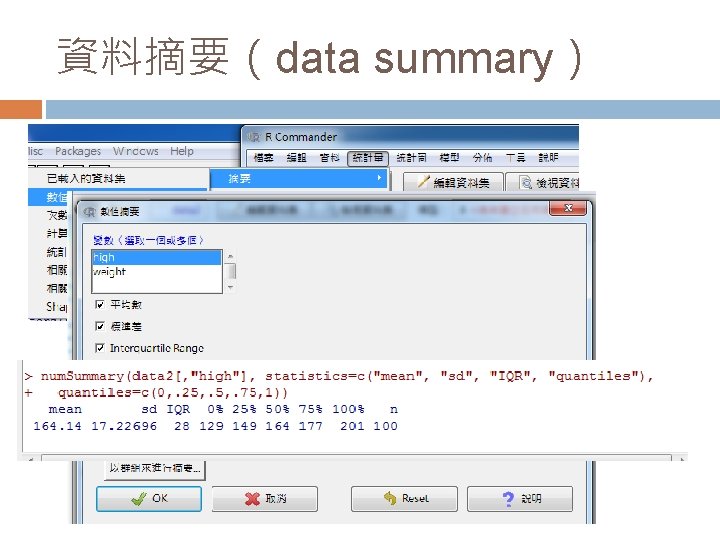
資料摘要(data summary)