Quit 2 Dimensional graphs 3 Dimensional graphs Functions


 9 8 (2, 7) 7 6 5 (0, (– 1,")

 12 (0, 12) 10 8 (1, 6) 6 4")

 3 2 1 (0, –")

 -2 (2, 0) (3, 0) 1")


- Slides: 25
Quit
2 Dimensional graphs 3 Dimensional graphs Functions and graphs Graphing functions Quit
y 5 y = x 2 4 3 y = x 4 2 1 -5 y=x 3 y=x Quit -4 -3 -2 -1 1 -1 -2 -3 -4 -5 2 3 4 5 x
y 5 Circle Ellipse 4 3 2 1 -5 -4 -3 -2 -1 1 2 3 4 -1 -2 2 2 x +y =9 Quit -3 -4 -5 2 y __ x + =1 9 2 5 x
Three dimensions Sphere Quit 2 2 2 x y z __ __ __ + + =1 4 4 4
Three dimensions Cigar shape Quit 2 y __ 2 2 x + +z =1 9
Three dimensions Flying saucer Quit 2 2 x z __ 2 __ +y + =1 9 9
y 5 By observation a lot can be deduced about a graph, if both powers of x and y are one, it is always a straight line -5 -4 y=x+1 -3 -2 4 3 2 1 -1 -2 -3 Quit -4 -5 2 3 4 5 x
y 5 y + 1 = x 2 4 3 2 If one power of x or y is one and the other is -4 with -3 -2 two it’s-5 a curve one bend 1 -1 -2 -3 Quit -4 -5 2 3 4 5 x
y 5 y = x 3 – 3 x 2 – x + 3 4 3 2 If one power of x or y is one and the other is -4 -3 three it’s-5 a curve with-2 two bends 1 -1 -2 -3 Quit -4 -5 2 3 4 5 x
y 5 y = x 4 – 5 x 3 + 5 x 2 + 4 x – 44 3 2 If one power of x or y is one and the other is -4 -3 four it’s-5 a curve with-2 three bends 1 -1 -2 -3 Quit -4 -5 2 3 4 5 x
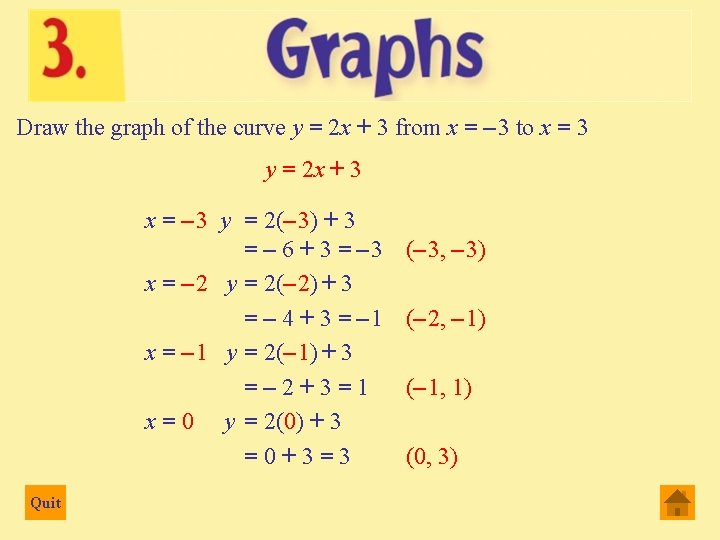
Draw the graph of the curve y = 2 x + 3 from x = – 3 to x = 3 y = 2 x + 3 x=1 x= 2 x= 3 Quit y = 2(1) + 3 =2+3=5 y = 2( 2) + 3 =4+3=7 y = 2(3) + 3 =6+3=9 (1, 5) ( 2, 7) (3, 9)
y 10 (3, 9) 9 8 (2, 7) 7 6 5 (0, (– 1, 1) -3 (– 2, – 1) (– 3, – 3) Quit -2 (1, 5) 4 3) 3 2 1 -1 -1 -2 -3 -4 1 2 3 y = 2 x + 3 x
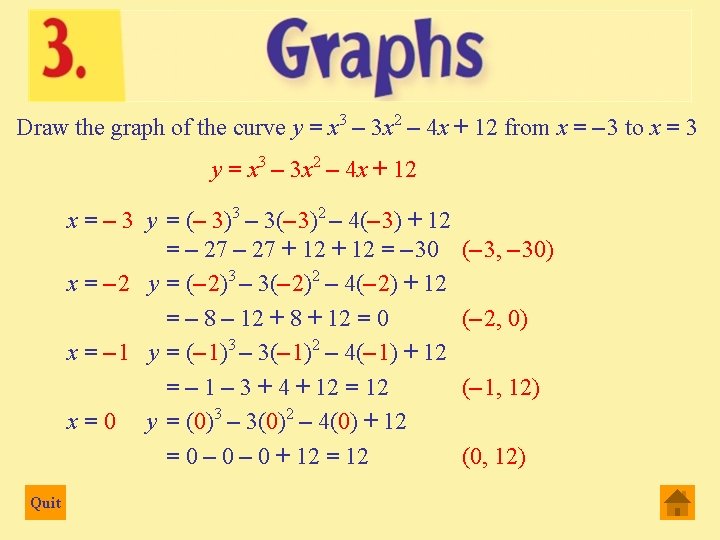
Draw the graph of the curve y = x 3 – 3 x 2 – 4 x + 12 from x = – 3 to x = 3 y = x 3 – 3 x 2 – 4 x + 12 x=1 x=2 x=3 Quit y = (1)3 – 3(1)2 – 4(1) + 12 = 1 – 3 – 4 + 12 = 6 y = (2)3 – 3( 2)2 – 4( 2) + 12 = 8 – 12 + 8 + 12 = 0 y = (3)3 – 3(3)2 – 4(3) + 12 = 27 – 12 + 12 = 0 (1, 6) ( 2, 0) (3, 0)
y 14 (– 1, 12) 12 (0, 12) 10 8 (1, 6) 6 4 2 (– 2, 0) -3 -2 -1 1 -2 Quit (2, 0) -4 (3, 0) 3 2 4 y = x – 3 x – 4 x + 12 x
Draw the graph of the curve x 2 + y 2 = 9 x=0 (0)2 + y 2 = 9 (0, 3) y=0 x 2 + (0)2 = 9 Quit (0, – 3) x 2 = 9 (3, 0) y= 3 (– 3, 0) x= 3
y Circle r = 3 5 4 (3, 0) 3 2 1 (0, – 3) -5 -4 -3 -2 -1 (0, 3) 1 -1 -2 -3 2 Quit 2 x +y =9 -4 -5 (– 3, 0) 2 3 4 5 x
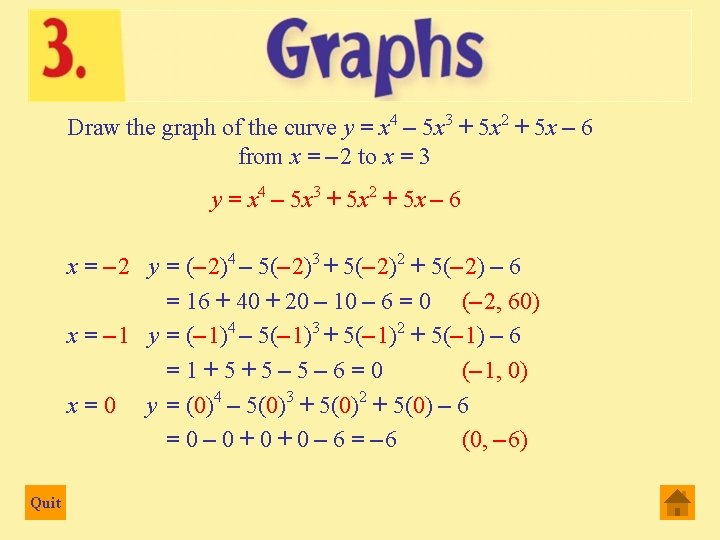
Draw the graph of the curve y = x 4 – 5 x 3 + 5 x 2 + 5 x – 6 from x = – 2 to x = 3 y = x 4 – 5 x 3 + 5 x 2 + 5 x – 6 x=1 x=2 x=3 Quit y = ( 1)4 – 5(1)3 + 5( 1)2 + 5(1) – 6 = 1 – 5 + 5 – 10 – 6 = 0 (1, 0) y = (2)4 – 5(2)3 + 5(2)2 + 5(2) – 6 = 16 – 40 + 20 + 10 – 6 = 0 (2, 0) y = (3)4 – 5(3)3 + 5(3)2 + 5(3) – 6 = 81 – 135 + 45 + 15 – 6 = 0 (3, 0)
y 5 4 3 2 (– 1, 0) -2 (2, 0) (3, 0) 1 0) (1, 1 -1 2 3 4 x -1 -2 -3 -4 -5 Quit -6(0, -7 y = x 4 – 5 x 3 + 5 x 2 + 5 x – 6)
2 2 y x Draw the graph of the curve __ + __ = 1 9 4 2 2 y x __ __ + =1 9 4 x=0 y=0 Quit 2 y __ = 1 y 2 = 9 y= 3 9 (0, 3) (0, – 3) 2 x __ = 1 x 2 = 4 x= 2 4 (2, 0) (– 2, 0)
2 y 2 x __ y __ + =1 4 9 Ellipse 3 (0, 3) 2 1 (– 2, 0) -2 -1 (2, 0) 1 2 -1 -2 -3 Quit (0, – 3) x
Do you want to end show? Yes No