Quick introduction to Land Degradation Neutrality LDN 2
 2 November 2018 Barron Joseph Orr")


: Requests the")


- Slides: 22
Quick introduction to Land Degradation Neutrality (LDN) 2 November 2018 Barron Joseph Orr
Land Degradation Neutrality “A state whereby the amount and quality of land resources necessary to support ecosystem functions and services and enhance food security remain stable or increase within specified temporal and spatial scales and ecosystems” UNCCD COP 12 October 2015
Vision of LDN The vision of LDN is keeping land in balance in order to ensure food security, healthy ecosystems and human wellbeing.
Vision of LDN In LDN, what do we want to maintain? In order to achieve healthy ecosystems, food security and human wellbeing, we want to maintain land-based natural capital and the ecosystem services that flow from it… …for each land type (a principle of LDN known as “like for like”)
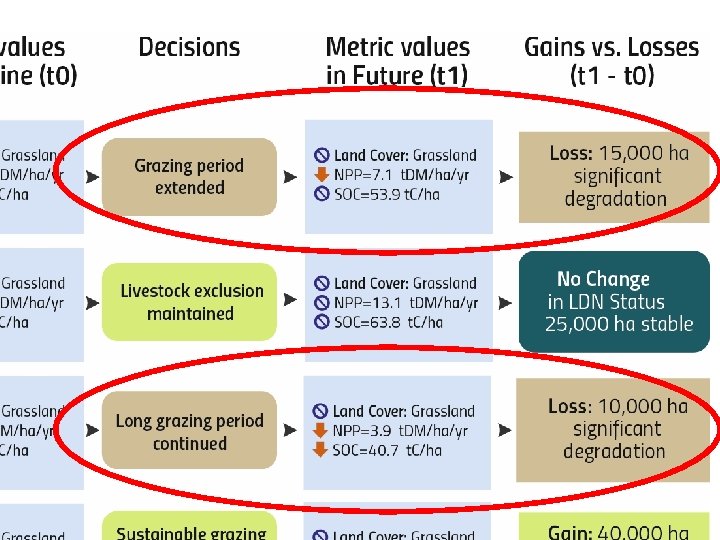
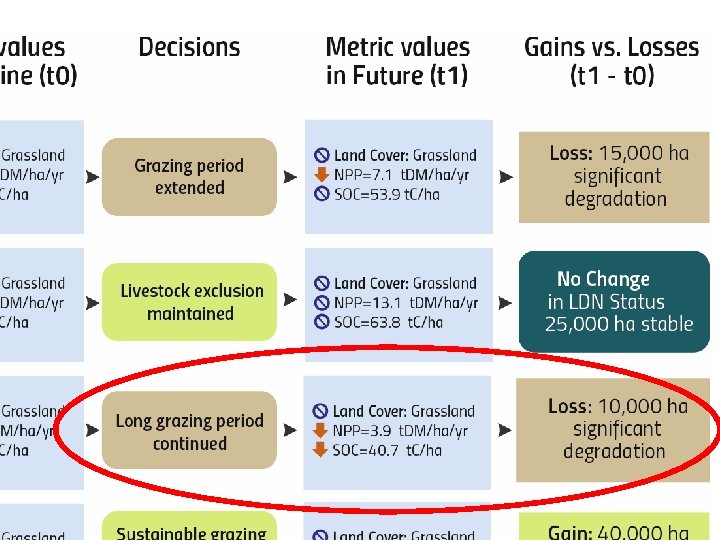
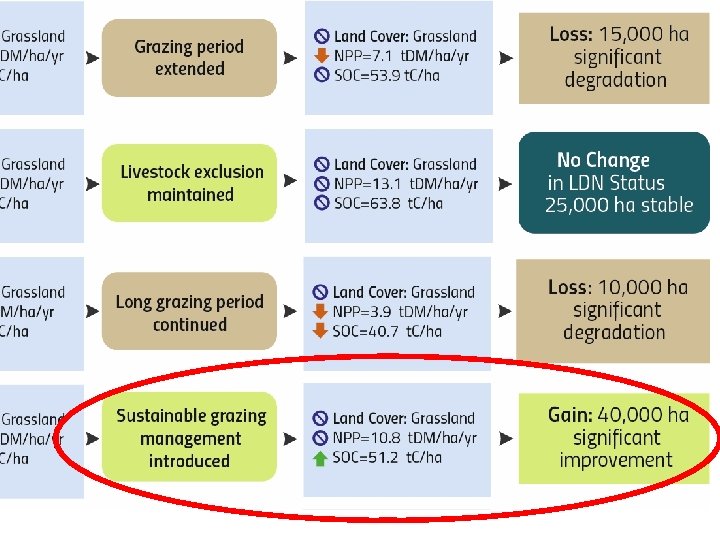
Mechanism for achieving neutrality Neutrality = no net loss compared to the reference state (baseline) Baseline is NOW (current condition) Counterbalancing future land degradation (anticipated losses) through planned measures to achieve equivalent gains elsewhere within the same land type “like for like”
Integrated land use planning LDN planning involves anticipating where degradation is likely so that the optimal mix of interventions across the landscape to achieve neutrality can be pursued. Leverage existing land use planning
Response Hierarchy Prevention is better than cure Avoiding degradation is the highest priority, followed by reducing degradation and finally reversing past degradation
Monitoring LDN status Monitoring LDN is designed to tell us how we are doing so that mid-course corrections can be made in our land use and management planning. While the indicators used for monitoring can be also be used for the preliminary assessments, it is important to recognize these are two entirely independent processes.
Round 1: the indicators, their metrics, and the global default data sets contributed Indicator Metrics Data sources SO 1 -1: Trends in land cover Land cover change ESA Climate Change Initiative Land Cover dataset (http: //maps. elie. ucl. ac. be/CCI/viewer/) • 300 m resolution • Temporal coverage: • 3 epochs 2000, 2005 and 2010 (v 1. 6. 1) Used for LDN TSP • annual maps from 1992 -2015, released in April 2017 (v 2. 0. 7) made available to all countries for UNCCD reporting • 22 classes aggregated to 6 classes for UNCCD reporting SO 1 -2: Trends in land productivity or functioning of the land Land productivity dynamics (LPD) JRC LPD (http: //wad. jrc. europa. eu/) • 1 km resolution • Temporal coverage: 1999 -2013 • 5 classes SO 1 -3: Trends in carbon stocks above and below ground Soil organic carbon (SOC) stocks ISRIC Soil. Grids 250 (https: //soilgrids. org/#!/? layer=TAXNWRB_250 m&vector=1) • 250 m resolution • Temporal coverage: Based on legacy soil data points. Change estimates based on land cover data • Continuous data Date
Mandate and rationale for using default data • • Mandate (dec. 22/COP/11): Requests the secretariat to provide affected country Parties with national estimates of each respective metrics of the progress indicators based on available data sources through the PRAIS portal and urges affected country Parties to subsequently verify or replace these national estimates using data sourced/computed nationally/locally Values • Harmonisation and standardisation across countries in reporting • Reporting of nationally determined figures • Evolution of reporting cycles along with data and science • Distinction between what is preparation for reporting (i. e. assessment, monitoring, data analysis, interpretation) and the actual official reporting Harmonization and comparability Country ownership Date
Criteria for selection of default data • Requirements for default data • Temporal coverage • i. e. availability of reasonably long time series, at least two or more epochs, regular intervals • Timeliness • • • i. e. availability of future updates at regular intervals Global coverage Sufficient resolution Clear methods (supported in scientific literature) Accessible & available Harmonization and comparability Country ownership Date
Default global Land Cover data
Default Land Productivity Dynamics data Title of Presentation
Default global Soil Organic Carbon stocks data Title of Presentation
Monitoring the LDN indicators
Proportion degraded land definition SDG Target 15. 3: “By 2030, combat desertification, restore degraded land soil, including land affected by desertification, drought and floods, and strive to achieve a land-degradation neutral world” SDG Indicator 15. 3. 1: Proportion of land that is degraded over total land area. Upgraded in November 2017 by IAEG-SDG to Tier 2 status (i. e. “Indicator is conceptually clear, has an internationally established methodology and standards are available, but data are not regularly produced by countries”) Date
One out all out rule • A location is considered degraded if at least one of the three indicators shows a negative change (i. e. is degraded). • This is the ‘one out, all out’ method of indicator integration • A precautionary measure - stability or improvements in land condition in any one indicator cannot compensate for degradation in the others. • Applied because the indicators are complementary – not additive. Date
Thank you! Web: www. unccd. int Twitter: @UNCCD Facebook: www. facebook. com/UNCCD
Further information • Orr, B. J. , A. L. Cowie, V. M. Castillo Sanchez, P. Chasek, N. D. Crossman, A. Erlewein, G. Louwagie, M. Maron, G. I. Metternicht, S. Minelli, A. E. Tengberg, S. Walter, and S. Welton (2017). Scientific Conceptual Framework for Land Degradation Neutrality. A Report of the Science -Policy Interface. http: //www 2. unccd. int/publications/scientific-conceptual-framework-landdegradation-neutrality • UNCCD/Science-Policy Interface (2016). Land in Balance: Scientific Conceptual Framework for Land Degradation Neutrality. Science. Policy Brief 02 - September 2016. http: //www. unccd. int/Lists/Site. Document. Library/Publications/10_2016_spi _pb_multipage_eng. pdf • Cowie, A. L. , Orr, B. J. , Sanchez, V. M. C. , Chasek, P. , Crossman, N. D. , Erlewein, A. , Louwagie, G. , Maron, M. , Metternicht, G. I. , Minelli, S. and Tengberg, A. E. , (2018). Land in balance: The scientific conceptual framework for Land Degradation Neutrality. Environmental Science & Policy, 79, pp. 25 -35. https: //www. sciencedirect. com/science/article/pii/S 1462901117308146