Quick Graphs Using Slope Intercept Form Important Slope


 y = x y = mx + b")


- Slides: 15
Quick Graphs Using Slope. Intercept Form
Important!!! Slope – Intercept Form y = mx + b m represents the slope b represents the y-intercept
Writing Equations When asked to write an equation, you need to know two things – slope (m) and y-intercept (b).
Example 1: Writing Equations Write an equation in slope-intercept form of the line that has a slope of 2 and a y-intercept of 6. To write an equation, you need two things: slope (m) = 2 y – intercept (b) = 6 We have both!! Plug them into slope-intercept form y = mx + b y = 2 x + 6
Writing Equations Write an equation in slope-intercept form for the following: 1. 3. 2. 4.
Write the equation of a line that has a y-intercept of -3 and a slope of -4. y = -3 x – 4 2. y = -4 x – 3 3. y = -3 x + 4 4. y = -4 x + 3 1.
To find the slope and y-intercept of an equation, write the equation in slope-intercept form: y = mx + b. Find the slope and y-intercept. 1) y = 3 x – 7 y = mx + b m = 3, b = -7
Find the slope and yintercept. 2) y = x y = mx + b y= x+0 3) y = 5 y = mx + b y = 0 x + 5 m= b=0 m=0 b=5
Find the slope and y-intercept of y = -2 x + 4 m = 2; b = 4 2. m = 4; b = 2 3. m = -2; b = 4 4. m = 4; b = -2 1.
Example 2: Graphing Using Slope and y-Intercept When given an equation, you can easily graph it in slope-intercept form. All you need is two things– the slope (m) and y-intercept (b).
Graphing Using Slope and y-intercept ØStep 1: Make sure the equation is in slope-intercept form ØStep 2: Find the slope and yintercept ØStep 3: Plot the y-intercept ØStep 4: Apply the slope (rise/run) to the y-intercept
Review: Graphing with slopeintercept -3 1. 2. 3. 4. Start by graphing the y-intercept (b = 2). From the yintercept, apply “rise over run” using your slope. rise = 1, run = -3 Repeat this again from your new point. Draw a line through 1 -3 1 Start here
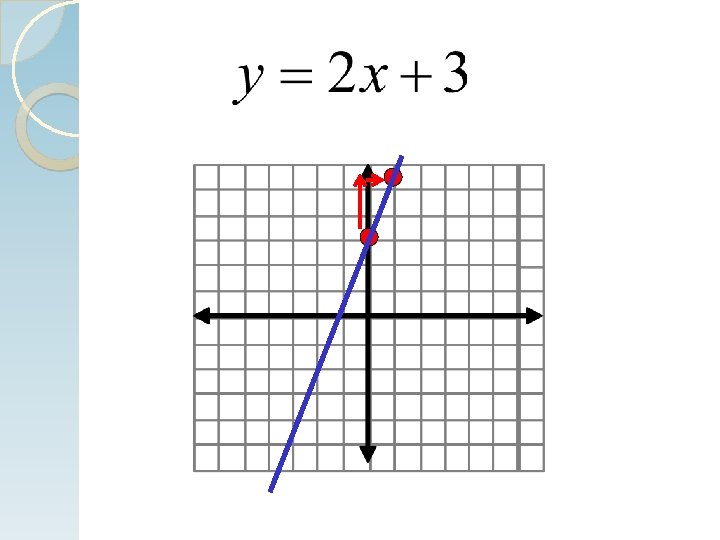
Graph: Step 1: y=mx+b Step 2: slope = 2 y-intercept = 3 Step 3: plot the y-intercept on a graph Step 4: apply the slope
Graph the following equations: