Questions with Tables using a calculator Which equation
")
Questions with Tables (using a calculator)

Which equation best describes the relationship between the corresponding values of x and y shown in the table? A y = x – 10 B y = 2 x – 8 C y = 3 x – 6 D y = x 2 – 8 Obj 1 - TAKS 2004 9 th [A. B 1(B)] Problem

Use the table to determine the expression that best represents the number of diagonals of any convex polygon having n sides. A B C D Problem #16 Obj 6 - TAKS 2004 11 th [G. C 1(A)]

Which equation best describes the relationship between x and y in the table to the right? A. B. C. D. Obj 1 - TAKS 2003 10 th [A. B 1(B)] Problem #24

Rita put some hummingbird feeders in her backyard. The table shows the number of hummingbirds that Rita saw compared to the number of feeders. Which equation best describes the relationship between h, the number of hummingbirds, and f, the number of feeders? A h = 2 f + 1 B f = 2 h + 1 C h=f+2 D Obj 4 - TAKS 2004 10 th [A. C 3(A)] Problem

A math club decided to buy T-shirts for its members. A clothing company quoted the prices, found in the chart at the right, for the T-shirts. Which equation best describes the relationship between the total cost, c, and the number of T-shirts, s? A. c = 6. 75 s B. c = 7. 00 s C. c = 2 s – 20 D. c = 15 + 6 s Problem Obj 3 - TAKS 2003 9 th [A. C 1(C)]

Which equation best describes the relationship between x and y shown in the table to the right? A y = 3 x B x = 3 y C x = 3 y 2 D y = 3 x 2 Obj 1 - TAKS 2004 11 th [A. B 1(B)] Problem
 in the table")
Which expression can be used to find the values of s(n) in the table below? A 3 n B 5 n C n+4 D 3 n + 2 Obj 2 - TAKS 2004 10 th [A. B 3(B)] Problem

An equation can be used to find the total cost of buying square-foot tiles to cove an area of floor. Using the table to the right, find the equation that best represents y, the total cost, as a function of x, the number of square feet to be covered. A. x = 0. 35 y B. y = 0. 35 x C. x = 2. 86 y D. y = 2. 86 x Obj 1 - TAKS 2003 11 th [A. B 1(B)] Problem #27

Troy borrowed money from his father so that he could buy a used car. The table shows the remaining balance, b, of Troy’s loan after each payment. Which function can be used to describe this relationship? A b = 3910 – 225 p B b = 4135 – 225 p C b = 2785 + 225 p D b = 3685 – 225 p Obj 1 - TAKS 2004 10 th [A. B 1(B)] Problem

Which equation could be used to generate this table of values? A y = – 2 x B y = 2 x + 1 C y=x+1 D y = x 2 + 1 Obj 1 - TAKS 2004 9 th [A. B 1(B)] Problem #12

Which graph best represents the relationship shown in the table below? Obj 1 - TAKS 2006 11 th [A. B 1(D)] Problem #44
![Obj 1 - TAKS 2006 11 th [A. B 1(D)] Problem #44](http://slidetodoc.com/presentation_image_h2/6d353e1b16fb29c259b9c60621d4a461/image-13.jpg "Obj 1 - TAKS 2006 11 th [A. B 1(D)] Problem #44")
Obj 1 - TAKS 2006 11 th [A. B 1(D)] Problem #44

Which table best describes points on the line graphed below? Obj 3 - TAKS 2006 10 th [A. C 1(C)] Problem
![Obj 3 - TAKS 2006 10 th [A. C 1(C)] Problem](http://slidetodoc.com/presentation_image_h2/6d353e1b16fb29c259b9c60621d4a461/image-15.jpg "Obj 3 - TAKS 2006 10 th [A. C 1(C)] Problem")
Obj 3 - TAKS 2006 10 th [A. C 1(C)] Problem

Students in a science class recorded lengths of a stretched spring , as shown in the table to the right. Which equation best represents the relationship between distance stretched, x, and the weight on the spring, y? A. B. C. D. Obj 1 - TAKS 2003 9 th [A. B 1(B)] Problem

The table shows the number of slices of pepperoni placed on each size of pizza at Pepe’s Pizza Shop. Let r represent the radius of the pizza ands let n represent the number of slices of pepperoni. Identify the equation that best represents the relationship between the radius and the number of slices of pepperoni. A. r = 2 n + 1 B. n = 2 r + 1 C. r = n 2 + 1 D. n = r 2 + 1 Obj 1 - TAKS 2003 11 th [A. B 1(B)] Problem

In many parades, flowers are used to decorate the floats. The table below shows the number of flowers used in each row of a parade float. Which equation best describes these data? A. n = 2 r + 52 B. n = r + 54 C. n = 4 r + 50 D. n = 4 r + 54 Obj 1 - TAKS 2006 9 th [A. B 1(B)] Problem

The table below shows the relationship between p, the number of cell phones a company produces, and d, the number of cell phones that are defective. Which equation can be used to describe this relationship? F. d = 20 p G. d = 0. 05 p H. d = J. d = p − 95 Obj 1 - TAKS 2006 10 th [A. B 1(B)] Problem

Which data set is best described by the function y 2 = − 2 x + 5 x? Obj 1 - TAKS 2006 10 th [A. B 1(D)] Problem

Casey conducted an experiment and recorded the data in the table shown below. Which equation best describes these data? F. G. H. J. y=x y = 2 x − 1 2 y=x +x− 1 y = (x − 1)2 + 1 Obj 1 - TAKS 2006 11 th [A. B 1(B)] Problem

According to the data shown below, which would be the best prediction of the number of passengers at the International Jetport for the year 2008? A. B. C. D. 70. 1 million 68. 5 million 74. 8 million 78. 0 million Obj 1 - TAKS 2006 11 th [A. B 1(E)] Problem

Matt is a speed skater. His coach recorded the following data during a timed practice period. If Matt continues to skate at the rate shown in the table, what is the approximate distance in meters he will skate in 25 seconds? A 250 m B 175 m C 150 m D 278 m Obj 3 - TAKS 2004 11 th [A. C 2(G)] Problem

The algebraic form of a linear function is , where d is the distance in miles and l is the number of laps. Which of the following choices identifies the same linear function? A. For every 4 laps on the track, an athlete runs 1 mile. B. For every lap on the track, an athlete runs mile. C D. Obj 3 - TAKS 2003 11 th [A. C 1(C)] Problem

The table below shows various values for x and y. Which equation best describes the relationship between x and y? A. y = − 3 x + 5 B. y = − 5 x – 7 C. y = −x + 17 D. y = 3 x + 41 Obj 3 - TAKS 2006 9 th [A. C 1(C)] Problem

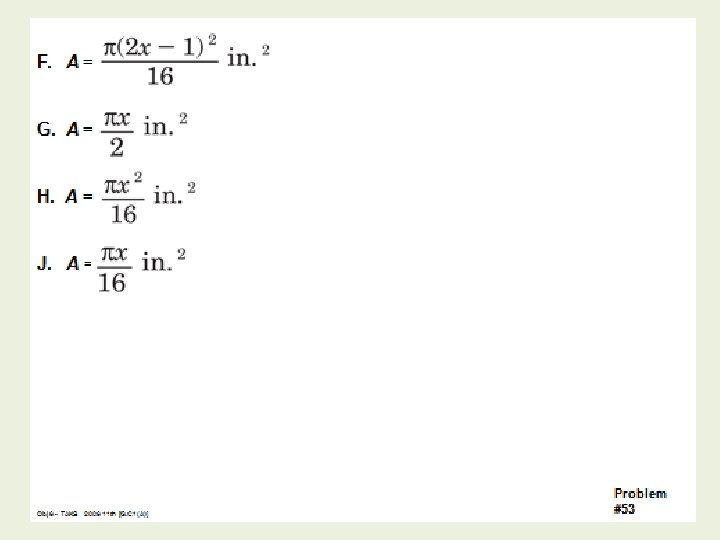
The figure below shows a conical cup containing water. The water depth can be represented by x, and the area of the water surface can be represented by A. As the water depth changes, the area of the water surface changes, as shown in the table below. Which equation best represents the relationship between the area of the water surface and the water depth? Problem #53 Obj 6 - TAKS 2006 11 th [G. C 1(A)]
- Slides: 27