Quaternary Environments Ecosystem Pattern and Process Conservation Issues


 Losses from disturbed watershed")


 Ø Net primary productivity (NPP)")


- Slides: 30
Quaternary Environments Ecosystem Pattern and Process Conservation Issues
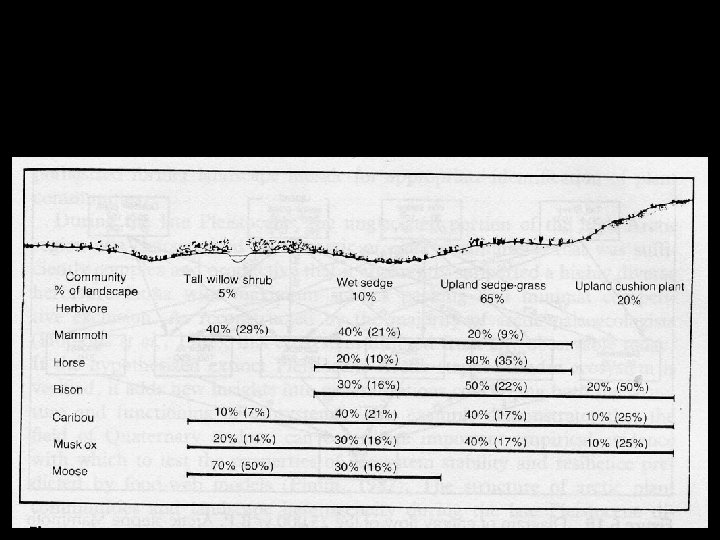
Patterns on the Landscape T Patterns of vegetation distribution T Scale Issues T Modern Issues T Fragmentation T Barriers to migration T Barriers to propagation
Patterns on the Landscape
World Population Fig. 1 -1 p. 2
Human Disturbance Arctic Circle Tropic of Cancer Equator Tropic of Capricorn Antarctic Circle Predominantly natural Partially disturbed Human dominated
North America by Night
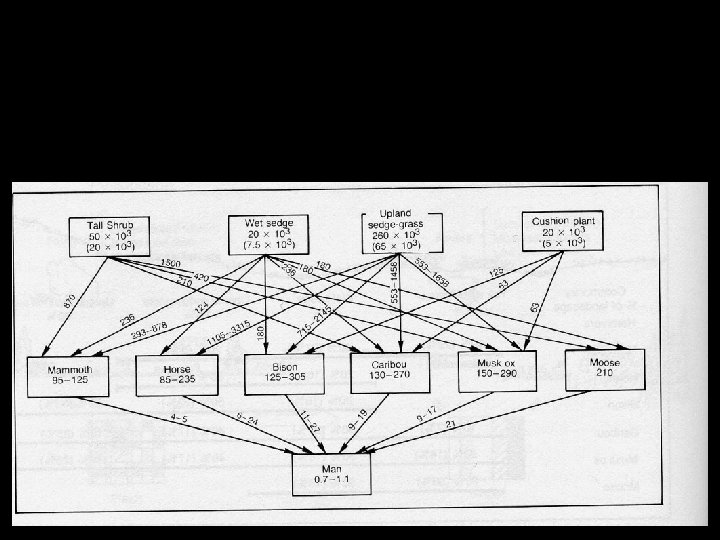
Food Webs T Trophic Levels T Food Chains T Food Webs
Food Web Human Blue whale Sperm whale Killer whale Elephant seal Crabeater seal Leopard seal Emperor penguin Adélie penguins Petrel Squid Fish Carnivorous plankton Herbivorous zooplankton Krill Phytoplankton
Food Chain
Broad-winged hawk Deciduous Forest. Hairy Animals Producer to primary consumer woodpecker Primary to secondary consumer Gray squirrel White oak White-tailed deer White-footed mouse Metallic woodboring beetle wood-boring and larvae beetle and Mountain winterberry Shagbark hickory May beetle Fungi Bacteria Long-tailed weasel Racer Wood frog Secondary to higher-level consumer All producers and consumers to decomposers
The Demise of Bison 1500 1850 1870 1880 1906
Effects of Experimental Logging on Nitrate Levels (Hubbard-Brook Experimental Forest) Losses from disturbed watershed 11 Concentration (mg/liter -1) 9 7 Time of deforestation 5 Losses from undisturbed watershed 3 1 0 J J A S O ND J F M A M J J A S O N DJ F M AM 1965 1966 1967 1968
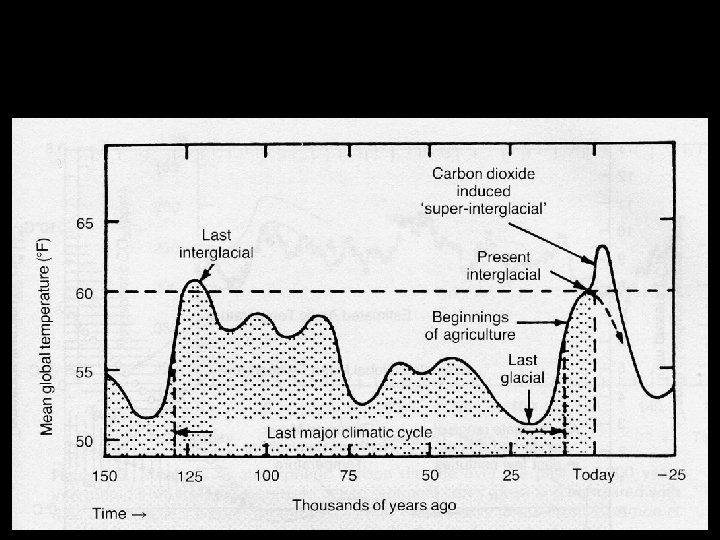
Atmospheric CO 2 for the Past 150, 000 Years
Gross Primary Productivity
Preserve Boundaries
Public Lands
Natural Resource Depletion; Americans Grizzly bear More than 60% of the Pacific Northwest coastal forest has been cut down NORTH AMERICA 40% of North America’s range and cropland has lost productivity California condor Hawaiian monk seal Eastern cougar Spotted owl Blackfooted Florida ferret panther Mangroves cleared in Equador for shrimp ponds Endangered species 6. 0 or more children per woman Fish catch in the north-west Atlantic has fallen 42% since its peak in 1973 Chesapeake Bay is overfished and polluted Golden toad Coral reef destruction Every year 14, 000 square kilometers of rain forest is destroyed in the Amazon Basin Columbia has lost one-third of its forest PACIFIC OCEAN Vanishing biodiversity Humpback whale Manatee Much of Everglades National Park has dried out and lost 90% of its wading birds Kemp’s ridley turtle Half of the forest in Honduras and Nicaragua has disappeared Environmental degradation St. Lawrence beluga whale Black lion tamarin SOUTH AMERICA Southern Chile’s rain forest is threatened Little of Brazil’s Atlantic forest remains ATLANTIC OCEAN
Natural Resource Depletion; Old World Poland is one of the world’s most polluted countries Imperial eagle 640, 000 square kilometers south of the Sahara have turned to desert since 1940 EUROPE Mediterranean Many parts of former Soviet Union ASIA are polluted with industrial and radioactive waste Central Asia from the Middle East to China has lost 72% of range Giant and cropland panda Area of Aral Sea has Shrunk 46% Snow leopard Japanese timber imports are responsible for much of the world’s tropical deforestation Saudi Arabia Deforestation in the Himalaya Asian causes flooding in Bangladesh Liberia elephant Oman Kouprey Eritrea Mali AFRICA Yemen 90% of the coral reefs India and are threatened in the Burkina Niger Ethiopia Sri Lanka Philippines. All virgin Faso Benin Chad Golden have almost forest will be gone Sierra tamarin no rain Nigeria by 2010 Leone forest left Togo Congo Uganda Sao Tome Rwanda Somalia In peninsular Malaysia 68% of the Queen Alexandra’s Burundi almost all forests have Birdwing butterfly Congo’s Angola been cut rain forest Indonesia’s is slated Zambia coral reefs are Nail-tailed for cleaning INDIAN OCEAN threatened wallaby and Aye-aye Fish catches in mangrove AUSTALIA Black Southeast Atlantic forests Madagascar has have dropped by more rhinoceros Much of have been lost 66% of its than 50% since 1973 Australia’s cut in half tropical forest range and cropland have turned to desert Blue whale A thinning of the ozone layer occurs over Antarctica during summer ANTARCTICA
Ecological Pyramids
Primary Productivity of Ecosystems Ø Gross primary productivity (GPP) Ø Net primary productivity (NPP)
Community Structure: Appearance and Species Diversity Ø Stratification Ø Species diversity Ø Species abundance Ø Niche structure Ø Edge effects
Primary Succession
Secondary Succession