Quartile Deviation Dr Mitali Gupta Dr Ambedkar Institute

Quartile Deviation Dr. Mitali Gupta Dr. Ambedkar Institute of Management Studies & Research

What is Quartile Deviation � The Quartile Deviation is a simple way to estimate the spread of a distribution about a measure of its central tendency (usually the mean).
 into two")
Quartile � A median divides a given dataset (which is already sorted) into two equal halves similarly, the quartiles are used to divide a given dataset into four equal halves. Therefore, logically there should be three quartiles for a given distribution, but the second quartile is equal to the median itself!

First and Third Quartile � The first quartile or the lower quartile or the 25 th percentile, also denoted by Q 1. � Similarly, the third quartile or the upper quartile or 75 th percentile, also denoted by Q 3.

Advantages: � Quartile Deviation is easy to calculate numerically. � Calculation for QD involves only the first and the third Quartiles. � It can be used safely as a suitable measure of dispersion at all situations. � It remains unaffected from the extreme values of the variable. � It can be calculated readily from fre quency distributions with the open end classes. � QD at least is a better measure of dispersion compared to Range.

Disadvantages � Quartile deviation as a measure of disper sion is not much popularly prescribed by the statisticians. � It is used only in rare cases.

Formula � Quartile Deviation = Q 3 – Q 1/2 � Coefficient of Quartile Deviation:

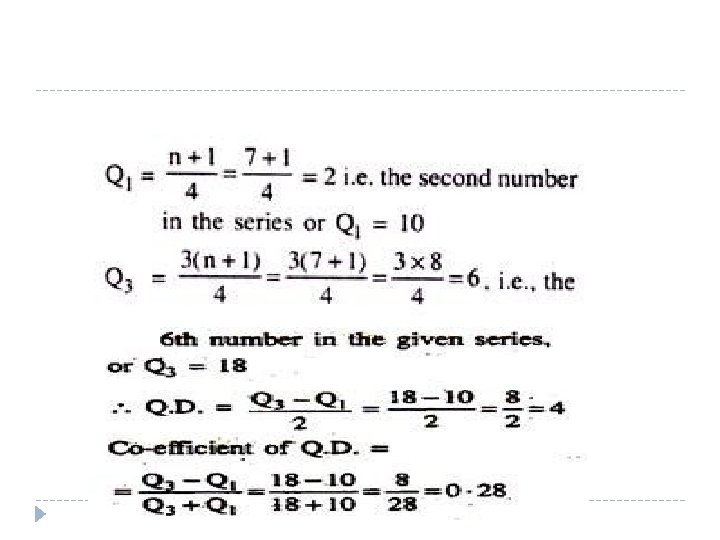
Individual Series � Example 1: � Calculate the Quartile Deviation and Co-efficient of Quartile Deviation from the following data: � 8, 10, 12, 14, 16, 18, 20. � Solution: � Here, n = 7, the first and third quartiles are:

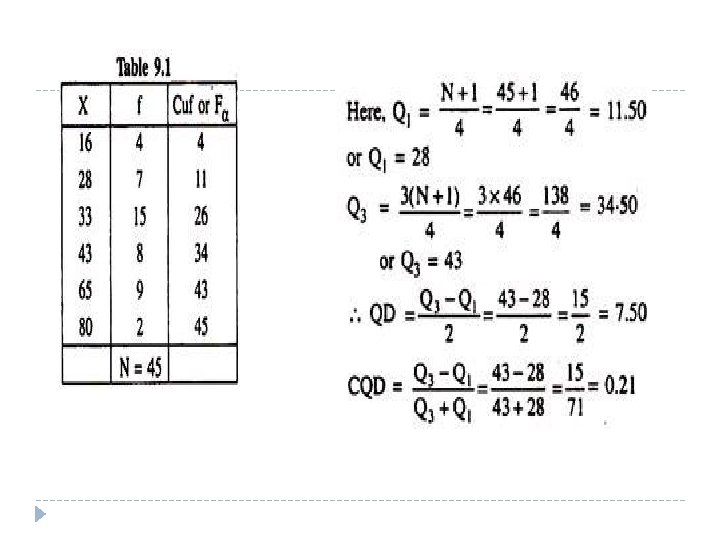
Discrete Series � Determine the QD and CQD from the following grouped data:

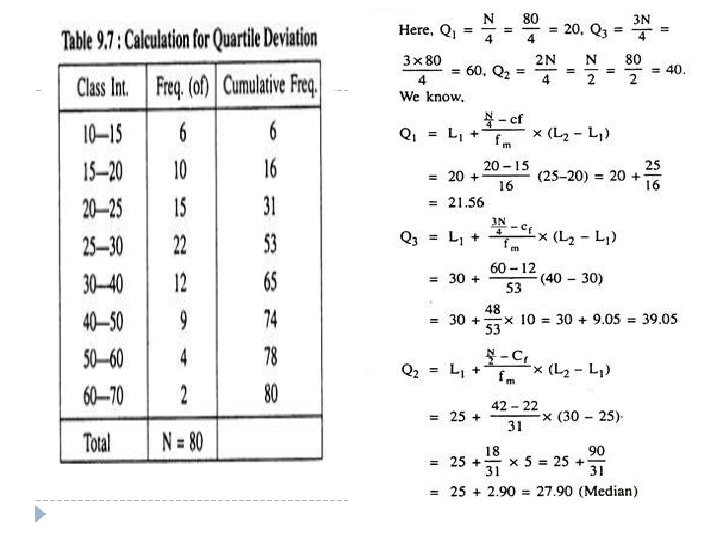
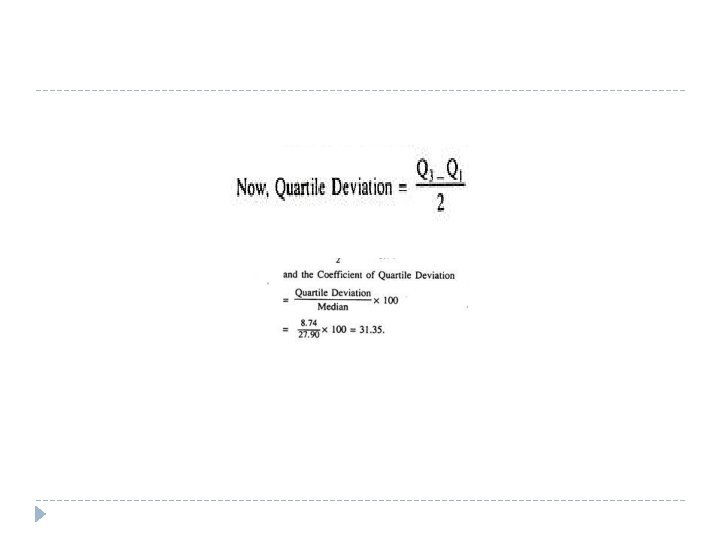
Continuous Series � Calculate the Coefficient of Quartile Deviation from the following data:

Thank you
- Slides: 15