Quartic Polynomials Look at the two graphs and


 is divided by x-a, the remainder is")


 Is NOT a factor")


 Number Of x-Intercepts of a Polynomial Function A polynomial function of")


 = 3 Constant. Function Degree = 0 Maximum Number of Zeros:")
 = x + 2 Linear. Function Degree = 1 Maximum Number")
 = x 2 + 3 x + 2 Quadratic. Function Degree")
 = x 3 + 4 x 2 + 2 Cubic Function")


 =2(x+2)2(x-3) ¡ Zeros are at (-2,")
- Slides: 35
Quartic Polynomials Look at the two graphs and discuss the questions given below. Graph A Graph B 1. How can you check to see if both graphs are functions? 2. How many x-intercepts do graphs A & B have? 3. What is the end behavior for each graph? 4. Which graph do you think has a positive leading coeffient? Why? 5. Which graph do you think has a negative leading coefficient? Why?
AAT-A IB - HR Date: 3/3/2014 ID Check • Obj: SWBAT evaluate functions using synthetic division and determine whether a binomial is a factor of a polynomial by synthetic substitution. ¡Bell Ringer: pg 363 #18 -28 evens (Show table for Turn UP! MAP Casios) HW Requests: Pg 357 #13 -37 odds, use calculator; pg 363 #11 -29 odds Maximize Study- Quiz Sect 7. 1 -7. 3 Read Sect 7. 4 Academic Potential HW: Pg 368 #13, 17, 21, 25, 29, 31 -33 , 37 -40 Study -Quiz Section 7. 1 -7. 3 Read Section 7. 4 Announcements: Quiz this week “There is something in every one of you that waits and listens for the sound of the genuine in yourself. It is the only true guide you will ever have. And if you cannot hear it, you will all of your life spend your days on the ends of
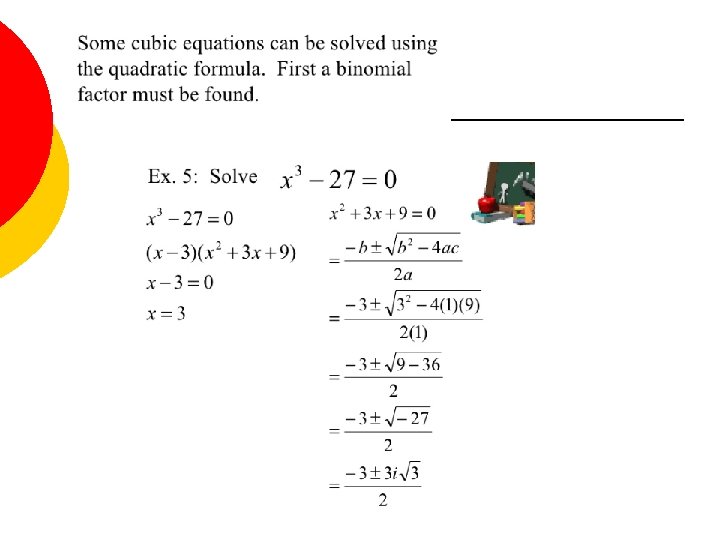
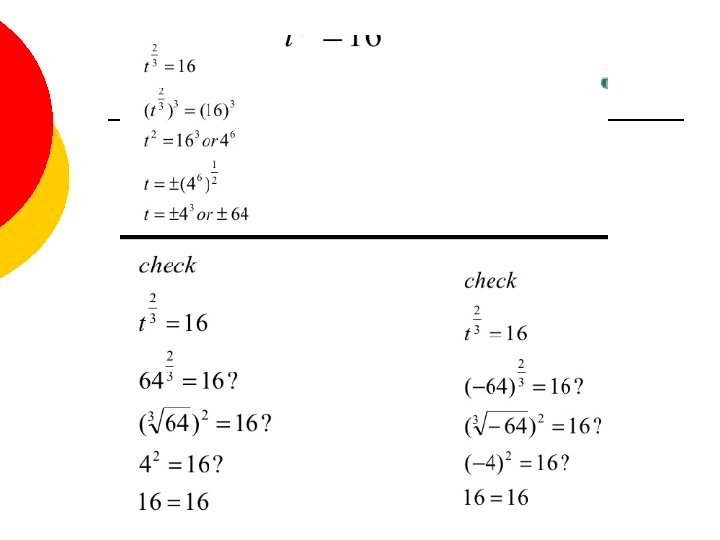
Example 3 Solve each equation. Glencoe – Algebra 2 Chapter 7: Polynomial Functions 3
The Remainder Theorem If a polynomial f(x) is divided by x-a, the remainder is the constant f(a), and Dividend=quotient *divisor +remainder Where is a polynomial with degree one less than the degree of f(x)
The Remainder Theorem Remember Lesson 5 -3 for Synthetic Division
The Remainder Theorem Remainder = 1
The Factor Theorem Since the remainder is 0, x-3 is a factor of the polynomial.
The Factor Theorem When you divide the polynomial by one of the binomial factors , the quotient is called a depressed equation.
The Factor Theorem Remainder = 10, therefore (x-2) Is NOT a factor
The Factor Theorem Given a polynomial and one of its factors, find the remaining factors of the polynomial. Some factors may not be binomials.
Comprehensive Graphs ¡ The most important features of the graph of a polynomial function are: 1. intercepts, extrema, 3. end behavior. A comprehensive graph of a polynomial function will exhibit the following features: 1. all x-intercepts (if any), 2. the y-intercept, 3. all extreme points (if any), 4. enough of the graph to exhibit end behavior. 2. ¡
Example 1 Write each expression in quadratic form, if possible. Solving Using Quadratic Form 1. Rewrite in standard form. 2. Check if first term can be written as the square of the middle term. 3. If possible, rewrite in quadratic form. 4. Factor, complete the square, or use the quadratic formula. 5. Solve for the variable. Glencoe – Algebra 2 Chapter 7: Polynomial Functions 13
Example 2 Solve each equation. Quad Form Factor Zero Product Property Glencoe – Algebra 2 Chapter 7: Polynomial Functions 14
Determining End Behavior Match each function with its graph. A. C. B. D.
Higher Degree Polynomial Functions and Graphs Polynomial Function A polynomial function of degree n in the variable x is a function defined by where each ai is real, an 0, and n is a whole number. ¡ ¡ ¡ an is called the leading coefficient n is the degree of the polynomial a 0 is called the constant term
x-Intercepts (Real Zeros) Number Of x-Intercepts of a Polynomial Function A polynomial function of degree n will have a maximum of n x- intercepts (real zeros). Find all zeros of f (x) = -x 4 + 4 x 3 - 4 x 2 = 0 x 4 - 4 x 3 + 4 x 2 = 0 x 2(x 2 - 4 x + 4) = 0 x 2(x - 2)2 = 0 x=0 or (x - 2)2 = 0 x=2 We now have a polynomial equation. Multiply both sides by -1. (optional step) Factor out x 2. Factor completely. Set each factor equal to zero. Solve for x. (0, 0) (2, 0)
Extrema ¡ Turning points – where the graph of a function changes from increasing to decreasing or vice versa. The number of turning points of the graph of a polynomial function of degree n 1 is at most n – 1. ¡ Local maximum point – highest point or “peak” in an interval l function values at these points are called local maxima ¡ Local minimum point – lowest point or “valley” in an interval l function values at these points are called local minima ¡ Extrema – plural of extremum, includes all local maxima and local minima
Extrema
Polynomial Functions Polynomial Function in General Form Degree Name of Function 1 2 3 4 Linear Quadratic Cubic Quartic The largest exponent within the polynomial determines the degree of the polynomial.
Polynomial Functions f(x) = 3 Constant. Function Degree = 0 Maximum Number of Zeros: 0
Polynomial Functions f(x) = x + 2 Linear. Function Degree = 1 Maximum Number of Zeros: 1
Polynomial Functions f(x) = x 2 + 3 x + 2 Quadratic. Function Degree = 2 Maximum Number of Zeros: 2
Polynomial Functions f(x) = x 3 + 4 x 2 + 2 Cubic Function Degree = 3 Maximum Number of Zeros: 3
Polynomial Functions Quartic Function Degree = 4 Maximum Number of Zeros: 4
Leading Coefficient The leading coefficient is the coefficient of the first term in a polynomial when the terms are written in descending order by degrees. For example, the quartic function f(x) = -2 x 4 + x 3 – 5 x 2 – 10 has a leading coefficient of -2.
Leading Coefficient Test for Polynomial End Behavior Leading Coefficient Test leading degree of coefficient polynomial Slide 2 - 29 Left Right + even ↑+ ↑+ + odd ↓- ↑+ - even ↓- ↓- - odd ↑+ ↓-
Example Use the Leading Coefficient Test to determine the end behavior of the graph of f (x) = x 3 + 3 x 2 - x - 3. y Rises right x Falls left
Number of Local Extrema ¡ ¡ ¡ A linear function has degree 1 and no local extrema. A quadratic function has degree 2 with one extreme point. A cubic function has degree 3 with at most two local extrema. A quartic function has degree 4 with at most three local extrema. How does this relate to the number of turning points?
The Leading Coefficient Test As x increases or decreases without bound, the graph of the polynomial function f (x) = anxn + an-1 xn-1 + an-2 xn-2 +…+ a 1 x + a 0 (an 0) eventually rises or falls. In particular, For n odd: If the leading coefficient is positive, the graph falls to the left and rises to the right. an > 0 Rises right Falls left an < 0 If the leading coefficient is negative, the graph rises to the left and falls to the right. Rises left Falls right
The Leading Coefficient Test As x increases or decreases without bound, the graph of the polynomial function f (x) = anxn + an-1 xn-1 + an-2 xn-2 +…+ a 1 x + a 0 (an 0) eventually rises or falls. In particular, For n even: an > 0 an < 0 If the leading coefficient is positive, the graph rises to the left and to the right. Rises right Rises left If the leading coefficient is negative, the graph falls to the left and to the right. Falls left Falls right
Multiplicity and x-Intercepts If r is a zero of even multiplicity, then the graph touches the x-axis and turns around at r. If r is a zero of odd multiplicity, then the graph crosses the x-axis at r. Regardless of whether a zero is even or odd, graphs tend to flatten out at zeros with multiplicity greater than one.
Example Find the x-intercepts and multiplicity of f(x) =2(x+2)2(x-3) ¡ Zeros are at (-2, 0) (3, 0) ¡