Quantitative Proteins Estimation by Lowry method Protein Estimation

Quantitative Proteins Estimation by Lowry method

Protein Estimation Qualitative refers to descriptions or distinctions based on some quality or characteristic. It can be a form of analysis that yields the identity of a compound (Determine if specific substance is there or not, by color or some other quality). Quantitative refers to a type of information based in quantities or else quantifiable data (determination of unknown protein concentration in a sample using standard curve obtained, eg. using lowry method).

Importance of determining concentration of protein -Quantitative assays Determine the concentration of a substance. § Protein assays are one of the most widely used methods in life science research. Estimation of protein concentration is necessary in protein, cell biology, molecular biology and other research applications. § Is necessary before processing protein samples for isolation, separation and analysis.

Specificity and Sensitivity of the method Sensitivity of an assay is a measure of how little of the analyte the method can detect. Specificity of an assay relates to how good the assay is in discriminating between the requested analyte and interfering substances

Most familiar spectrophotometric methods for Determination of proteins concentration: Lowry method Bicinchoninic acid (BCA, Smith) Method Bradford Method Warburg-Christian Method ( A 280/ A 260 Method) The factors that you should consider in choosing a method: • Sensitivity • The presence of interfering substance (Specificity) • Time available of the assay Biuret method

Principle of Lowery Method Is based on two chemical reactions: § The first reaction is the reduction of copper ions under alkaline conditions, which forms a complex with peptide bonds. § The second reaction is the reduction of Folin-Ciocalteu reagent by the copper-peptide bond complex, which subsequently causes a color change of the solution into blue with an absorption in the range of 650 to 750 nm detectable with a spectrophotometer. The advantages of this assay are its sensitivity, and most importantly, accuracy. -However, it requires more time than other assays.
 treated")
Principle of Biuret Method • When proteins and peptides (i. e peptide bonds) treated with an alkaline solution of dilute copper sulfate a violet color is formed. • Note: Biuret Method used to detect the presence of proteins in a sample and can be use for Quantitative analysis of proteins. • The color density is proportional to amount of proteins present. • The more protein in a sample, the more product formed(which has a violet color), the more absorbance (because the product is the one which absorbed.

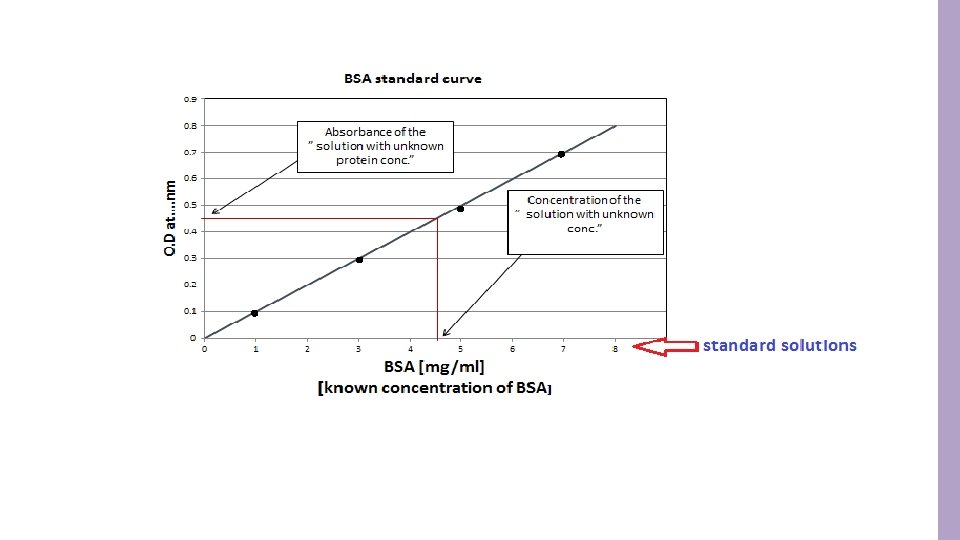
A standard curve: § It is a graph that shows the relationship between different known concentrations of a substance and the absorbance at a specific wave length. § Standard curve are most commonly used to determine the concentration of a substance, using serial dilution of solutions of known concentrations[standard solution ]. such as (Bovine serum Albumin)BSA and casein. * There is a linear relationship between absorbance and concentration. Increased concentration => Increased color intensity => Increased absorbance value
![Method : 1. Set up 7 tubes as follows: Tube Water [unknown albumin concentration]](http://slidetodoc.com/presentation_image_h/0946f0e87a9515c75b2e7b4f5f2424d8/image-10.jpg "Method : 1. Set up 7 tubes as follows: Tube Water [unknown albumin concentration]")
Method : 1. Set up 7 tubes as follows: Tube Water [unknown albumin concentration] 1 ml albumin Standard Concentration [100 mg/dl] - Blank A 0. 8 ml 0. 2 ml - B 0. 6 ml 0. 4 ml - C 0. 4 ml 0. 6 lm - D 0. 2 ml 0. 8 ml - E - 1. 0 ml - F - - 1. 0 ml - 2. Add 3 ml reagent C to all tubes. Mix and let stand at room temperature for 15 min. 3. Add 0. 5 ml of Folin-Ciocalteu reagent. (Add this reagent to one tube at a time and immediately after adding it mix well). 4. Let the tubes stand at room temperature for 45 min. 5. Read absorbance at 660 nm against the blank. 6. Plot a standard curve for absorbance at 660 nm against albumin std. concentration (mg/dl). 7. From the standard curve find out the unknown concentration of albumin.
 *")
Results : Tube Concentration A B C D E F Unknown (from curve) * Calculate the concentration of each tube using : C 1 X V 1 = C 2 X V 2 Absorbance
- Slides: 11