QUANTITATIVE ANALYTICAL CHEMISTRY 1 Volumetric titrimetric analysis 2
 Volumetric (titrimetric) analysis 2) Gravimetric analysis 3) instrumental analysis Acid-Base")

 : the")

 x 100% = - 3.")
 Determinate or systemic (constant) errors: n can be determined,")


: n Variance =The square of the standard deviation = S")

 = 0. 002 (b) The arranged data are:")
: n n The Q test is used")
 between the suspect number (the outlier) and its nearest")


- Slides: 22
QUANTITATIVE ANALYTICAL CHEMISTRY 1) Volumetric (titrimetric) analysis 2) Gravimetric analysis 3) instrumental analysis Acid-Base Electrochemistry preciptimetry Spectrophotometry Complexmetry Redox Spectrofluorometry Flame photometric methods
STATISTICS
n n n Error: deviation from the absolute value. Absolute error (E) : the difference between an observed or measured value (O) and the true value (T) , with regard to the sign and it is reported in the same units as the measurement. E=O–T Mean error: the difference between the average of several measurements and the true value (T). Relative Error: absolute or mean error (E) expressed as a percentage (%) of the true value (T)
Example, 1: n If a 2. 62 g sample of material analyzed to be 2. 52 g. n The absolute error (E) = 2. 52 – 2. 62 = -0. 10 g. n Example, 2: n In the titration of 10 ml of 0. 1 N Na. OH with laboratory prepared 0. 1 N HCl, the true value is 9. 9 ml, and we have: n 10. 1, 9. 9, 9. 8, 10. 2, 10. 1 observed values, n So, Mean = summation of observed values / their number = (10. 1 + 9. 9 + 9. 8 + 10. 2 + 10. 1) / 5 = 10. 02 ml. n And mean error = 10. 02 – 9. 9 = 0. 12 ml. n
In example, 1: Relative Error = (-0. 10/2. 62) x 100% = - 3. 8 % n In example, 2: n Relative Mean Error = ( 0. 12/9. 9) x 100% = 1. 21%
Types of Errors: n (A) Determinate or systemic (constant) errors: n can be determined, (can be avoided) n (B) Indeterminate (random, accidental or chance) errors: cannot be determined or corrected.
Accuracy: agreement of a measurement with the true value. n Determination of accuracy: Absolute method n Accuracy is determined from the relative error; n In example, 1: Relative Error = (-0. 10/2. 62) x 100% = -3. 8 % n And accuracy = 100. 0 – 3. 8 = 96. 2 %. n In example, 2: Relative Mean Error = ( 0. 12/9. 9) x 100% = 1. 21% n And accuracy = 100. 00 – 1. 21 = 98. 79 %. n
n n Example 3: In practical exam of volumetric analysis, three students get the following results:
n n Precision : The agreement between several measurements of the same substance. Mean (X): It is the arithmetic average of all measured values. The range (w): the"spread": It is the difference between the highest measurement and the lowest one. n The median: It is the measurement in the middle of the arranged measurements where the numbers of higher and lower measurements are equal. n
n standard deviation (s): n Variance =The square of the standard deviation = S 2 Relative standard deviation (RSD) n Coefficient of variation (C. V. ) : n
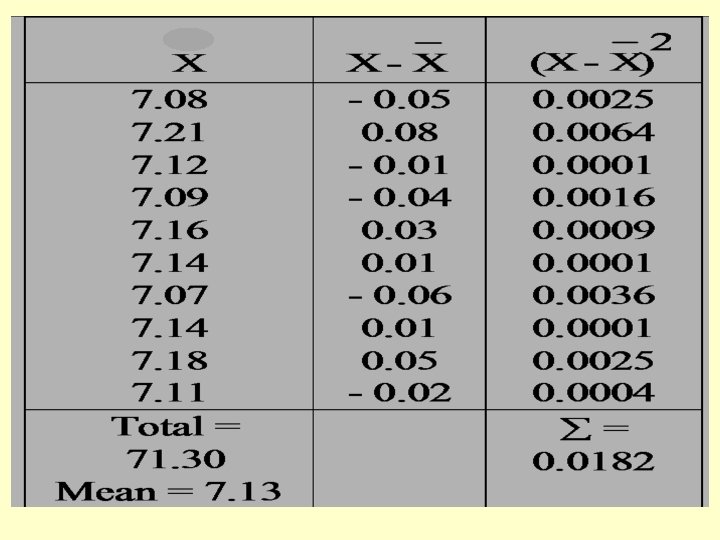
Example: n Analysis of a sample of iron ore gave the following % values: 7. 08, 7. 21, 7. 12, 7. 09, 7. 16, 7. 14, 7. 07, 7. 14, 7. 18, 7. 11. n Calculate the mean, standard deviation, the variance and coefficient of variation; n Find also the median and the range for these data. n
n n n Variance (S 2) = 0. 002 (b) The arranged data are: 7. 07, 7. 08, 7. 09, 7. 11, 7. 12, 7, 14, 7. 16, 7. 18, 7. 21 The median is : (7. 12 + 7. 14) / 2 = 7. 13 The range is : 7. 21 – 7. 07 = 0. 14
Rejection of a result (The Q test): n n The Q test is used to determine if an “outlier” is due to a determinate error or due to indeterminate error. If it is due to a determinate error, it should be rejected. If it is not due to a determinate error, then it falls within the expected random error and should be retained. The ratio Q is calculated by arranging the data in decreasing order of numbers.
n n The difference (a) between the suspect number (the outlier) and its nearest neighbour number is divided by: the range (w), which is the difference between the highest number and the lowest number,
n n n The ratio is compared with the tabulated values of Q (see the Table). If Q measured is equal or greater than the tabulated value, the suspected observation can be rejected. If it is smaller than the tabulated value, the suspected observation is retained
n n n Example: The following set of chloride analysis on separate aliquots of serum were reported; 103, 106, 107 and 114 meq/L. one value appears suspect. Determine if it may be rejected or not.
Answer: n The suspected result is 114 meq/L. n It differs from the nearest neighbor by (a) : 114 – 107 = 7 meq/L. n The range (w) is : 114 – 103 = 11 meq/L. n Therefore, Q = a/w = 7/11 = 0. 64 n n n The tabulated Q value (4 observations, 95% confidence level) is: 0. 829 Since the calculated Q value is less than the tabulated Q value, the suspected no. (114 meq/L) retained.
Significant figures n ‘digit’ = 0, 1, 2, ………. . 8, 9 n A significant figure = is a digit which denotes the amount of quantity in the place in which it stands. n The digit 0 is a significant figure except when it is the first figure in a number. n In 1. 2680 g and 1. 0062 g 5 n the zero is significant, n but in the quantity 0. 0025 kg 2 n the zero is not significant, because 0. 0025 kg = 2. 5 g.
n n n n 1 g means that it is between 0. 9 and 1. 1 g 1. 0 g means that it is between 0. 99 and 1. 01 g 1. 00 g means that it is between 0. 999 and 1. 001 g Take 10. 0 ml of Zn 2+ sample, add 10 ml of NH 3 -buffer Weigh 1. 000 g of powdered drug sample, add 2 g of hexamine reagent …. . 1 kg of tomato xxxxxxx 1. 000 kg of gold !!! volume which is known to be between 20. 5 ml and 20. 7 ml should be written as 20. 6 ml; but not as 20. 60 ml indicates that the value lies between 20. 59 ml and 20. 61 ml.
Rejection quotient, Q, at different confidence levels