Quantifying the Mechanisms Governing Interannual Variability in Airsea

Quantifying the Mechanisms Governing Interannual Variability in Air-sea CO 2 Flux S. Doney & Ivan Lima (WHOI), K. Lindsay & N. Mahowald (NCAR), K. Moore (UCI) & Matt Maltrud (LANL) Global Ocean Hindcast Simulations (1958 -2004) -Upper ocean multi-functional group, multi-nutrient ecosystem model (Moore et al. , 2004) -Coupled to full-depth ocean BGC model (CCSM-POP) -Surface forcing (1957 -2004) from NCEP reanalysis and satellite products -Fixed pre-industrial atmospheric CO 2 (~280 ppm) & transient anthropogenic CO 2 simulations
 + ( +) + Winds,")
p. CO 2 = f(Temp. , Salinity, DIC, Alkalinity) + ( +) + Winds, Heat & Freshwater Fluxes Light Dust/iron CO 2 Net Community Prod. Circulation Regenerated Prod. Winter mixed layer Nutrient/ DIC Supply Export Remineralization Physical & Biological Controls Biology only one factor on surface p. CO 2 & air-sea CO 2 flux;

")
Ocean Model Hindcast (1957 -2004)

Factors driving interannual p. CO 2 anomalies: Wind Speed

1: 1 Temp n. DIC Alk Fresh water W. Eq. Pacific

Dissolved Inorganic Carbon Regression of surface p. CO 2 anomalies on forcing terms Temperature ~1 driving term 0 minor term <0 compensating term Masked in areas of low p. CO 2’ and low correlation

Alkalinity Regression of surface p. CO 2 anomalies on forcing terms Freshwater ~1 driving term 0 minor term <0 compensating term Masked in areas of low p. CO 2’ and low correlation

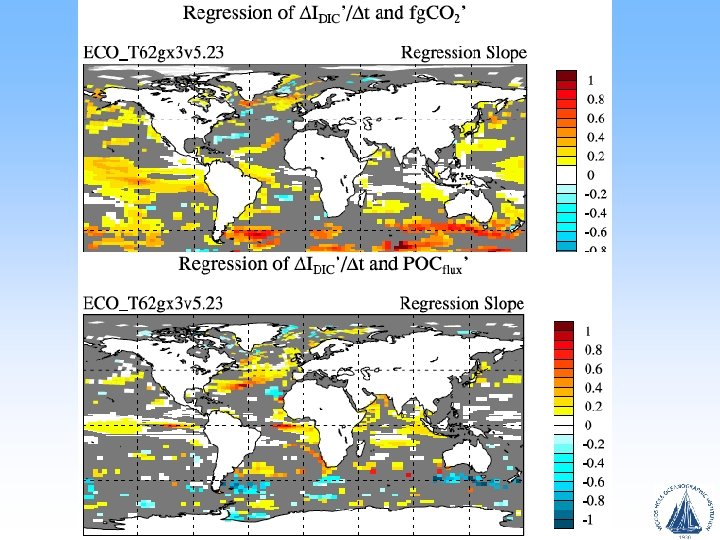
Annual inventory change & flux anomalies X’: I/ t = Q’ srf. flux + A’ horz. advection + E’ eddies + V’ vert. adv. + P’ net comm. prod. + other Q’ 0 A’ E’ I P’ V’ 100

Dust Only Physics Only

Sea. Wi. FS Dust r=0. 82 Physics r=0. 11 Smoothed w/ annual filter Dust & Physics r=0. 48

Monthly Annual

-Models as tools for identifying ocean biogeochemical mechanisms -Regional partitioning of factors driving air-sea CO 2 flux • Southern Ocean wind speed variability • Subtropics thermal • Tropics/high latitude biology and circulation on n. DIC • Tropical Indo-Pacific freshwater -Non-linear interactions of dust and climate variability


Is low dust deposition downwind of Australia in 1997/1998 realistic? Tentative answer: yes Model Low dep due to low source Low dep due to high precip Obs Chen et al. precip slightly above average for 1997 and 1998 Two met stations close to source area: 946720 and 944820 have fewer dust events than average in 1997 and 1998 All values are anomalies from climatological mean (1979 -2004): black monthly: Yellow line: 0: blue line: annual mean

Physics r=0. 56 Sea. Wi. FS Dust & Physics r=0. 60 Monthly anomalies Dust r=0. 71

- Slides: 18