
Quantifying Pulsus Paradoxus Kara Bliley Gina Lee Allison
Quantifying Pulsus Paradoxus Kara Bliley Gina Lee Allison Powers Advisor: Tina V. Hartert, M. D. , M. P. H.
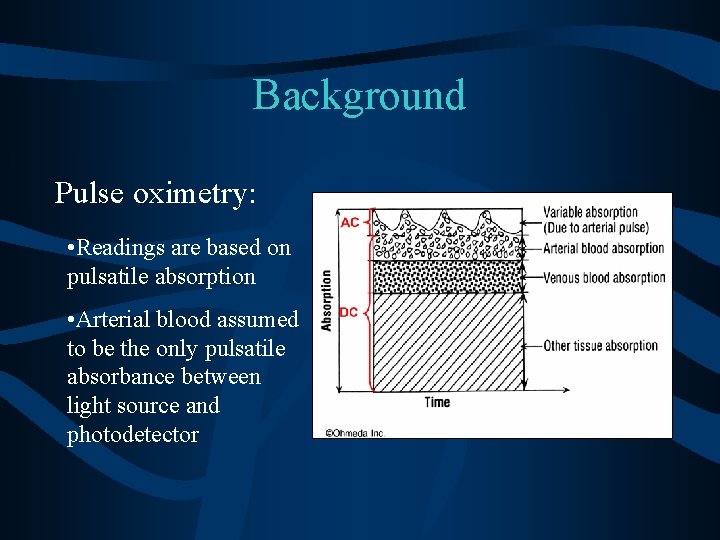
Background Pulse oximetry: • Readings are based on pulsatile absorption • Arterial blood assumed to be the only pulsatile absorbance between light source and photodetector
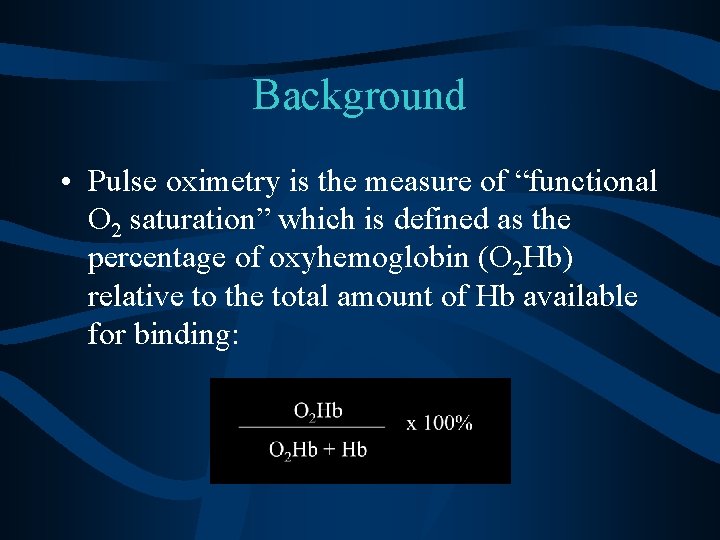
Background • Pulse oximetry is the measure of “functional O 2 saturation” which is defined as the percentage of oxyhemoglobin (O 2 Hb) relative to the total amount of Hb available for binding:
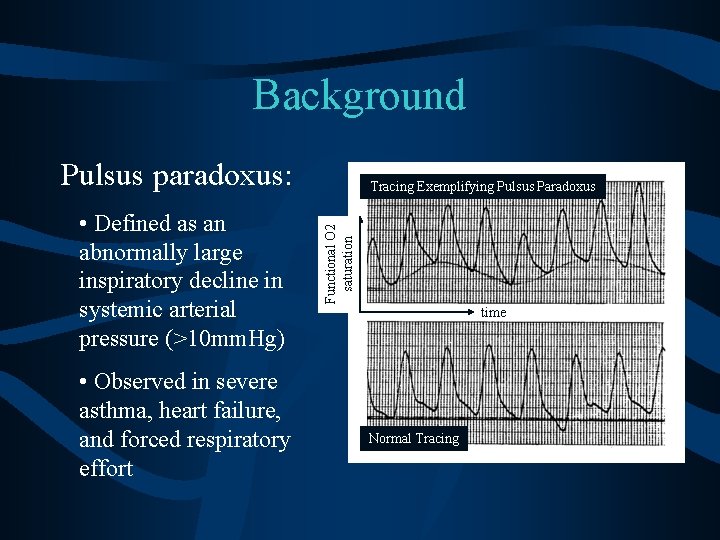
Background Pulsus paradoxus: • Observed in severe asthma, heart failure, and forced respiratory effort Functional O 2 saturation • Defined as an abnormally large inspiratory decline in systemic arterial pressure (>10 mm. Hg) Tracing Exemplifying Pulsus Paradoxus time Normal Tracing
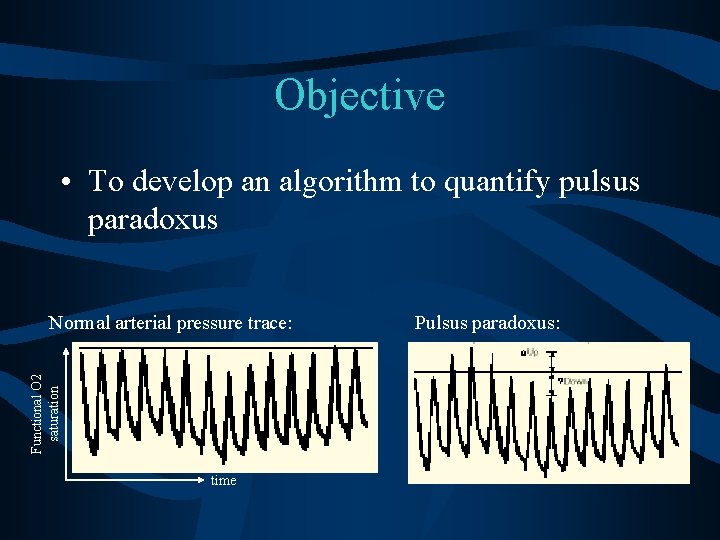
Objective • To develop an algorithm to quantify pulsus paradoxus Functional O 2 saturation Normal arterial pressure trace: time Pulsus paradoxus:
Methods: Digitizing Data • Developed scales for the printouts • Entered the data by hand into Excel spreadsheets • About six complete cycles of data entered for each • Number of data sets: 1 normal, 8 abnormal
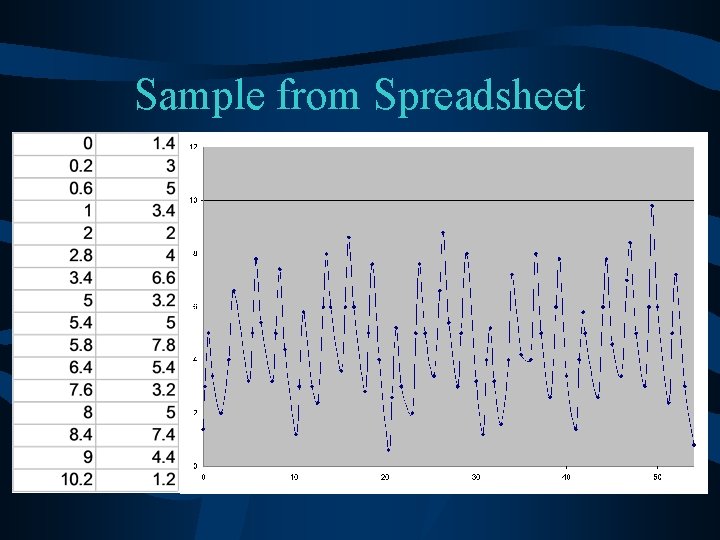
Sample from Spreadsheet
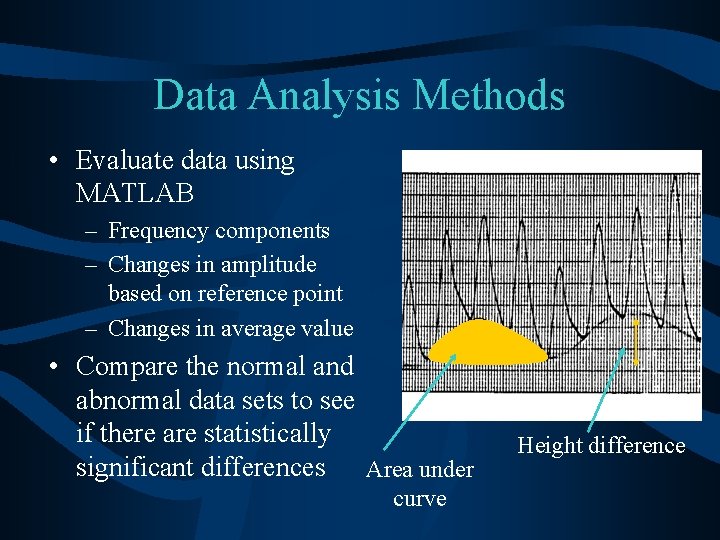
Data Analysis Methods • Evaluate data using MATLAB – Frequency components – Changes in amplitude based on reference point – Changes in average value • Compare the normal and abnormal data sets to see if there are statistically significant differences Area under curve Height difference
Clinical Application • Conclusions about the severity of the abnormality will be drawn based on our findings for each data analysis method we pursue. • The conclusions made using our methods will be compared with those made previously by physicians. We are currently blinded to those diagnoses. • The method for which the most correct conclusions are drawn will be decidedly the best method of analysis.
Current Status • Data has been entered in Microsoft Excel • We are analyzing data using MATLAB Current Work • We are analyzing using MATLAB • Blind study
Work Completed • Data has been digitized. Future Work • Compare our results with established scale • May need help for analyzing data: – Patrick Norris – Richard Shiavi, Ph. D.
Acknowledgements • VUMC Intensive Care Unit Staff • Patrick Norris References • Figures used throughout presentation were obtained from presentations given by our advisor
- Slides: 12