Quality Tools and Techniques Population and Sample POPULATION


 -----Special Cause of problem (SCP).")


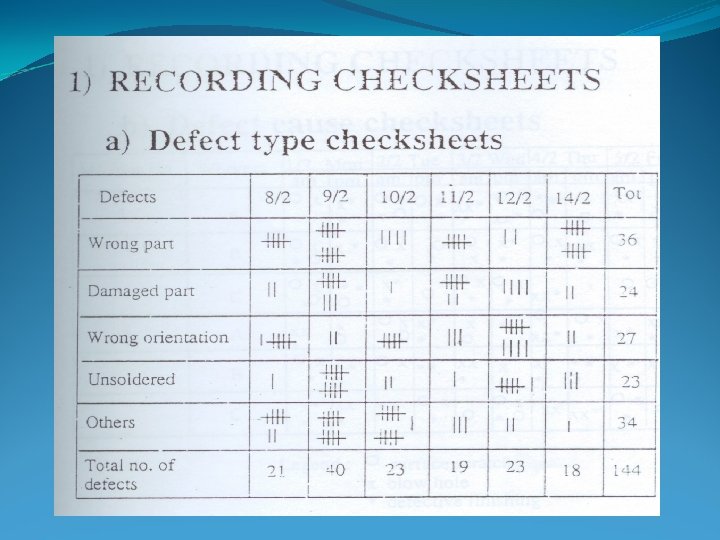
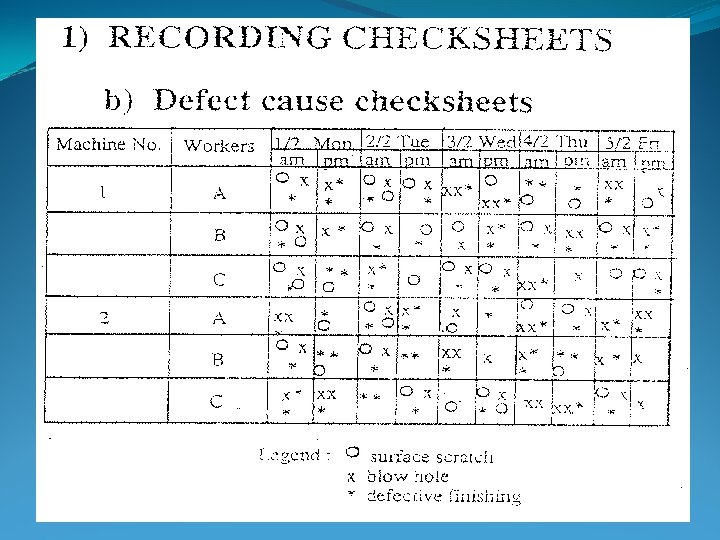
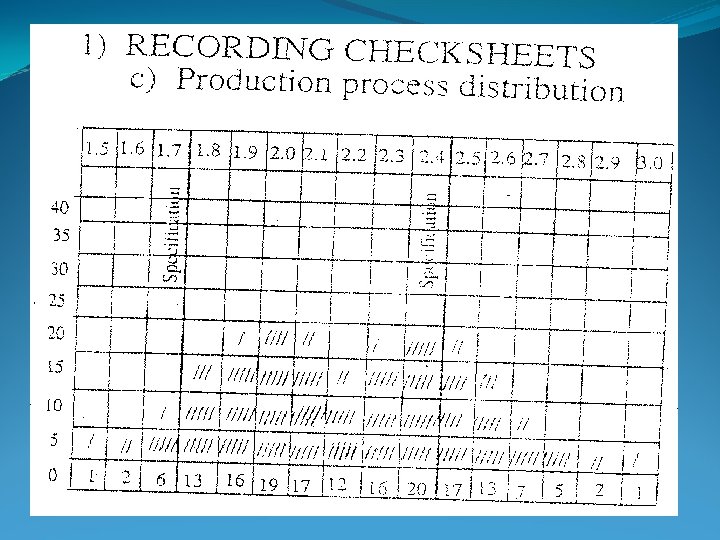
 RECORDING CHECKSHEETS DEFECTIVE TYPE CHECKSHEET DEFECT CAUSE CHECKSHEET PRODUCTION PROCESS")


- Slides: 23
Quality -----Tools and Techniques
Population and Sample
POPULATION The complete set of measurement of interest in a particular problem ------length, width, height, surface finish, etc. of the component/part produced by the factory. (1) It is not possible to test all factory components in order to get a complete list of dimensions. (2) It would be too time consuming and leave the factory with nothing to sell. (3) Obtain a representative set of measurements from the population by performing an experiment.
POPULATION Population is the totality of observations we are concerned with. Example: All Engineers in the Malaysia, All Mfg. Engg. students in Uni. MAP etc. Population Mean(µ) Total set of items from which a sample set is taken.
SAMPLE The sub-set of population containing those measurements actually obtained by experiment. Sample : Subset of the population for example 50 Engineers selected at random, 10 ME students selected at random. A. The sample might consist of a number of recorded observations. B. The objective is to use these sample data for the purpose of making inference about the population from which the sample was obtained
SAMPLE The best way to avoid a biased or unrepresentative sample is to select a random sample. a sample where the probability that any individual member from the population being selected as part of the sample. ***A sample that is not random is called a nonrandom sample.
SAMPLE Estimate the average of all observed observations of the component of the population. Sample Mean x = xi+ xii-----/n i. Estimate reliability of a system made up of such components. ii. Estimate the population of defective items in a population. iii. Decide whether to accept the lot from which the sample was drawn ----Sample should meet the standard set by the factory.
PURPOSE OF DATA 1. ASSIST IN UNDERSTANDING THE ACTUAL S ITUATION of the manufacturing process 2. DATA FOR ANALYSIS (*CCP / SCP) 3. DATA FOR PROCESS CONTROL 4. The Trends or Shifts in the data 5. REGULATING DATA 6. ACCEPTANCE OR REJECTION DATA * Common cause of Problem (CCP) -----Special Cause of problem (SCP)/ Assignable cause.
Time Frequency Plot * Common cause of Problem (CCP) -----Special Cause of problem (SCP).
TYPES OF DATA MEASUREMENT DATA : CONTINUOUS DATA LENGTH, WEIGHT, TIME, ETC COUNTABLE DATA: DISCRETE DATA NUMBER OF DEFECTIVES, NUMBER OF DEFECTS PERCENTAGE DEFECTIVE, ETC
REMINDER OF DATA TAKE ACTION ACCORDING TO THE DATA CLARIFY THE PURPOSE OF COLLECTING DATA GET ALL THE RELATED DATA
Forms of Data Description Point summary Tabular format Graphical format Diagrams Data collection - data analysis - data implementation…. .
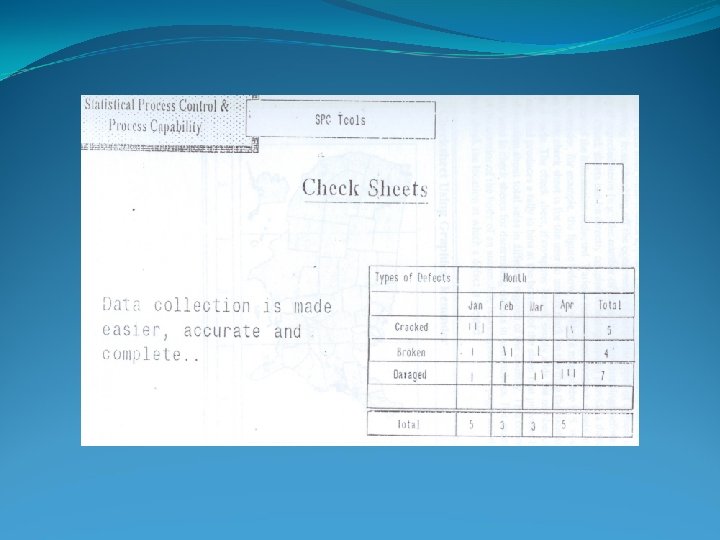
DATA COLLECTION IS MADE EASIER, ACCURATE AND COMPLETE
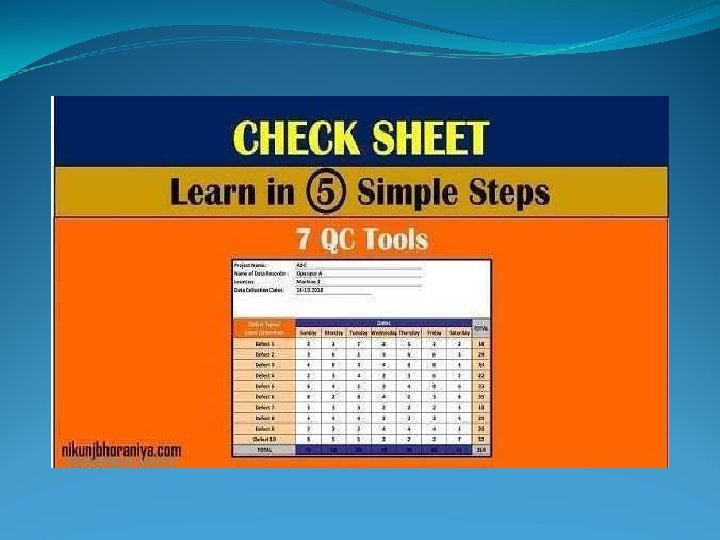
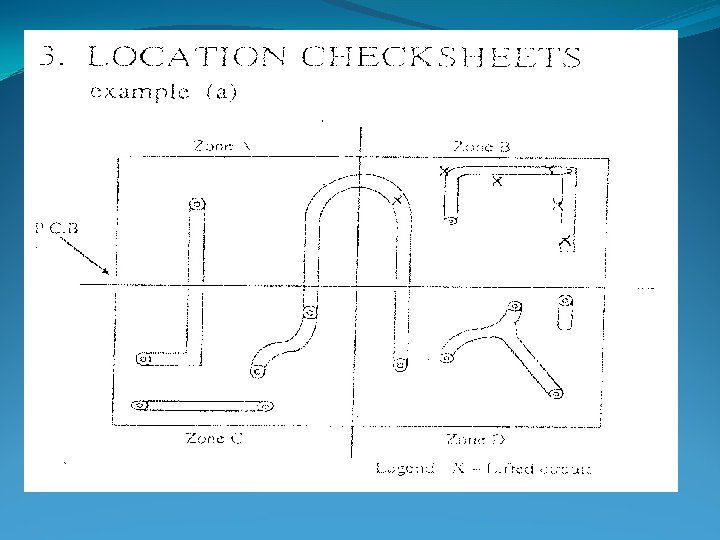
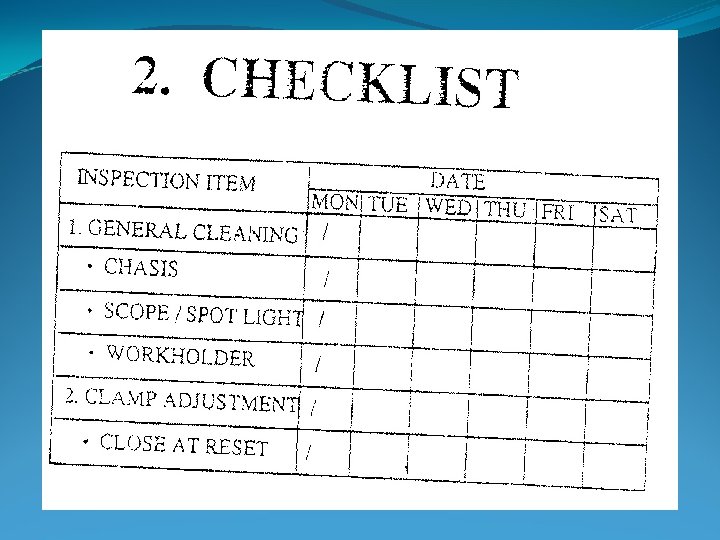
TYPES OF CHECKSHEET (1) RECORDING CHECKSHEETS DEFECTIVE TYPE CHECKSHEET DEFECT CAUSE CHECKSHEET PRODUCTION PROCESS DISTRIBUTION CHECKSHEET (2) CHECKLISTS (PDI) (3) DEFECT LOCATION CHECKSHEETS
EXAMPLES OF CHECKSHEETS
Flow Charts • Flow charts are nothing but graphical representation of steps involved in a process. • Flow charts give in detail the sequence involved in the material, machine and operation that are involved in the completion of the process. • They are the excellent means of documenting the steps that are carried out in a process. Start/ Finish Operation Decision Operation Decision Start/ Finish