
Quality Management System and the Business Plan Kathleen

Quality Management System and the Business Plan Kathleen Betz MERC Process and Product Quality ETM 627 Fall 2008 Slide

Topics for Discussion n n n Quality Management System Business Plan to Drive Change Process Improvement Teams Balanced Scorecard Basic Quality Tools Two Real life examples of Production Problem Solving Teams 2
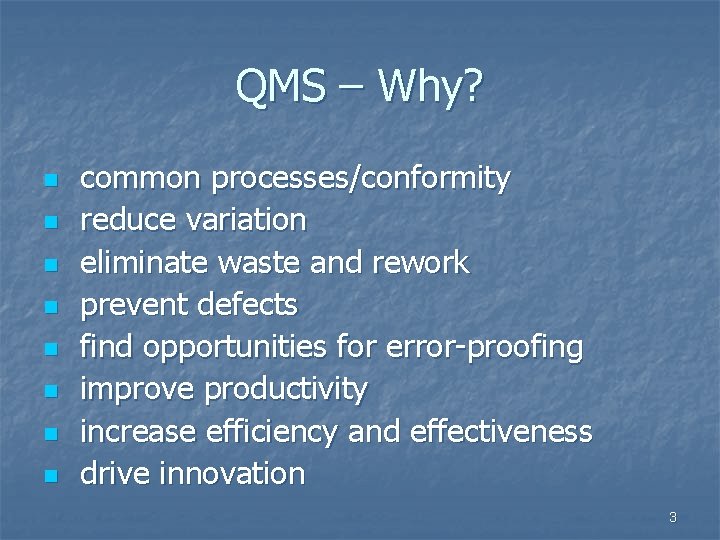
QMS – Why? n n n n common processes/conformity reduce variation eliminate waste and rework prevent defects find opportunities for error-proofing improve productivity increase efficiency and effectiveness drive innovation 3

QMS – Why? n According to the ASQ online glossary (http: //www. asq. org/glossary/q. html) n n Quality management system (QMS): A formalized system that documents the structure, responsibilities and procedures required to achieve effective quality management. Quality management (QM): The application of a quality management system in managing a process to achieve maximum customer satisfaction at the lowest overall cost to the organization while continuing to improve the process. 4
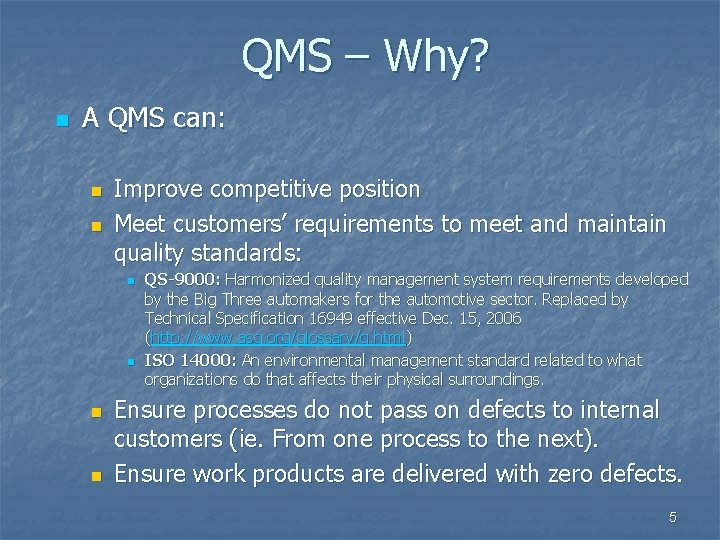
QMS – Why? n A QMS can: n n Improve competitive position Meet customers’ requirements to meet and maintain quality standards: n n QS-9000: Harmonized quality management system requirements developed by the Big Three automakers for the automotive sector. Replaced by Technical Specification 16949 effective Dec. 15, 2006 (http: //www. asq. org/glossary/q. html) ISO 14000: An environmental management standard related to what organizations do that affects their physical surroundings. Ensure processes do not pass on defects to internal customers (ie. From one process to the next). Ensure work products are delivered with zero defects. 5
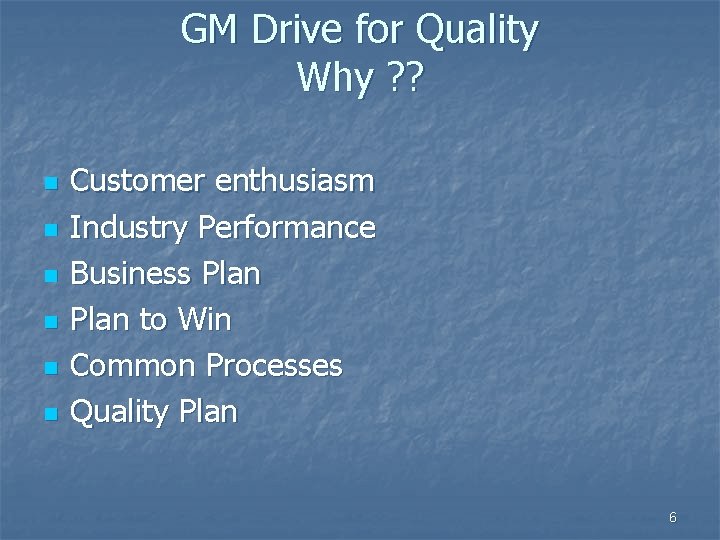
GM Drive for Quality Why ? ? n n n Customer enthusiasm Industry Performance Business Plan to Win Common Processes Quality Plan 6
GM Drive for Quality Why? Data protected 7
A New Driver n Rick Wagoner took over the ‘wheel’ of GM in 1998 n realized that this huge company had some big problems: Decision making was slow n Intense industry competition n losing shareholder value n 8
GM-NAO Business Plan to Win Diagram omitted 9
'Plan to win' means job cuts at GM 12: 40 PM CDT on Tuesday, July 15, 2008 Associated Press Video Jim Douglas reports July 15, 2008 MORE: News 8 video View larger DETROIT — General Motors Corp. said Tuesday it will lay off salaried workers, cut truck production, suspend its dividend and borrow $2 billion to $3 billion to weather a severe downturn in the U. S. market. GM said the moves will raise $15 billion to help cover losses and turn around its North American operations, including $10 billion from internal cost-cutting and $5 billion from selling some assets and borrowing against others. "In short, our plan is not a plan to survive. It is a plan to win, " GM Chairman and CEO Rick Wagoner said in a broadcast to employees. 10

The Four Perspectives Business Plan Deployment http: //www. isixsigma. com/library/content/c 011008 a. asp 11
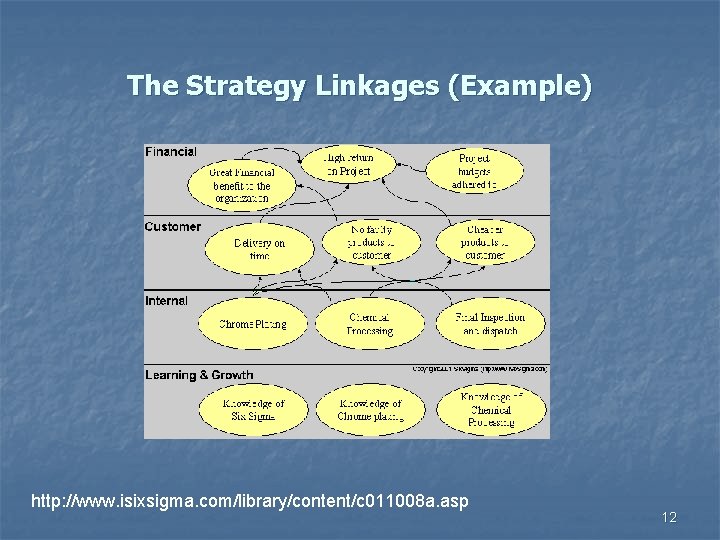
The Strategy Linkages (Example) http: //www. isixsigma. com/library/content/c 011008 a. asp 12
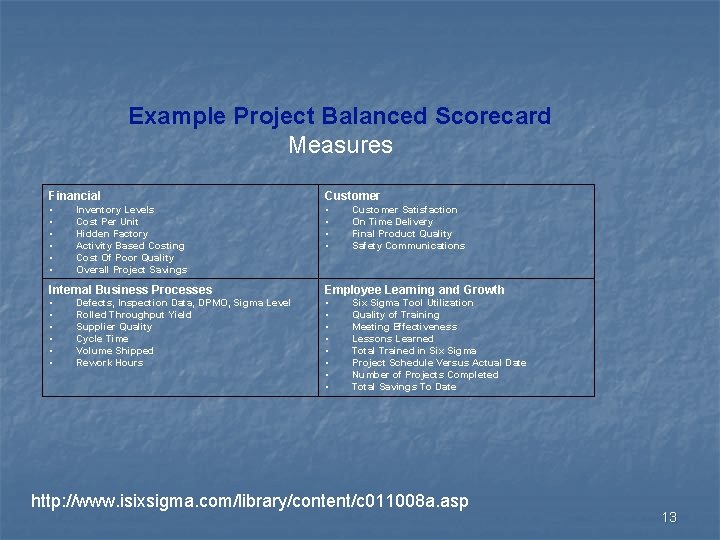
Example Project Balanced Scorecard Measures Financial Customer • • • Inventory Levels Cost Per Unit Hidden Factory Activity Based Costing Cost Of Poor Quality Overall Project Savings Customer Satisfaction On Time Delivery Final Product Quality Safety Communications Internal Business Processes Employee Learning and Growth • • • • Defects, Inspection Data, DPMO, Sigma Level Rolled Throughput Yield Supplier Quality Cycle Time Volume Shipped Rework Hours Six Sigma Tool Utilization Quality of Training Meeting Effectiveness Lessons Learned Total Trained in Six Sigma Project Schedule Versus Actual Date Number of Projects Completed Total Savings To Date http: //www. isixsigma. com/library/content/c 011008 a. asp 13

ISO 9000 Elements • 4. 0 ISO 9000 Elements 4. 1 4. 2 4. 3 4. 4 4. 5 4. 6 4. 7 Management Responsibility Quality System Contract Review Design Control Document and Data Control Purchasing Control of Customer. Supplied Product 4. 8 Product Identification and Traceability 4. 9 Process Control 4. 10 Inspection and Testing 4. 11 Control of Inspection, Measuring and Test Equipment 4. 12 Inspection and Test Status 4. 13 Control of Nonconforming Product 4. 14 Corrective and Preventive Action 4. 15 Handling, Storage, Packaging, Preservation, and Delivery 4. 16 Control of Quality Records 4. 17 Internal Quality Audits 4. 18 Training 4. 19 Servicing 14 4. 20 Statistical Techniques
Common Procedures n Common means common, some or all plants had to modify existing practices and/or procedures 15
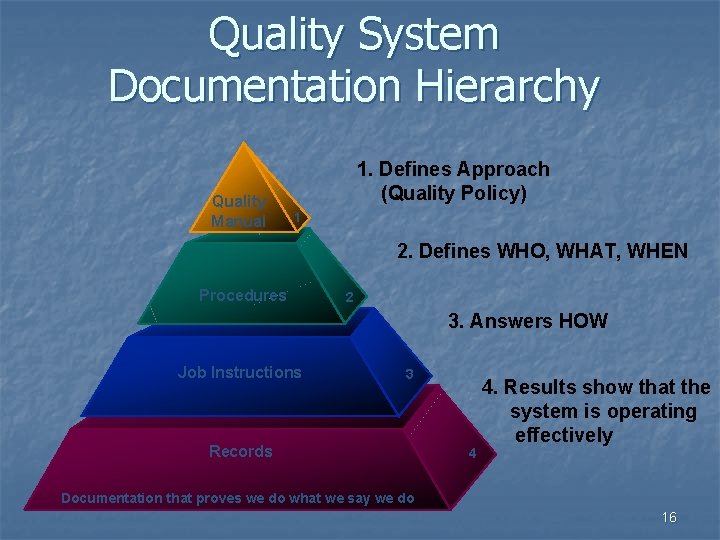
Quality System Documentation Hierarchy Quality Manual 1. Defines Approach (Quality Policy) 1 2. Defines WHO, WHAT, WHEN Procedures 2 3. Answers HOW Job Instructions 3 Records 4 4. Results show that the system is operating effectively Documentation that proves we do what we say we do 16
How Did We Maintain the System? • Documented What We Did! – Quality Policy – Quality Manual – Business Processes – Procedures – Job Instructions and Control Plans – Records • Did What We Documented! – Training – Internal Audits – Management Reviews – Corrective Actions – Continuous Improvement • Be Sure It’s Effective! 17
Global Current Product Improvement Process Diagram omitted 18
Global Current Product Improvement Process – suggested article: Road to gold: Red X drives quality at General Motors. By Sharrock, Rory Publication: Industrial Engineer Date: Tuesday, May 1 2007 19

This Slide is OMITTED 20

This Slide is OMITTED 21
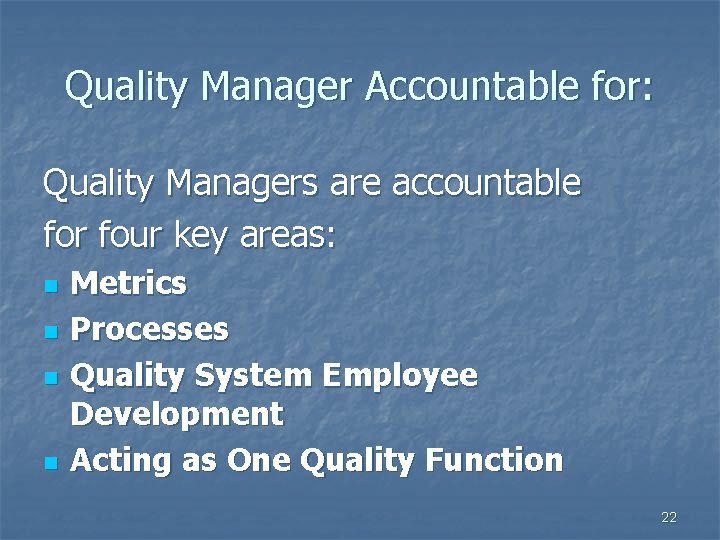
Quality Manager Accountable for: Quality Managers are accountable for four key areas: n n Metrics Processes Quality System Employee Development Acting as One Quality Function 22
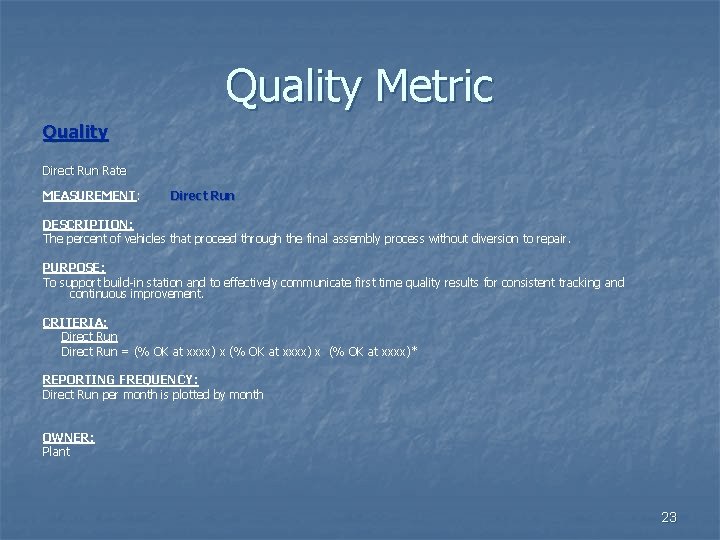
Quality Metric Quality Direct Run Rate MEASUREMENT: Direct Run DESCRIPTION: The percent of vehicles that proceed through the final assembly process without diversion to repair. PURPOSE: To support build-in station and to effectively communicate first time quality results for consistent tracking and continuous improvement. CRITERIA: Direct Run = (% OK at xxxx) x (% OK at xxxx)* REPORTING FREQUENCY: Direct Run per month is plotted by month OWNER: Plant 23
Verification Process This Slide is OMITTED 24
Training Requirements & Levels of Involvement Training level Basic Level FO IN TE IT OM Intermediate Level D Expert Level 25
One Quality Function Countermeasure Meeting Thruput Improvement Tracking PPH Reduction Tracking Error Proofing Tracking Problem Sources Data Omitted 26
Balanced Scorecard n n n DR of 80% goal for all NA plants Team level/team meetings on these goals/objectives. Show Scorecard example 27
7 Diamonds Standardized Problem Solving DIAGRAM OMITTED 28
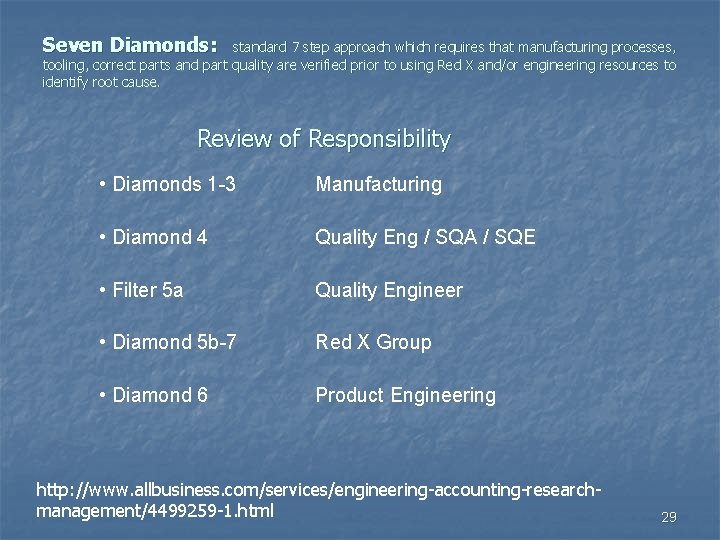
Seven Diamonds: standard 7 step approach which requires that manufacturing processes, tooling, correct parts and part quality are verified prior to using Red X and/or engineering resources to identify root cause. Review of Responsibility • Diamonds 1 -3 Manufacturing • Diamond 4 • Filter 5 a Quality Eng / SQA / SQE • Diamond 5 b-7 Red X Group • Diamond 6 Product Engineering Quality Engineer http: //www. allbusiness. com/services/engineering-accounting-researchmanagement/4499259 -1. html 29
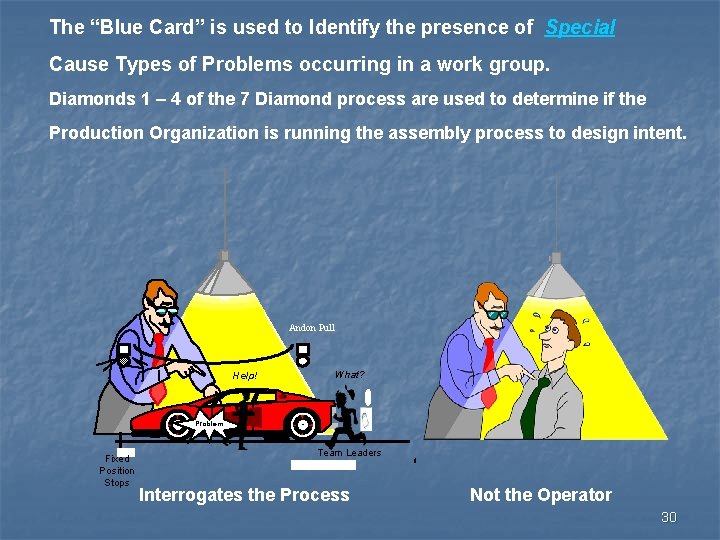
The “Blue Card” is used to Identify the presence of Special Cause Types of Problems occurring in a work group. Diamonds 1 – 4 of the 7 Diamond process are used to determine if the Production Organization is running the assembly process to design intent. Andon Pull Help! What? Problem Fixed Position Stops Team Leaders Interrogates the Process Not the Operator 30
STANDARDIZED WORK TEAM Presentation starts here. ETM 627 Fall 2008 Slide
- Slides: 31