Quality Management Statistical Quality Control Methods Statistical Process


 1% 0. 99 0. 97 2% 1.")


 Statistical method for determining whether a particular")


 l Flowcharts l Check sheets l Histograms l")


")
- Slides: 66
Quality Management
Statistical Quality Control Methods Statistical Process Control Acceptance Sampling Attributes Variables Attributes Type of Data Variables
Statistical Quality Control Methods Attribute Data: data which count items, such as the number of defective items on a sample Variable Data: data which measure a particular product characteristic such as length or weight
Statistical Quality Control Methods Sampling Error Sample results are not representative of the actual population or process The population or process is actually The sample says that the population or process is Customer’s risk Good or in control Bad or out of control Good or in control In agreement or Type II error Bad or out of control or Type I error In agreement Prducer’s risk
Acceptance Sampling Designing a Sampling Plan for Attribute Costs to justify inspection Full or 100% inspection or not? Cost to Inspect Cost incurred by passing a reject
Acceptance Sampling Purpose of Sampling Plan • Find its quality • Ensure that the quality is what it is supposed to be
Acceptance Sampling Designing a Sampling Plan for Attribute n: Number of units in the sample depended on the lot size c: the acceptance number AQL (acceptable quality level): maximum percentage of defects that a company is willing to accept LTPD (lot tolerance percent defective): minimum percentage of defects that a company is willing to reject : producer’s risk : consumer’s risk
Acceptance Sampling Designing a Sampling Plan for Attribute =0. 05 =0. 10 c LTPD/AQL n AQL 0 1 2 3 4 5 6 7 8 9 44. 890 10. 946 6. 509 4. 890 4. 057 3. 549 3. 206 2. 957 2. 768 2. 618 0. 052 0. 355 0. 818 1. 366 1. 970 2. 613 3. 286 3. 981 4. 695 5. 426 MIL-STD-105 E
Acceptance Sampling -Example AQL=2% =0. 05 =0. 10 LTPD=8%
Operating Characteristic Curve
Operating Characteristic Curve p np P(r c) 1% 0. 99 0. 97 2% 1. 98 0. 95 …
Acceptance Sampling Determine a Sampling Plan for Variables Control Limit: Points on an acceptance sampling chart that distinguish the accept and reject regions. Also, points on a process control chart that distinguish between a process being in and out of control. Sample size
Acceptance Sampling l Example ABC Electronics Company buys a 50 -ohm resistor from an outside Vendor. From historical data, the standarddeviation for the resistor is 3 ohms. Determine the appropriate control limits if we use a sample Size of n=100 and we want to be 95% confident that the sample Results are truly representative of the total population.
Acceptance Sampling Determine a Sampling Plan for Variables
Acceptance Sampling l Example Continuing with the resistor problem, we can tolerate some variation in the number of ohms in each resistor. However, if the number of ohms falls below 49, then we would have a serious problem in our electrical circuit. What is the probability of us accepting a lot when the average resistance is 49 ohms or less.
Acceptance Sampling LCL
Acceptance Sampling l Example 8. 53%
Statistical Process Control Statistical process control (SPC) Statistical method for determining whether a particular process is in or out of control. Central Limit Theorem
Statistical Process Control
Statistical Process Control
Statistical Process Control SPC Using Attribute Measurement Attribute data are data that are counted, such as good or bad units produced by a machine. Samples defects Sample size=6 defects=2
Statistical Process Control SPC Using Attribute Measurement Center line = = Long-run average percent defective Standard deviation of sample = Note: x~Bernoulli distribution
Statistical Process Control Variable Measurements Using X and R Charts An X chart tracks the changes in the means of samples by plotting the means that were taken from a process. An R chart tracks the changes in the variability by plotting the range within each sample.
Statistical Process Control Notations: m = total number of samples n = total number of items in the sample Rj = difference between the highest and lowest values in sample j
Statistical Process Control Variable Measurements Using X and R Charts Setup Control Chart: 1. 2. At least 25 samples Setup control limits Control limits for Upper control limit for Lower control limit for
Statistical Process Control n A 2 2 3 4 5 6 7 8 9 10 11 12 13 1. 88 1. 02 0. 73 0. 58 0. 42 0. 37 0. 34 0. 31 0. 29 0. 27 0. 25 D 3 D 4 n A 2 D 3 D 4 0 0 0. 08 0. 14 0. 18 0. 22 0. 26 0. 28 0. 31 3. 27 2. 57 2. 28 2. 11 2. 00 1. 92 1. 86 1. 82 1. 78 1. 74 1. 72 1. 69 14 15 16 17 18 19 20 0. 24 0. 22 0. 21 0. 20 0. 19 0. 18 0. 33 0. 35 0. 36 0. 38 0. 39 0. 40 0. 41 1. 67 1. 65 1. 64 1. 62 1. 61 1. 60 1. 59
Statistical Process Control
Process Capability
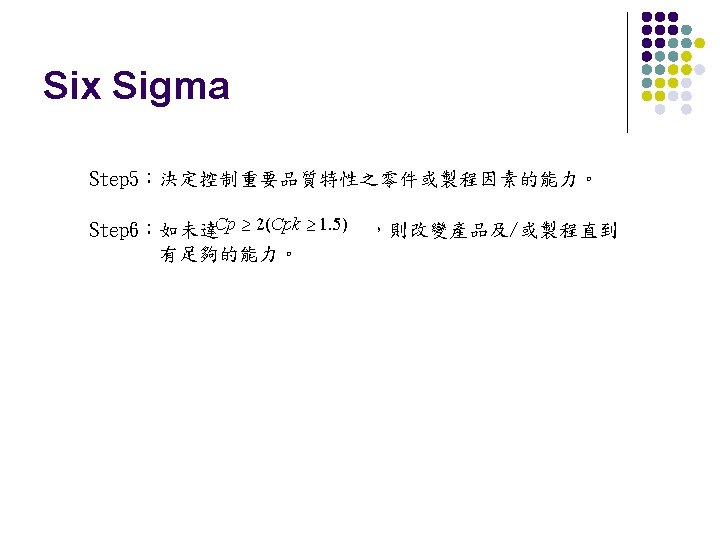
Process Capability Ratio The larger the ratio, the greater the potential for producing parts within tolerance from the specified process.
Process Capability Index To determine whether the process mean is closer to the upper specification limit, or the lower specification limit.
Quality Certification l ISO 9000 l l Set of international standards on quality management and quality assurance, critical to international business ISO 14000 l A set of international standards for assessing a company’s environmental performance
Total Quality Management l A philosophy that involves everyone in an organization in a continual effort to improve quality and achieve customer satisfaction.
The TQM Approach 1. 2. 3. 4. 5. Find out what the customer wants Design a product or service that meets or exceeds customer wants Design processes that facilitates doing the job right the first time Keep track of results Extend these concepts to suppliers
Elements of TQM l l l l l Continual improvement Competitive benchmarking Employee empowerment Team approach Decisions based on facts Knowledge of tools Supplier quality Champion Quality at the source Suppliers (partners in the process )
Continuous Improvement l Philosophy that seeks to make never-ending improvements to the process of converting inputs into outputs. l Kaizen: Japanese word for continuous improvement.
Quality at the Source The philosophy of making each worker responsible for the quality of his or her work.
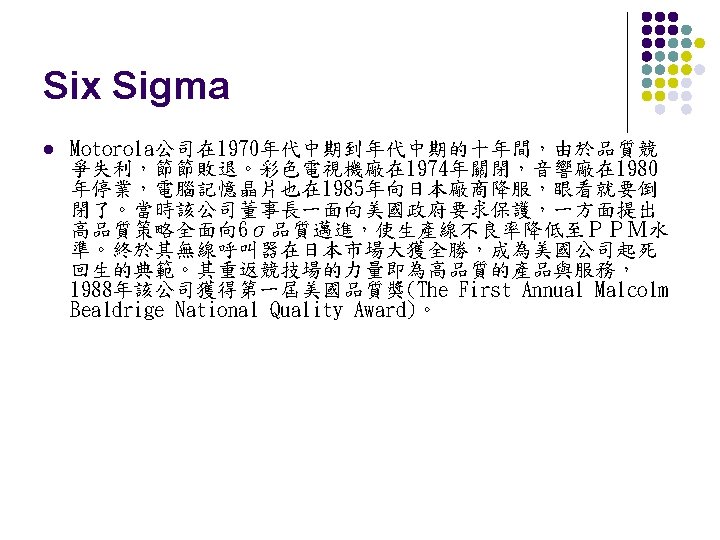
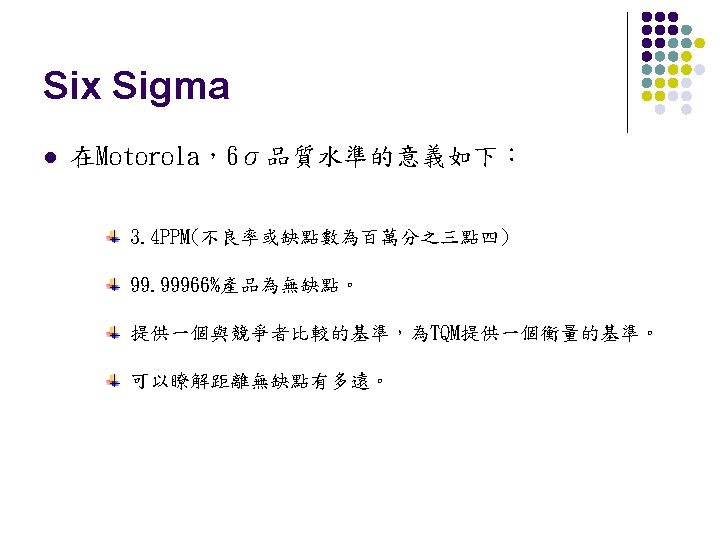
Six Sigma Quality improvement program developed by Motorola to reduce process variation to 50% of design tolerance Cp=1; defect rate = 2700 per million parts Cp=2; defect rate = 3. 4 per million parts
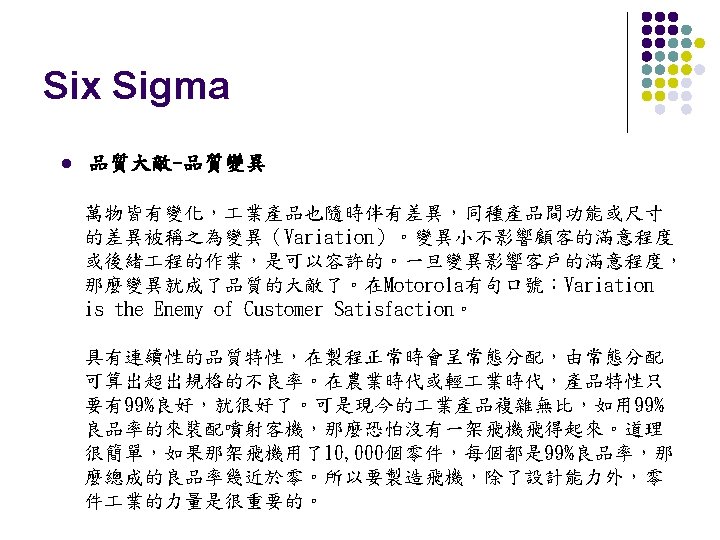
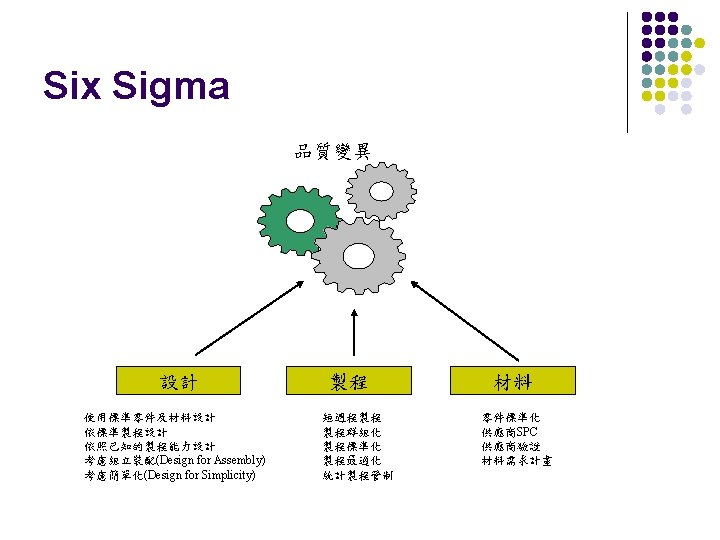
Six Sigma Our Customers Feel the Variance, Not the Mean Often, our inside-out view of the business is based on average or mean-based measures of our recent past. Customers don’t judge us on averages, they feel the variance in each transaction, each product we ship. Six Sigma focuses first on reducing process variation and then on improving the process capability. Customers value consistent, predictable business processes that deliver world-class levels of quality. This is what Six Sigma strives to produce. Source: GE
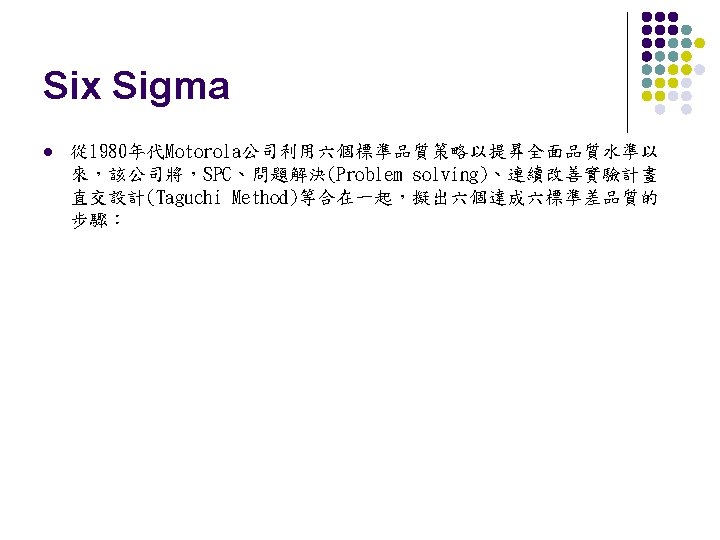
Six Sigma Motorola公司認為數據是滿足顧客的關鍵: 如果不能用Data表示我們所知的,那麼我們對它所知不多 (If we cannot express what we know in numbers, we don't know much about it) 如果對它所知不多,又怎樣控制它 (If we don't know much about it, we cannot control it) 如果我們不能控制它,那只有靠運氣了 (If we cannot control it, we are at the mercy of chance)
The Process Improvement Cycle
Process Improvement Tools (Basic Quality Tools) l Flowcharts l Check sheets l Histograms l Pareto Charts l Scatter diagrams l Control charts l Cause-and-effect diagrams l Run charts
Flowchart
Check Sheet Billing Errors Wrong Account Wrong Amount A/R Errors Wrong Account Wrong Amount Monday
A Special Purpose Check Sheet
Histogram
Pareto Analysis 80% of the problems may be attributed to 20% of the causes.
Scatter diagram
Control Chart
Cause-and-Effect Diagram
Example
Diameter Run Chart Time (Hours)