QUALITY MANAGEMENT II Total Quality Management LEARNING OBJECTIVES

QUALITY MANAGEMENT II Total Quality Management

LEARNING OBJECTIVES …to understand the concept of Total Quality Management …to be able to use the tools for evaluating and ensuring quality performance
 l l l Development Maintenance Improvement (Feigenbaum, 1986)")
TOTAL QUALITY CONTROL (TQM) l l l Development Maintenance Improvement (Feigenbaum, 1986)

DEFINITION OF TQM “an effective system for integrating the quality development, quality maintenance and quality improvement efforts of various groups in an organization. …to enable production and service at the most economical levels which allow for full customer satisfaction”. (Feigenbaum, 1986)

THE SCOPE OF TQM “For an organization to be truly effective, every single part of it, each department, each activity, and each person at each level must work properly together. Everybody in an organization is affected by the actions of everyone else. ” (Muhlemann, 1992)

THE MAIN ASPECTS OF TQM 1. Overarching approach to servicing the consumer’s expectations 2. It is a way of thinking and working in operations 3. Top down approach with bottom up support
 SERVICING THE CUSTOMER l l The dedication to quality is a positive")
1. ) SERVICING THE CUSTOMER l l The dedication to quality is a positive contributor to the growth and prosperity of the company Define quality attributes
 WORKING IN OPERATIONS l l Measure quality attributes Analyze the variables that")
2. ) WORKING IN OPERATIONS l l Measure quality attributes Analyze the variables that cause quality defects Improve processes to crate and produce quality products Control processes so that the same problem do not reoccur
 A TOP DOWN APPROACH l l l Involve top management Encourage training")
3. ) A TOP DOWN APPROACH l l l Involve top management Encourage training and education of all employees Continuously improve processes

JURAN’S TEN STEPS TO QUALITY IMPROVEMENT 1. 2. 3. 4. 5. 6. 7. 8. 9. 10. Build awareness (needs and opportunities) Set goals Organise to meet goals Provide training Implement projects Report on progress Give recognition Communicate results Keep score Maintain by integrating improvement in the business structure

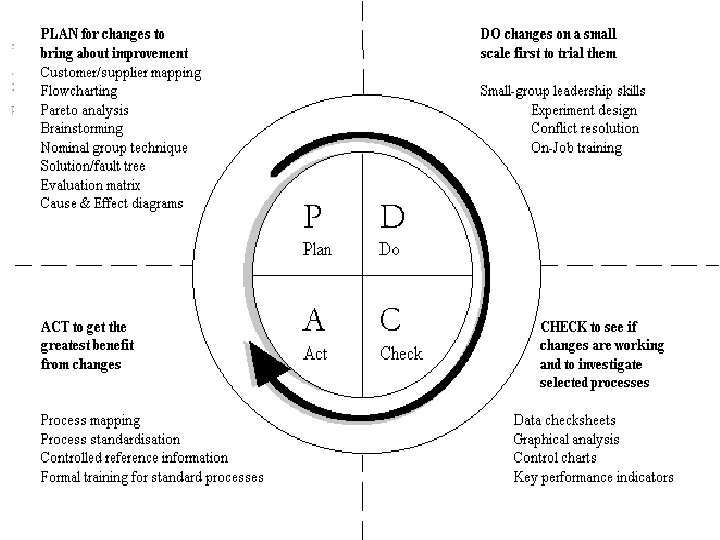
THE DEMING CIRCLE Plan for changes to bring about improvement Do changes on a small scale first to trial them Act to get the greatest benefit from changes Review see the progress of improvements

BASIC TOOLS AND TECHNIQUES FLOW CHARTS PROCESS FLOWCHARTING ü ü ü PARETO DIAGRAM Provides a complete picture Identifies the obvious and the unexpected Team approach PARETO ANALYSIS ü ü ü 80 / 20 rule Identify the main problems Prioritises problem solving

STATISTICAL PROCESS CONTROL CHARTS ü ü ü Predicts risk of value Allows corrections before failure Establishes confidence levels SCATTER DIAGRAMS ü Measures the dispersion of values ü ü SCATTER DIAGRAM Regional variations e. g. shoe size x Identifies correlation between values ü ü Brand loyalty and Gender Tastes for size and colour and age x x x x x

BRAINSTORMING ü Generates a large number of causes from different perspectives ü ü Poor garment availability on the shelve Extremes have equal weighting ü Poor displays or packaging CAUSE AND EFFECT ANALYSIS ü ü Maps inputs that affect quality Ishikawa diagrams CAUSE-EFFECT (ISHIKAWA) DIAGRAM

SMART APPROACH ü ü ü Specific objectives Measurable quality Achievable targets Realistic time scales Timely review of progress

A SYSTEMATIC APPROACH ü ü Uses reliable methods Consistent and repeatable assessment Produces factual appraisal Academic rigor

CRITISISM OF TQM ü ü ü Costing structures do not relate to functions Requires constant commitment from Senior Management Bureaucracy of procedures Not radical or challenging enough Exploitation of employee’s knowledge
- Slides: 18