Quality Management GBOR RVA Statistical Process Control SPC
 25. February 2019 DEPT. OF MANAGEMENT")
Quality Management GÁBOR ÁRVA Statistical Process Control (SPC) 25. February 2019 DEPT. OF MANAGEMENT AND BUSINESS ECONOMICS FACULTY OF ECONOMIC AND SOCIAL SCIENCIES BUDAPEST UNIVERSITY OF TECHNOLOGY AND ECONOMICS

Memo – Quality Control • Mass production – Shewart: 1924 Bell Labs • Measures conducted during the manufacturing process on an appropriate sample • Main aim to control and regulate the processes, to prevent defective products 2

Memo – Process improvement and quality management tools Something wrong? Flowchart Pareto analysis Cause and effect diagram (Ishikawa) Monitoring process performance Brainstorming 3

SPC methods to be learned • Control charts – Detecting problems within the process • Process capability indices – The process’ ability to meet the customers’ requirements 4
 – Cumulative effect of many,")
Common and special causes • Common causes (in-control process) – Cumulative effect of many, small, unavoidable causes – Always assumed to be present in the process – Humidity, temperature…. 5
 – Occasionally present – Result")
Common and special causes • Special causes (out-of-control process) – Occasionally present – Result in an unacceptable level of process performance – Defective raw material, improperly adjusted machines, operator errors 6

Objective of control charts • Distinguish common and special causes • Detect the occurrence of special causes – Operator action is necessary to eliminate them • Prevent the production of flawful product 7

Mathematical background • 8

Processes in- and out-of control In-control process Out-of-control process Special causes shift the process mean/variability and many nonconforming units are produced 9

Control charts 10

Types of Shewart control charts • 11

Establishing the control charts • 12
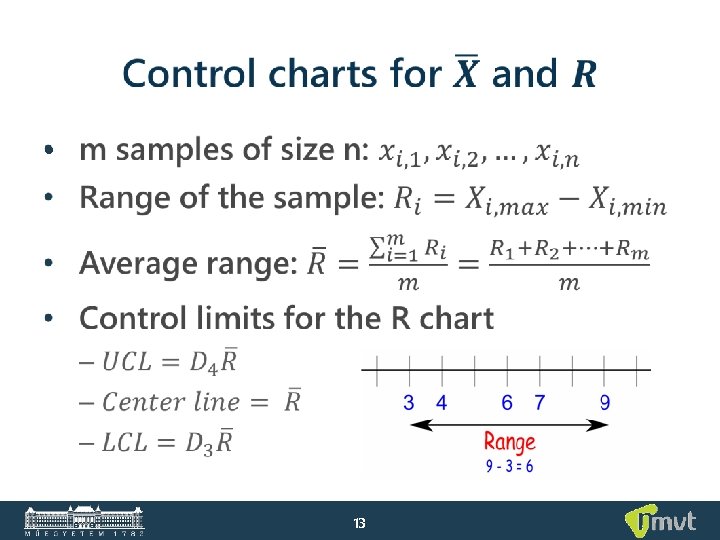
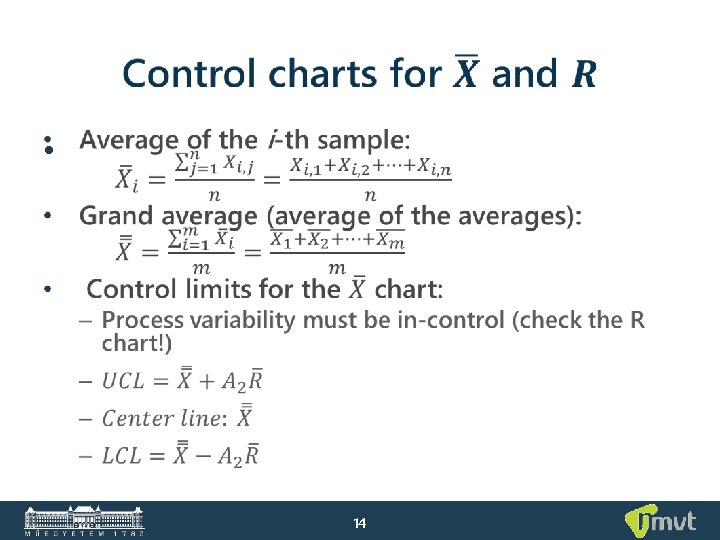

Phase I and II application of Control Charts • Phase I. – Retrospective analysis • Based on 20 -25 samples – Trial control limits – Bringing the process into the state of statistical control • Phase II. – Monitoring process performance – OCAP: Out-of-control Action Plan • Actions necessary to eliminate the special causes 15

Benefits of control chart application • Improving productivity • Preventing defects • Avoiding unnecessary process adjustments • Providing diagnostic information • Estimating process capability 16

Performance of control charts • 17

OC curves • 18

Process capability analysis • Only for in-control process • Analyzing the process’ variability relative to product requirements • Main objectives: – Predicting the number of nonconformities – Selecting between suppliers – Reducing the variability of the process • Meeting customers’ expectations • Decreasing the number of nonconforming products 19

Capability of our process Not capable Capable 20

Histograms • Visual impression of the process performance 21

Histograms • Possible causes of poor process performance – Poorly located center (shift in the mean) – Excess variability 22

Process capability ratio ± 3 s Cp = 1 a = 0, 27 % 23

Process capability ratio 24
 1, 00 2700 1,")
Process capability ratio Requirements and process fallout ppm (process fallout) 1, 00 2700 1, 33 63, 5 1, 67 2, 00 0, 57 0, 002 Standard minimum value in most industries Parameters related to safety Word-class organizations, Six. Sigma 25

One-sided process capability ratios • 26

Process capability indices The Cp index does not take into account whether the process is centered at the midpoint of the specification interval or not Cp = 1 27

Cpk index – off-center process USL-m m-LSL 28

Relationship between Cp and Cpk • Cpk: Current capability of the process • Cp: Potential capability of the process – Can be achieved by centering the process USL CL-Target LSL 29

Selecting between suppliers • 30

Selecting between suppliers • • 31

Estimating the parameters • 32

Control vs. specification limits • Control limits • – In-control process: its parameters are stable over time Specification limits – Determined based on the current variability of the process – A point outside the control limit indicates that there is a shift in the process mean / standard deviation, that is, the process is NOT stable over time – Determined externally – The 3 sigma deviation of the process is compared to the specification limits – The area outside of the specification limits is proportional to the process fallout – A capable process: able to meet the customers’ requirements 33
 DEPT. OF MANAGEMENT AND")
Quality Management Practice 2. GÁBOR ÁRVA Statistical Process Control (SPC) DEPT. OF MANAGEMENT AND BUSINESSECONOMICS FACULTY OF ECONOMIC AND SOCIAL SCIENCES BUDAPEST UNIVERSITY OF TECHNOLOGY AND ECONOMICS 34 27. October 2017

SPC methods • Control charts – Achieving process stability – Checking whether the parameters are stable over time – Detecting deviations in the production process that would lead to nonconforming units • Process capability analysis – Evaluating the process performance – Reducing the variability in order to continuously meet customers’ requirements – Predicting the number of defective items 35

Mathematical background • 36

Processes in- and out-of control In-control process Out-of-control process Special causes shift the process mean/variability and many nonconforming units are produced 37

Capability of our process Not capable Capable 38

Control vs. specification limits • Control limits • Specification limits – Determined based on the current variability of the process – A point outside the control limit indicates that there is a shift in the process mean / standard deviation, that is, the process is NOT stable over time – In-control process: its parameters are stable over time – Determined externally – The 3 sigma deviation of the process is compared to the specification limits – The area outside of the specification limits is proportional to the process fallout – A capable process: able to meet the customers’ requirements 39

Monitoring the process’ performance • 40

Establishing the control limits • 41

Capability assessment • 42
 • The battery of a mobile phone should have a")
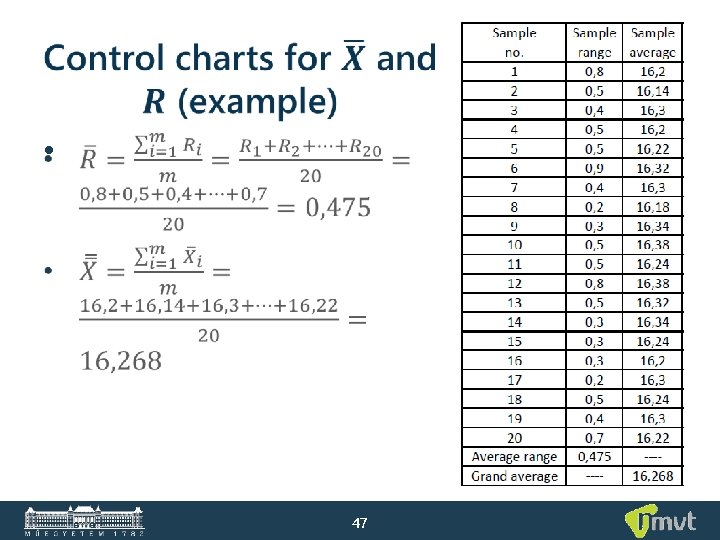
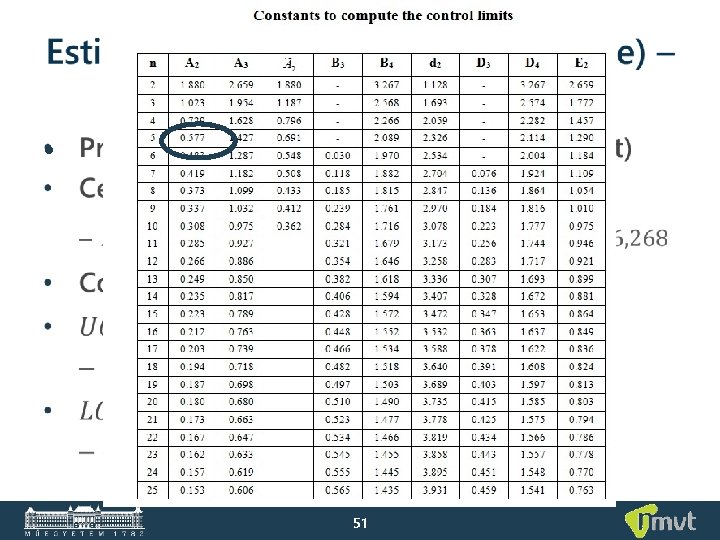
Estimating the parameters (example) • The battery of a mobile phone should have a nominal output voltage of 16 V. During 20 hours, each hour a sample of 5 units have been taken, and the batteries’ nominal output voltage have been measured. – Set up the X bar and R charts! Is the process in statistical control? – Estimate the • Parameters of the process (mean and standard deviation)! • The actual capability of the process if the specifications are LSL=15 V and USL=17 V! • The potential capability of the process! 43
data sheet • 44")
Estimating the parameters (example)data sheet • 44
 – sample data • Sample no. 7 Data on nominal")
Estimating the parameters (example) – sample data • Sample no. 7 Data on nominal output voltage x 1 x 2 x 3 x 4 x 5 16, 1 16, 3 16, 5 16, 1 16, 5 45
 sample data • Sample no. 16 Data on nominal output")
Estimating the parameters (example) sample data • Sample no. 16 Data on nominal output voltage x 1 x 2 x 3 x 4 x 5 16, 0 16, 2 16, 3 16, 2 46
 – sample data 48")
Estimating the parameters (example) – sample data 48
 – R chart • 2021. 03. 11. 49 49 x")
Estimating the parameters (example) – R chart • 2021. 03. 11. 49 49 x

R-chart 50

52
population mean&standard deviation • 53")
Estimating the parameters (example)population mean&standard deviation • 53
process capability indices 1, 00 ppm (process fallout) 2700 1, 33")
Estimating the parameters (example)process capability indices 1, 00 ppm (process fallout) 2700 1, 33 1, 67 2, 00 63, 5 0, 57 0, 002 • 54
 55 1, 00 2700 1, 33 63, 5")
Let’s draw! • ppm (process fallout) 55 1, 00 2700 1, 33 63, 5 1, 67 0, 57 2, 00 0, 002

15 15. 04 15. 08 15. 12 15. 16 15. 24 15. 28 15. 32 15. 36 15. 44 15. 48 15. 52 15. 56 15. 64 15. 68 15. 72 15. 76 15. 84 15. 88 15. 92 15. 96 16 16. 04 16. 08 16. 12 16. 16 16. 24 16. 28 16. 32 16. 36 16. 44 16. 48 16. 52 16. 56 16. 64 16. 68 16. 72 16. 76 16. 84 16. 88 16. 92 16. 96 17 Let’s draw! Cp 56 Cpk

Practice 12. • 57

58

Formulas Charts Capability assessment • • 59

Thank You for Your kind attention! GÁBOR ÁRVA ARVA@MVT. BME. HU DEPT. OF MANAGEMENT AND BUSINESS ECONOMICS FACULTY OF ECONOMIC AND SOCIAL SCIENCES BUDAPEST UNIVERSITY OF TECHNOLOGY AND ECONOMICS 60
- Slides: 60